Two Inter-Asset Relationships Worth Monitoring if You Want to Stay Bullish

Stocks discount future swings in economic activity and therefore respond favorably when commodity and interest rate volatility remains under control. At some stage in the business cycle, however, accelerating commodity prices and rising interest rates begin to threaten the recovery’s sustainability. Equity investors typically anticipate this shift well in advance, causing stocks to weaken before the economy itself shows clear signs of stress.
One way of identifying such potential turning points is to closely monitor the relationships between stocks and commodities along with stocks and bonds. These intermarket ratios can often provide valuable advance warning that a critical inflection point may be approaching, which is the focus of this article. Let's begin with the stock/commodity relationship and examine where it currently stands.
Stock/Commodity Ratio
Chart 1 compares the S&P Composite with the S&P/CRB ratio, our chosen measure of the relationship between stocks and commodities. To identify the long-term cyclical rhythm, the lower panel plots the long-term Know Sure Thing (KST) of the ratio.
The red arrows identify momentum peaks that occurred at or above the green horizontal line. Most of these signals were followed either by a meaningful market decline, as in 2000, or by an extended period of heightened volatility, as in 2011. The two dashed arrows represent false signals that failed to produce a significant negative outcome.
The latest signal, generated in 2025, has yet to exert any meaningful downside pressure on equities. In that respect, the current situation resembles the 2021 signal, whose adverse effects were delayed until the oscillator crossed below the zero line (see the left-hand scale). The KST for this ratio is now sitting almost precisely at that threshold, making it particularly important to watch. The key question is whether history will repeat itself again.
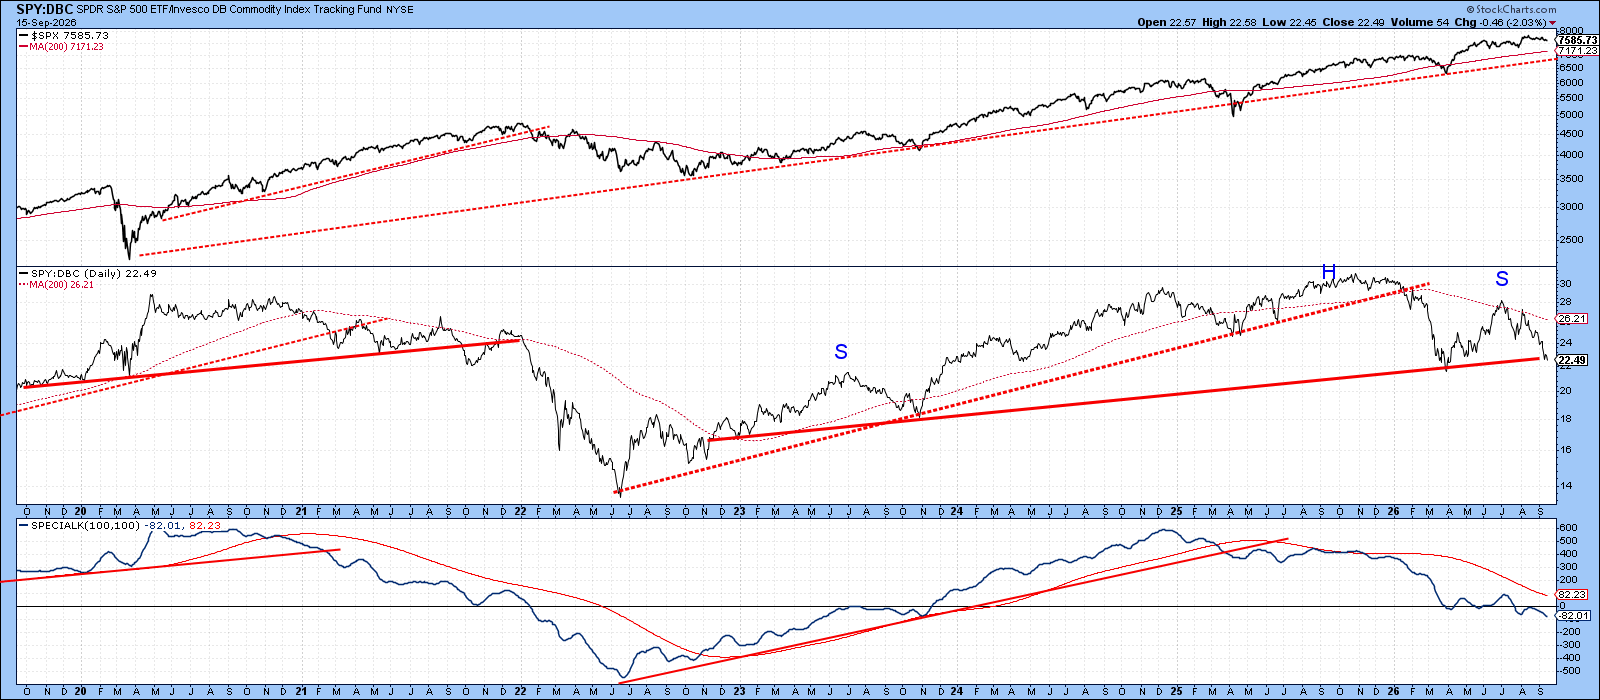
Chart 2 indicates that the ratio has reached a pivotal support zone at the neckline of a potential upward-sloping head-and-shoulders top. While an oversold condition argues for a near-term relief rally, the weight of the evidence continues to favor a bearish long-term outcome.
In particular, the Special K indicator is flashing warning signs that are consistent with a deteriorating primary trend. As a result, any short-term strength should be viewed cautiously, since the longer-term trend appears poised to reassert itself.
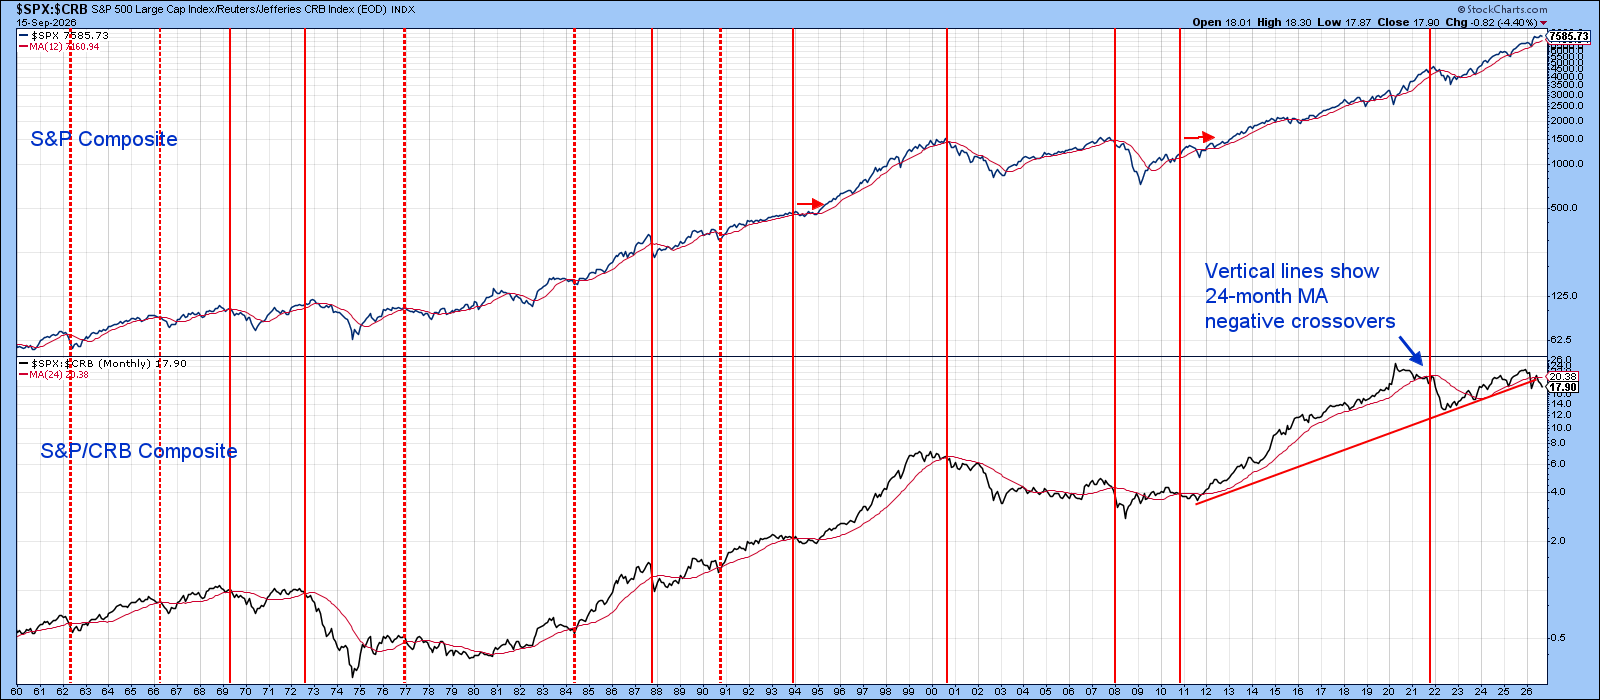
The recent violation of the ratio’s 24-month moving average (MA) and post-2011 uptrend line in Chart 3 suggests the same thing.
Stock/Bond Ratio
Chart 4 highlights KST sell signals for the ratio between the S&P Composite and 30-year Treasury bond prices. The small red arrows show that most of these signals have coincided with either a meaningful correction or an extended period of market turbulence for equities.
That has not really been the case following the 2025 signal. In fact, the KST has recently turned tentatively higher. Should that reversal prove sustainable, it would argue for a further extension of the current bull market, since it would suggest that investors remain relatively unconcerned about falling bond prices and rising long-term interest rates.
The main risk lies in a break below the post-2020 uptrend line. History offers a cautionary precedent: a completed trendline violation in the ratio at the end of 2007 was followed by a severe bear market in equities. That trendline, along with its 12-month moving average, currently stands near 63, compared to the latest reading of roughly 71. Consequently, the ratio still enjoys a reasonable cushion before entering a more vulnerable position.
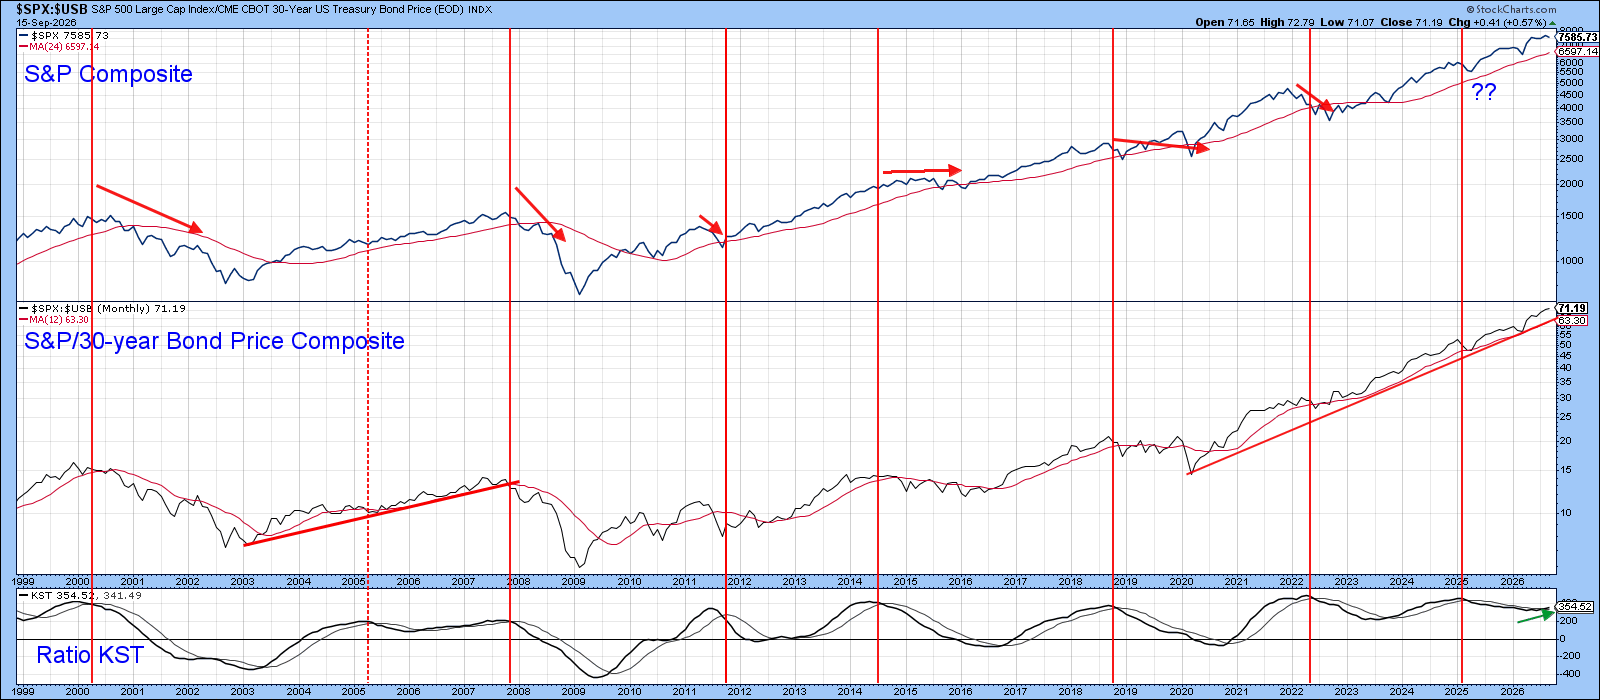
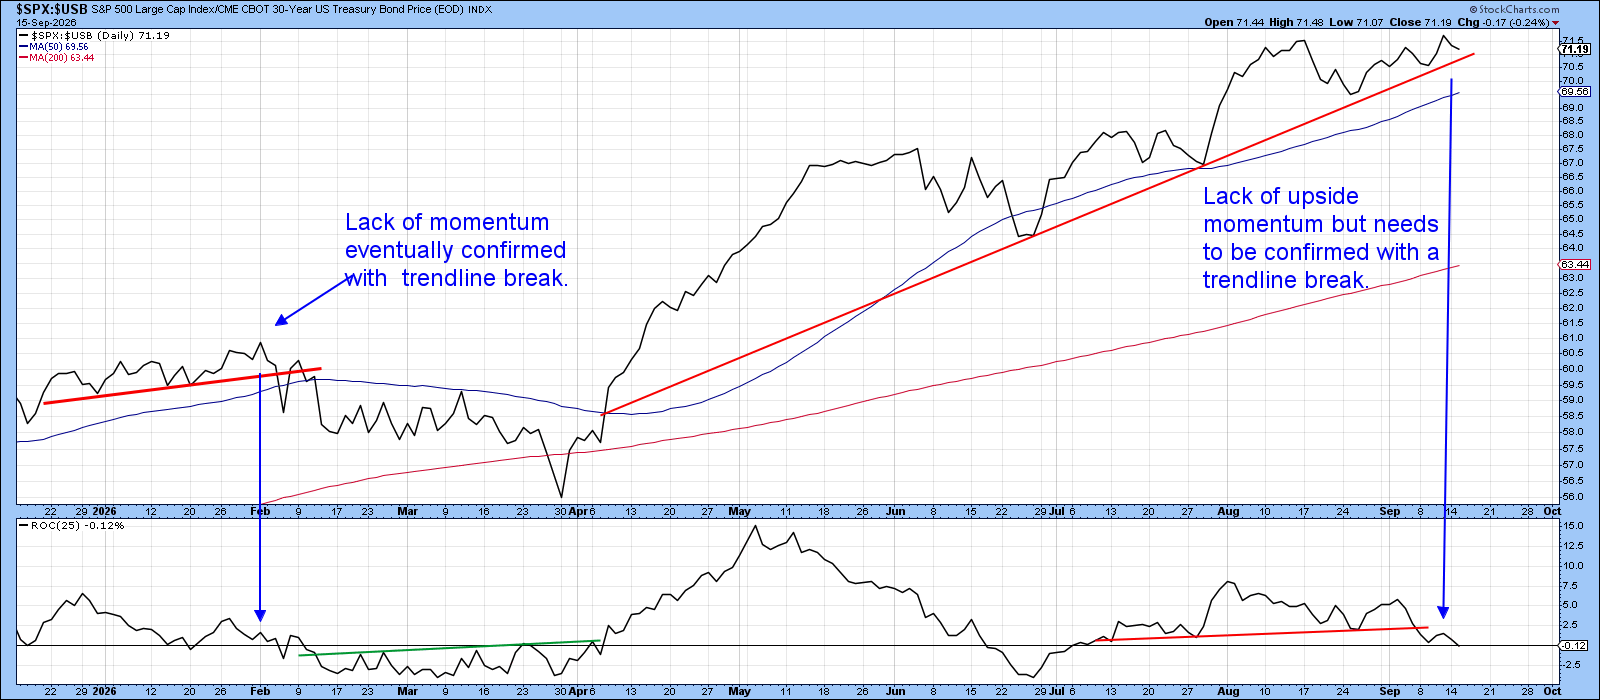
Chart 5 suggests that this cushion may be less substantial than it first appears. The ratio is currently hovering just above its 2025 uptrend line at a time when the Rate of Change (ROC) is only marginally positive. Such a combination reflects waning upside momentum and leaves the ratio vulnerable to a downside break.
Should that be confirmed with a trendline violation, the implications could be significant. Similar setups, in which a weakening ROC precedes a trendline break, have often been followed by declines that were considerably larger than average. Consequently, this relationship deserves scrutiny, as a seemingly benign deterioration could quickly evolve into a much more serious warning for equities.
The Bottom Line
It’s still too early to conclude that the Stock/Commodity and Stock/Bond ratios have peaked for this cycle. Nevertheless, both relationships have now retreated to critical support levels. As long as those levels hold, the bull market can continue to benefit from a favorable intermarket backdrop. However, their proximity to support also means that investors should remain on alert. A decisive breakdown in either ratio would constitute an important warning that the balance is shifting away from equities and could signal the onset of a more challenging market environment.
Good luck and good charting,
Martin J. Pring
The views expressed in this article are those of the author and do not necessarily reflect the position or opinion of Pring Turner Capital Group of Walnut Creek or its affiliates. The Six Stages of the Business Cycle are followed each month in Martin Pring’s Intermarket Review.