Mag 7 Breakout Watch: Here’s Where the Glamour Stocks Could Go

Key Takeaways
- MAGS is nearing a key $71 breakout level, with a measured-move target of $88 potentially about to trigger.
- Absolute technical momentum and relative strength favor the Mag 7 amid a choppy broader market.
- Microsoft, Apple, and Meta are helping lead Mag 7 performance as September volatility picks up... with a new investor group increasingly eyeing MAGS.
The Fed decision came and went, and traders are now eyeing new volatility catalysts. Be careful what you wish for, though, as we are now headlong into the most bearish two-week seasonal calendar stretch. Downside swings are even more prevalent in midterm years, with less than seven weeks until folks head to the ballot box.
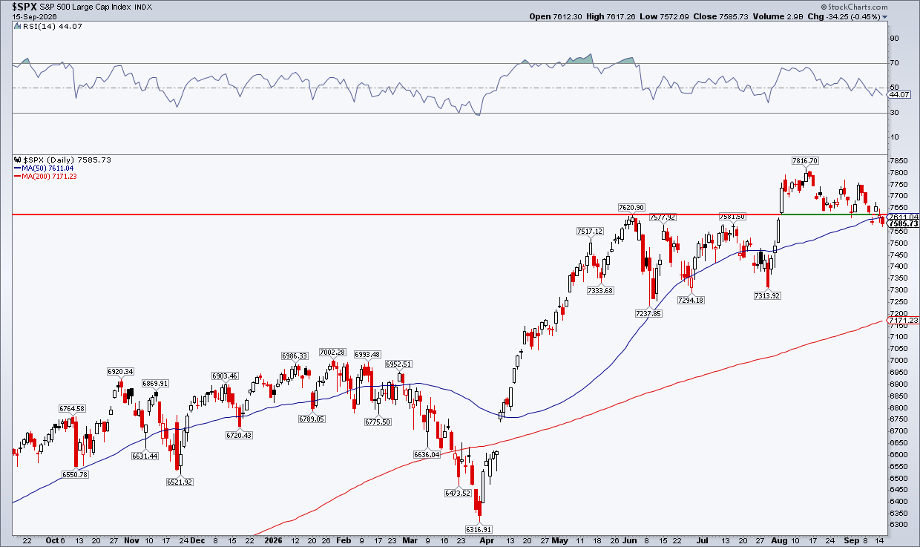
For a month now, investors’ votes haven’t favored bullish price action. The S&P 500 closed Tuesday below its 50-day moving average for the second session of the last four. Sans a stunning and brief rally in late July through early August (which lasted less than a week), the market’s mid-year campaign slogan has been “chop.” The SPX tagged 7620 on June 2, wobbled to the Leopold low on July 29, reached an August 13 all-time high of 7817, and now treads water close to 7600. Higher rates & small caps under pressure have been recent themes.
Amid the churn, familiar faces find themselves climbing up the performance leaderboard: the Mag 7.
Calling on the Glamour Stocks
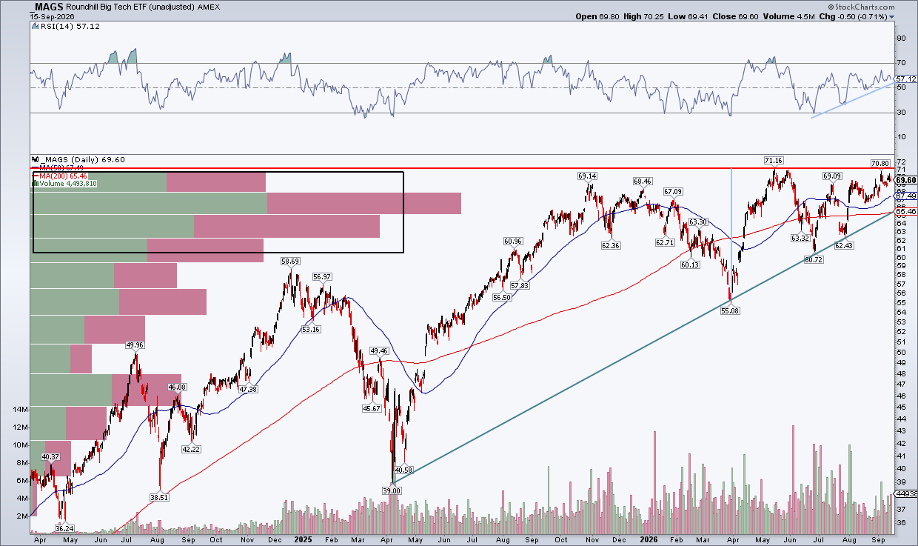
The Roundhill Big Tech ETF (MAGS), like the S&P, is little changed since early June. In fact, May 14 was its record high. Zoom further out and the Mag 7 ETF has been dead money back to late October 2025.
So why is the setup suddenly bullish? Classic technical signals, of course.
Notice in the chart below that the ETF sports a multi-year ascending triangle formation. The presumption is that price will resolve in the trend of larger degree (higher). The measured move upside target is $88 if MAGS busts through major resistance near $71. Simply take the $16 triangle height once the pattern is fully established and add that to the breakout level.
Also look at the long-term 200-day moving average. It’s on the rise, suggesting that the bulls control the primary trend. The 50-DMA is above the 200-DMA, with price above both trend indicator lines (bullish). Furthermore, the RSI momentum oscillator at the top of the SharpChart also prints a series of higher lows and, if we see the RSI jump above 75 or so upon a price breakout, that would be ideal confirmation. I also like that there’s now a high amount of volume-by-price below the current spot, which should offer cushion if we see some of that scary late-September action.
For now, support is not far away, at the uptrend line and 200-DMA (nearing $66).
Relative Strength Can’t Be Ignored
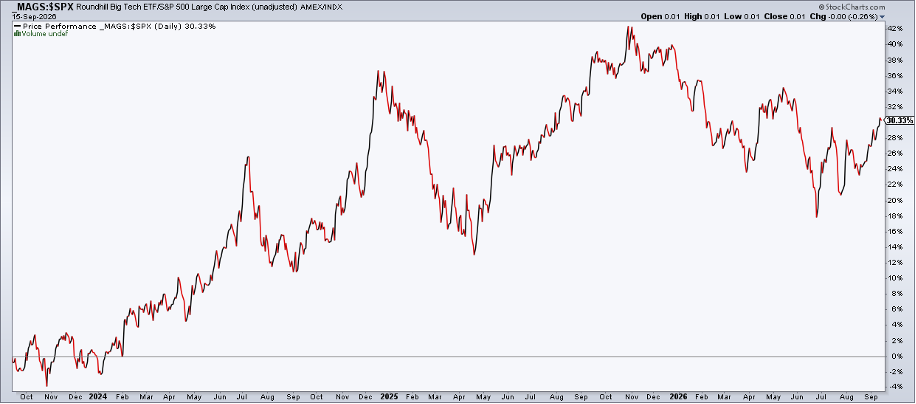
So, the absolute technical setup is ripe for a breakout, whether it occurs by quarter-end or once we get into a more favorable seasonal stretch beginning in October. Helping to confirm its appeal is relative strength, an often-overlooked piece of a well-rounded technical assessment. It gauges how an asset trades versus the broader market, and can be particularly useful during sideways markets.
Illustrating Recent Performance
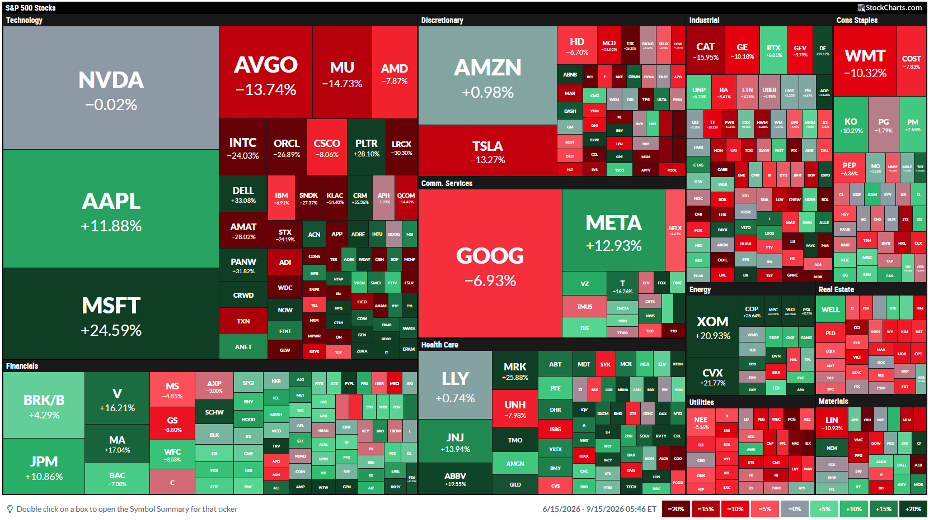
Indeed, MAGS has generated alpha since late June. Amid the sharp momentum selloff and great AI unwind this summer, U.S. mega-cap tech-related stocks have held their own. But leading the Mag 7 charge isn’t NVIDIA (NVDA) or Alphabet (GOOGL) (two previous winners), but shares of arguably the two most boring components: Microsoft (MSFT) and Apple (AAPL). The former has led software’s mid-year comeback, now +25% over the past three months. The latter has stumbled here and there, but still posts a market-beating 11% gain since mid-June, as you can see in the three-month S&P 500 MarketCarpet.
Meta Platforms (META) has also gotten through battles of its own, at least according to price, as the Comm Services giant now battles $690 once again.
Seeking Safety
From an intermarket standpoint, perhaps it’s not surprising that the biggest of big tech stocks stand their ground amid a lukewarm global stock market. As a group, they are now more diverse and (despite an increased debt burden) still well-capitalized.
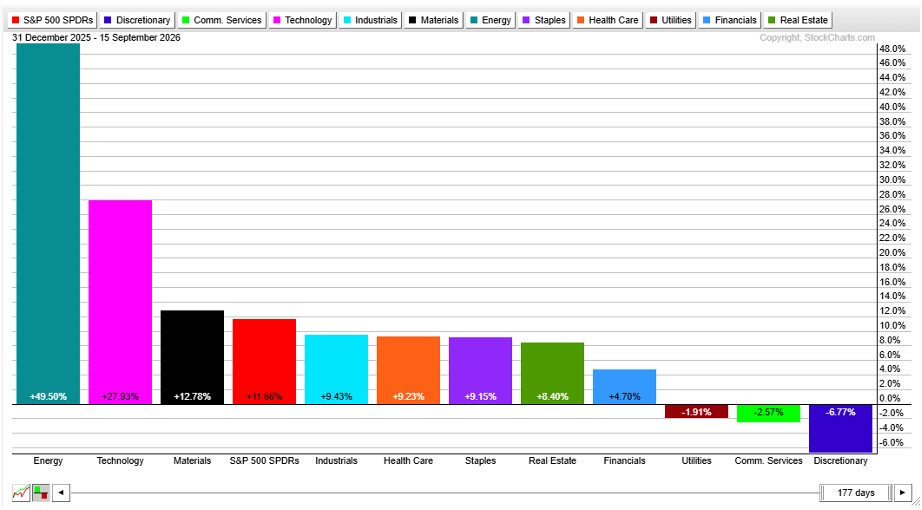
The Information Technology sector (which houses three of the Mag 7) is second only to Energy in YTD S&P 500 sector ETF performance, and hyperscalers like MSFT, GOOGL, AMZN, and META, to an extent, call the shots on overall AI spending. Many strategists forecast a return to increasing free cash flow (and, likely, stock buybacks) by 2028, which would buttress the bullish fundamental case.
A New & Growing Investor Cohort
Not to go too far down the fundamental rabbit hole, but perhaps investors seek the shareholder-return safety of several Mag 7 names. Consider that the top three U.S. dividend payers are all Mag 7 members: MSFT, NVDA, and GOOGL. Behind Exxon Mobil (XOM) and JPMorgan Chase (JPM) is AAPL, too. While they do not have beefy yields, these companies pay some of the biggest aggregate dividends (and are dividend growers).
So, the Mag 7 appeals not just to momentum traders, but (increasingly) long-term income investors.
The Bottom Line
The Mag 7 is on the brink of a breakout. Watch $71; if that’s breached, an upside target to $88 is in play. MAGS has plenty of relative strength, while its own technical indicators are generally healthy as we venture further into sketchy seasonality. With the Fed out of the way and a month before earnings season begins, all eyes will be on price action.
Disclaimer: This blog is for educational purposes only and should not be construed as financial advice. The ideas and strategies should never be used without first assessing your own personal and financial situation, or without consulting a financial professional.