Has a Double-Cycle Momentum Reversal Sounded a Warning for Stocks?

You're probably wondering what a Double-Cycle Momentum Reversal (DCMR) is. So was I, until recently.
Over the years, I noticed that some long-term KST sell signals were associated with either a sharp but brief sell-off, such as the 2020 pandemic shakeout, or a full-fledged bear market, such as the 2007–09 financial crisis. That observation eventually led me to develop the DCMR concept.
A normal sell signal is generated when the KST crosses below its nine-month moving average, regardless of where the preceding buy signal occurred. A bearish DCMR is more selective because it’s generated only when the previous buy signal develops at or above the zero line. These instances are identified in Chart 1 by the small green arrows, while the subsequent sell signals are flagged by the vertical red lines.
The level at which the buy signal is generated is an important distinguishing characteristic, as a reversal from below zero indicates that most, if not all, of the speculative excesses of the previous bull have been squeezed out. By that stage, bad economic news has typically been discounted, and a psychological and economic foundation for a new bull market has been established.
A DCMR buy signal, by contrast, doesn’t really launch a new bull market. Instead, it represents more of an extension to the existing one by creating a second cyclical upswing within the same primary trend, hence the term "double cycle." As a result, DCMRs often mark the culmination of an unusually prolonged period of investor optimism and a point of heightened market vulnerability. These secondary cycles can be relatively brief and last only a few months, like in 2020, or they can persist for a year or more, as was the case in the late 1990s.
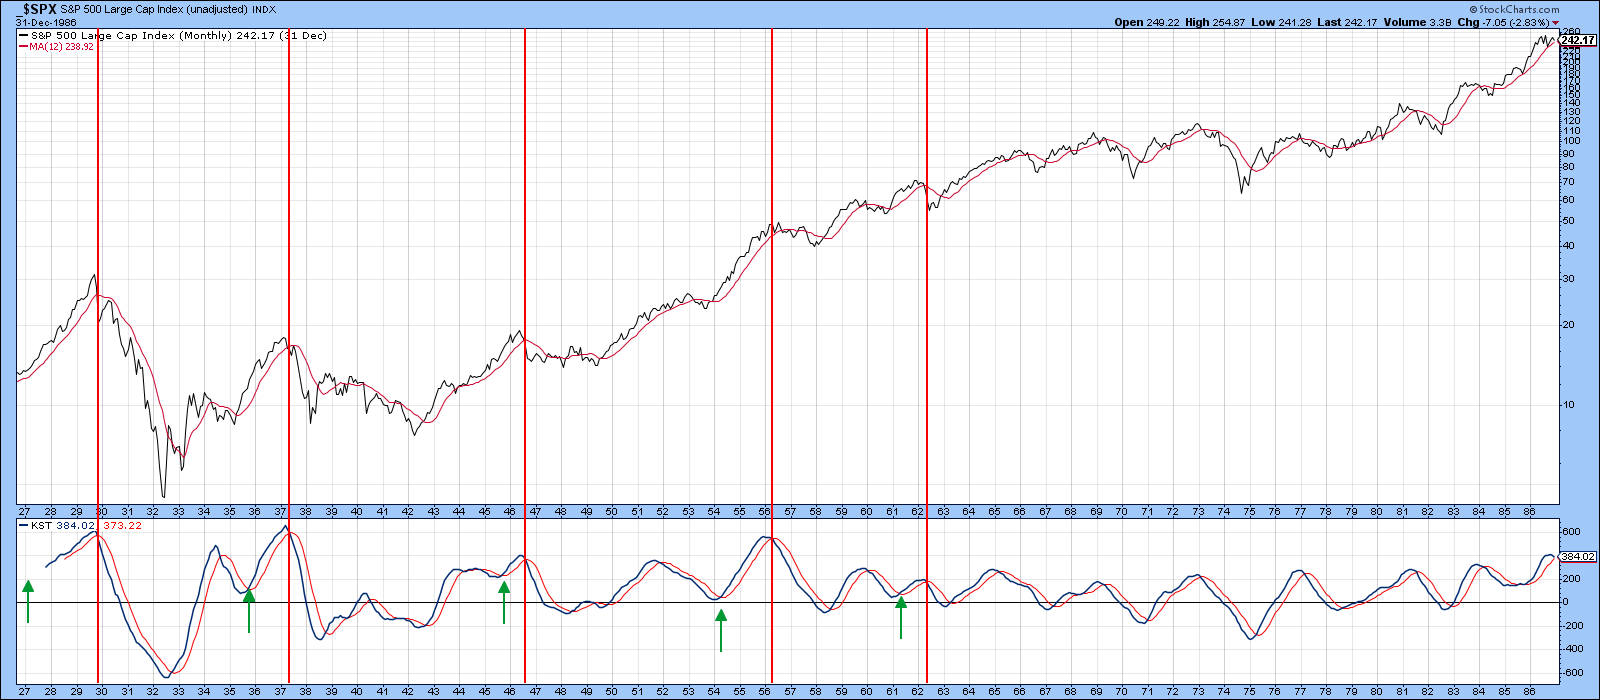
Historically, DCMR sell signals have preceded some of the market's most significant setbacks. Note that there’s insufficient data in Chart 1 to reveal when the buy signal preceding the 1929 DCMR occurred. Other data sources confirm that it occurred from an above-zero reading in mid-1927. Several other important market peaks appear in the chart in 1937, 1946, and 1957. No DCMR signals were generated between 1982 and the early 2000s, which emphasizes the point that they are quite rare.
Chart 2 brings the analysis up to date and illustrates one of the frustrations associated with this indicator. For example, the 1987 reversal was so abrupt that the DCMR sell signal occurred after the crash. Untimely signals were also generated in 1998 and 2020. Even so, the emergence of a DCMR in the absence of a meaningful decline is still valuable from a risk-management perspective because it alerts investors to the possibility that market conditions have become increasingly risky and they should adjust their exposure accordingly. The blue ellipse highlights the most recent action, which is examined in greater detail in Chart 3.
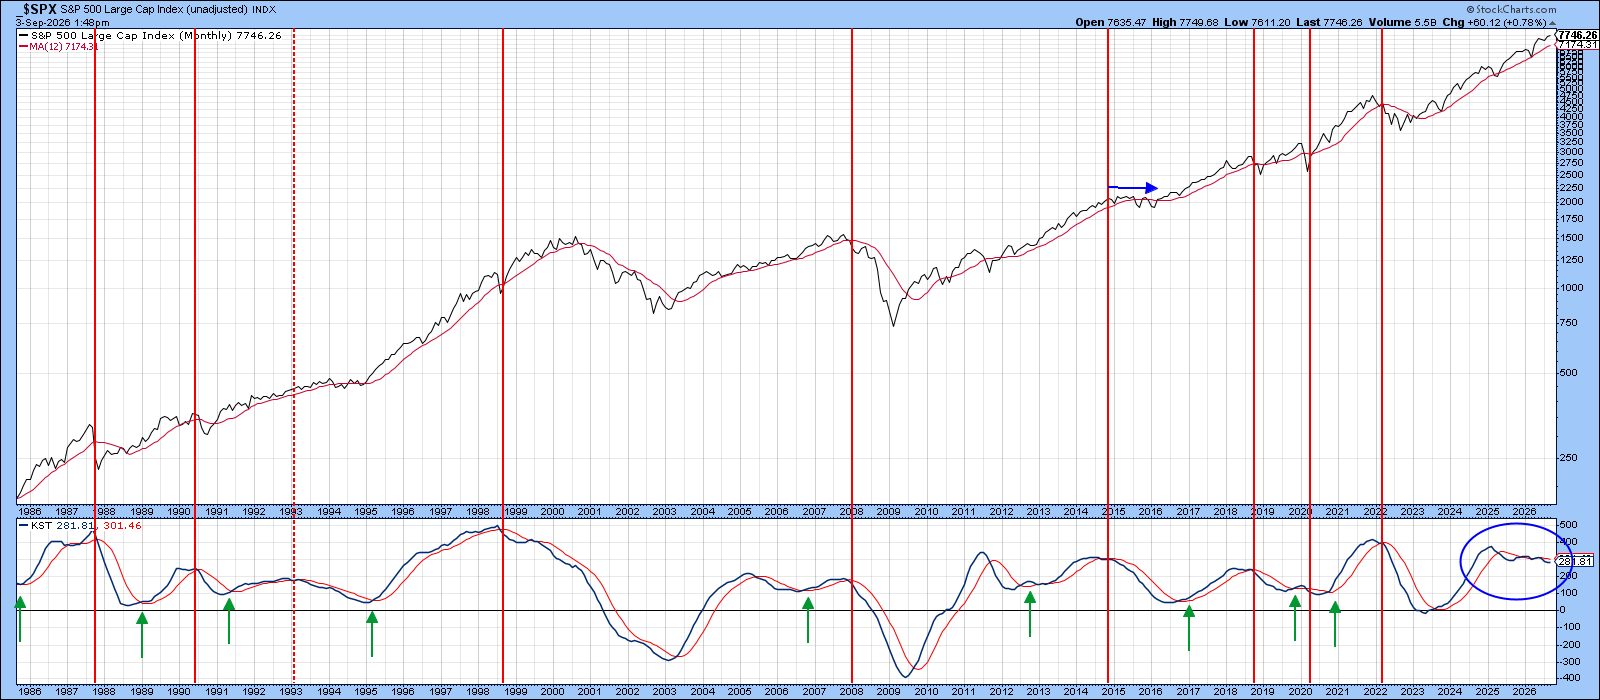
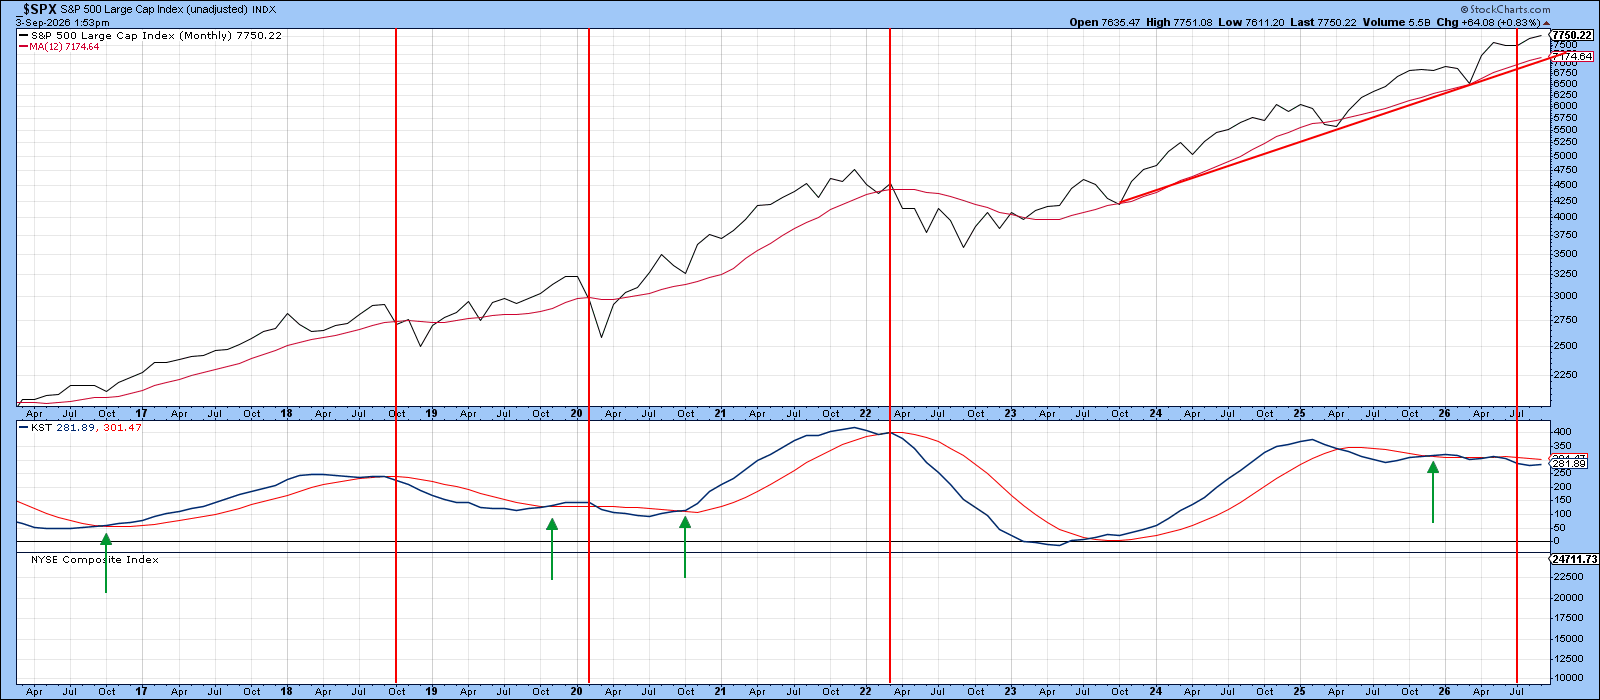
Chart 3 indicates that the KST generated a conventional buy signal in late 2023, followed by a countervailing sell signal in the spring of 2025. The relatively modest correction in the S&P 500 subsequently allowed the KST to register a DCMR buy signal late last year. However, the ensuing advance proved weak from a momentum perspective, leading to a sell signal in July.
Admittedly, the signal hasn't been particularly decisive. Nevertheless, the KST currently stands at roughly the same level as it did in late 2024. Over 200 years of charting history demonstrates that such a prolonged period of indecision at such an elevated level is highly unusual.
A comparable episode occurred in 2020 and was eventually resolved by an advance. However, that instance followed a brief recession, and the buy signal was generated from a much lower, and therefore more sustainable, level.
The Bottom Line
The DCMR approach loses much of its usefulness for securities that follow inherently cyclical trends, since the method depends on a double cycle forming, which doesn't happen often. As a result, commodities, credit spreads, and other cyclically-driven relationships tend to produce less trustworthy signals.
Flipping the method to identify bullish reversals is similarly limited, since most double cycles form on the way up rather than the way down. In any event, 150 years of equity market data show that bearish DCMR signals have consistently served as reliable warnings of trouble ahead.
Technical analysis calls for a weight-of-the-evidence approach, and that means a bearish DCMR reading by itself isn't sufficient to confirm a bear market. In my view, it would take a clear, decisive break below both the S&P's long-term uptrend line (Chart 3) and its 12-month moving average, currently near the 7,200 level, to meaningfully strengthen that case.
Good luck and good charting,
Martin J. Pring
The views expressed in this article are those of the author and do not necessarily reflect the position or opinion of Pring Turner Capital Group of Walnut Creek or its affiliates. The Six Stages of the Business Cycle are followed each month in Martin Pring’s Intermarket Review.