How Stop Loss Rules Should Change in Different Market Phases

“What are your stop loss and sell rules when you are in a consolidation phase, versus when you are in an uptrend phase or trend?”
When I was faced with this viewer question recently on my daily market recap show, my mind immediately generated an image of the chart of Palantir (PLTR). With a clear sideways trend after breaking below its 200-day moving average, I would argue that risk management can be a fairly straightforward exercise!
Before breaking down Palantir's chart, let’s first review my go-to approach for managing risk within a strong uptrend phase, using one of the leading growth stocks in May 2026.
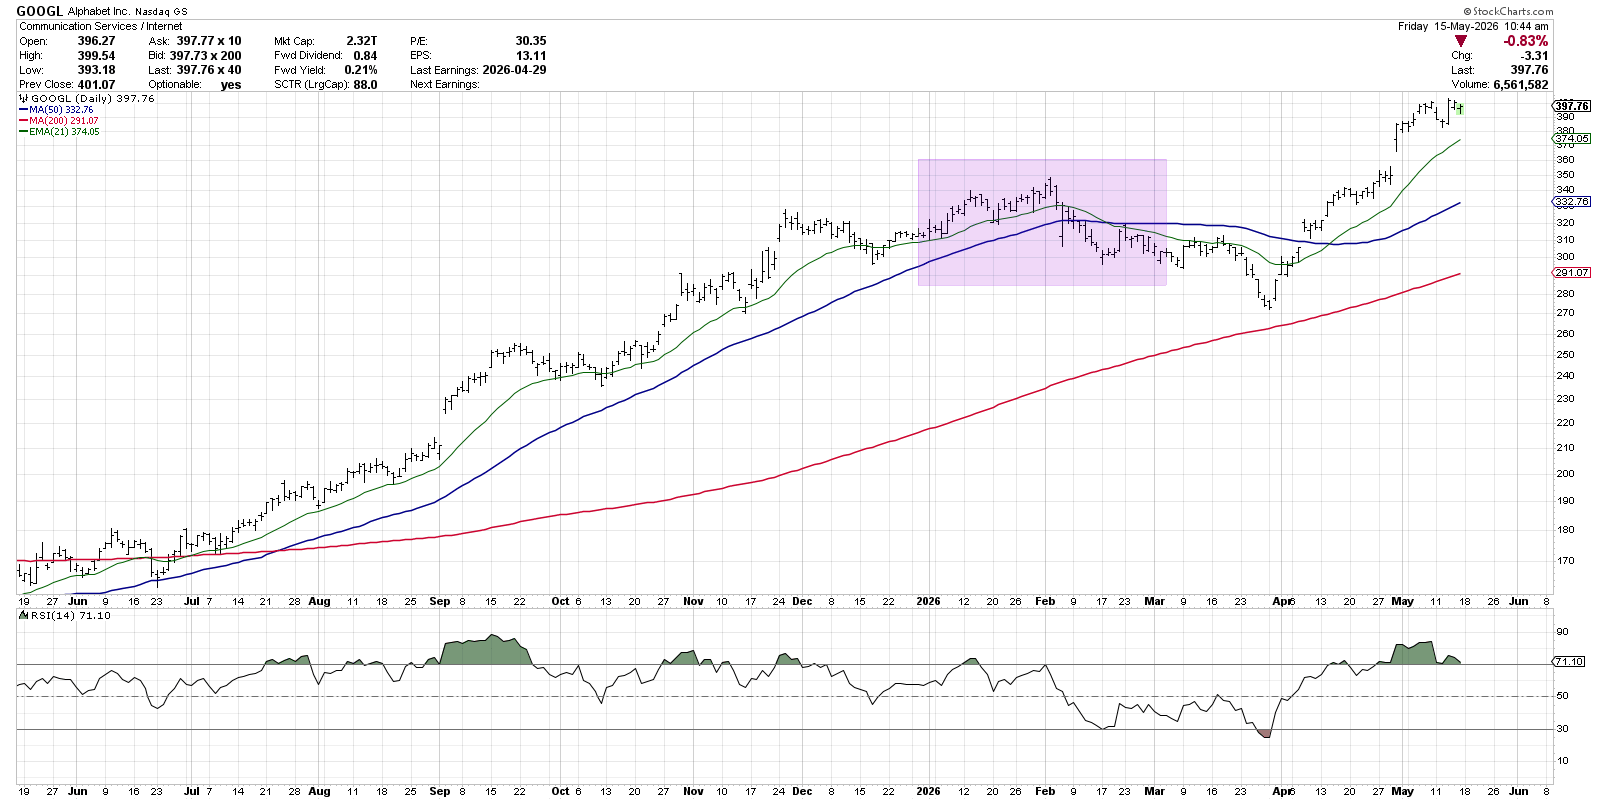
On the left half of the chart, you can see that GOOGL was in a strong uptrend phase marked by higher highs and higher lows. There were several short-term pullbacks on the way up, usually stopping at or around the 21-day exponential moving average. This setup, with the price making new highs above upward-sloping moving averages, represents a classic accumulation phase.
In the purple-shaded area, we can observe an “early warning” sign for Alphabet, where the price keeps making higher highs, but those highs are not confirmed by the Relative Strength Index (RSI). This bearish momentum divergence was soon followed by a break below the 21-day EMA, and then by a break of the 50-day moving average as the RSI pushed below 40.
Most investors obsess over when to buy, but the real challenge is knowing when to sell. In our upcoming FREE webcast on May 27th, I’ll walk through some of my favorite approaches for stops and risk management, including simple percentage stops, ATR levels, moving averages, and support-based exits.
We’ll use plenty of real chart examples and focus on how mindful investors can protect capital without getting shaken out of good trends too early. You can register for this FREE webcast at https://marketmisbehavior.com/exit. See you there!
So the break of the 21-day EMA often serves as an initial stop in my process, telling me that we’re experiencing at least some sort of pullback situation. If the price continues below the 50-day moving average, and if momentum continues to deteriorate, I may consider taking additional action to lighten a position.
That general approach works well for stocks in a strong uptrend, and you better believe I have this concept in mind as I’m observing high-flying tech stocks driving onward and ever upward! But what about a stock that's not in a primary uptrend? In that case, my stop approach needs to be adjusted.
The chart of Palantir looks remarkably different from the strongest AI-related plays in Q2 2026. After breaking below its 200-day moving average in January, PLTR has settled into a trading range between support just above $125 and resistance around $160.
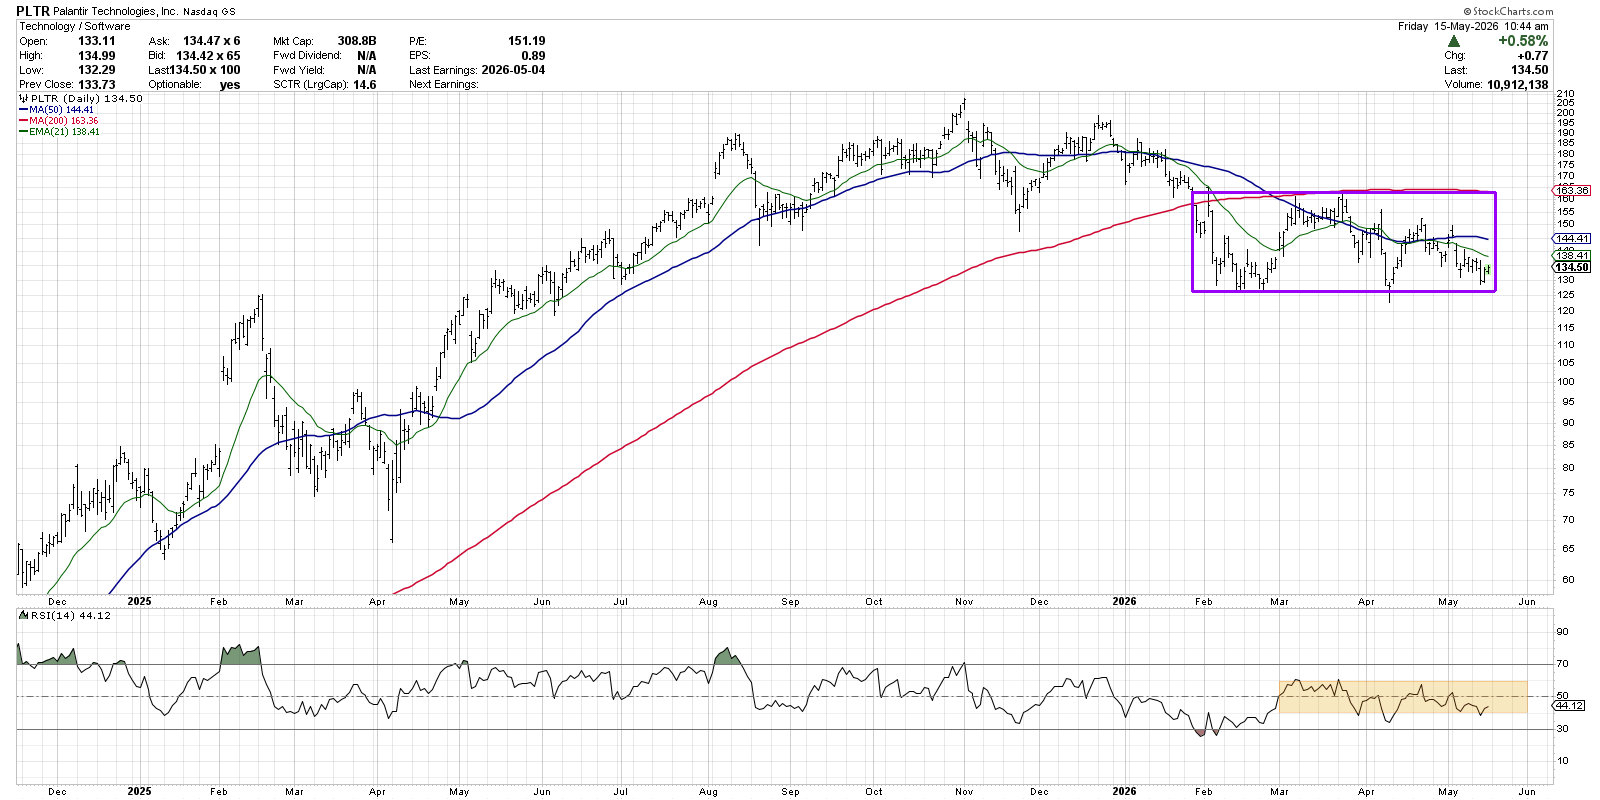
We can confirm this consolidation phase not just from the sideways price action but also with the RSI, which is ranging between 40 and 60. When the chart is heading sideways, and momentum simply revolves around the neutral level of 50, the chart is telling you to be patient!
If I do take a shot at a swing trade for a chart like PLTR, I simply use the rectangular consolidation range to define my approach. On the long side, any break below $125 marked by an RSI below 40 would indicate a bearish resolution to the pattern and a likely new distribution phase for the stock.
If I’m playing the short side, which I honestly very rarely do, I would use the previous swing highs as a stop. Any move above $163 would not only resolve this pattern to the upside, but it would also represent a decisive break above the 200-day moving average. That sort of breakout would suggest a new accumulation phase and tell me to strongly consider exiting any short positions.
It’s so important to have stop loss rules in your process, something I reinforce often with my Market Misbehavior premium members. But if you only have one rule for all charts, then sometimes you’ll be faced with a pattern like Palantir, where your exit strategy no longer fits the chart. Mindful investors know that they need to first define the trend, and only then can they define their approach.
By the way, we addressed this question in our Friday mailbag episode of our daily market recap show. You can find the latest episode on our YouTube channel!
RR#6,
Dave
P.S. Ready to upgrade your investment process? Check out my free behavioral investing course!
David Keller, CMT
President and Chief Strategist
Sierra Alpha Research LLC
marketmisbehavior.com
https://www.youtube.com/c/MarketMisbehavior
Disclaimer: This blog is for educational purposes only and should not be construed as financial advice. The ideas and strategies should never be used without first assessing your own personal and financial situation, or without consulting a financial professional.
The author does not have a position in mentioned securities at the time of publication. Any opinions expressed herein are solely those of the author and do not in any way represent the views or opinions of any other person or entity.