The Stock Market Just Broke Support. Here’s What Traders Should Watch Next

Key Takeaways
- The major stock market indexes broke below support levels, putting next downside targets firmly in focus.
- Technology stocks, especially semiconductors, led the selloff.
- Thursday's PCE data and Mag 7 earnings could set the market's next direction, making the response at the next support level especially important.
Has the stock market finally decided which direction it wants to go?
Fed days have a way of catching investors off guard, and Wednesday’s trading session delivered more than its share of uncertainty. Oil prices are rising, the conflict between the U.S. and Iran has escalated, and several Magnificent Seven companies are reporting earnings. Investors weren’t expecting the Fed to change interest rates; what they wanted to know was what the committee is likely to do at their next meeting.
Ahead of the Fed announcement, equities sold off until about 12:30 PM ET, then started rising. Gold prices also began moving higher, while the U.S. dollar pulled back. That lifted currency pairs such as the Euro/US dollar ($EURUSD), pound/yen ($GBPJPY), and pound/US dollar ($GBPUSD).
This price action appeared to signal that the equity market would rally after the Fed meeting, which it did... initially. At one point, the S&P 500 ($SPX) and Nasdaq Composite ($COMPQ) moved into positive territory.
But the rally didn’t last. Stocks reversed sharply, and all three major indexes closed lower.
- S&P 500: 7,316.15 (-1.52%)
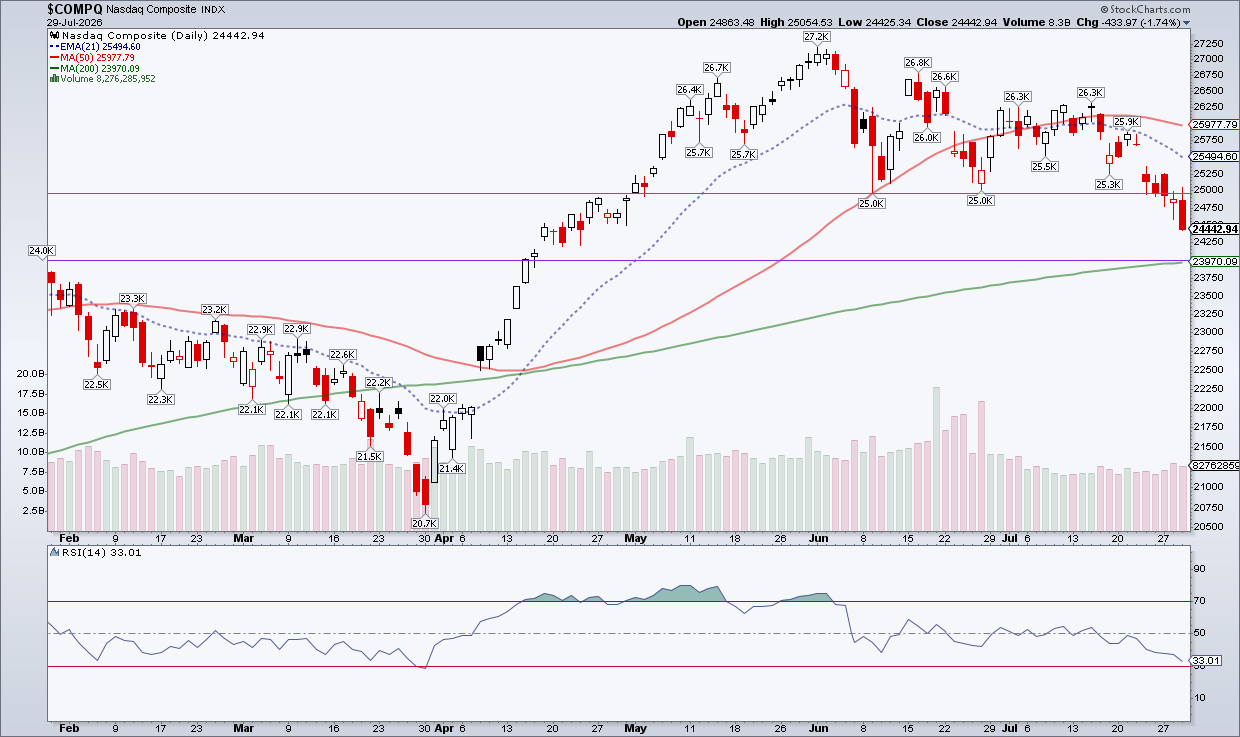
- Nasdaq Composite: 24,442.94 (-1.74%)
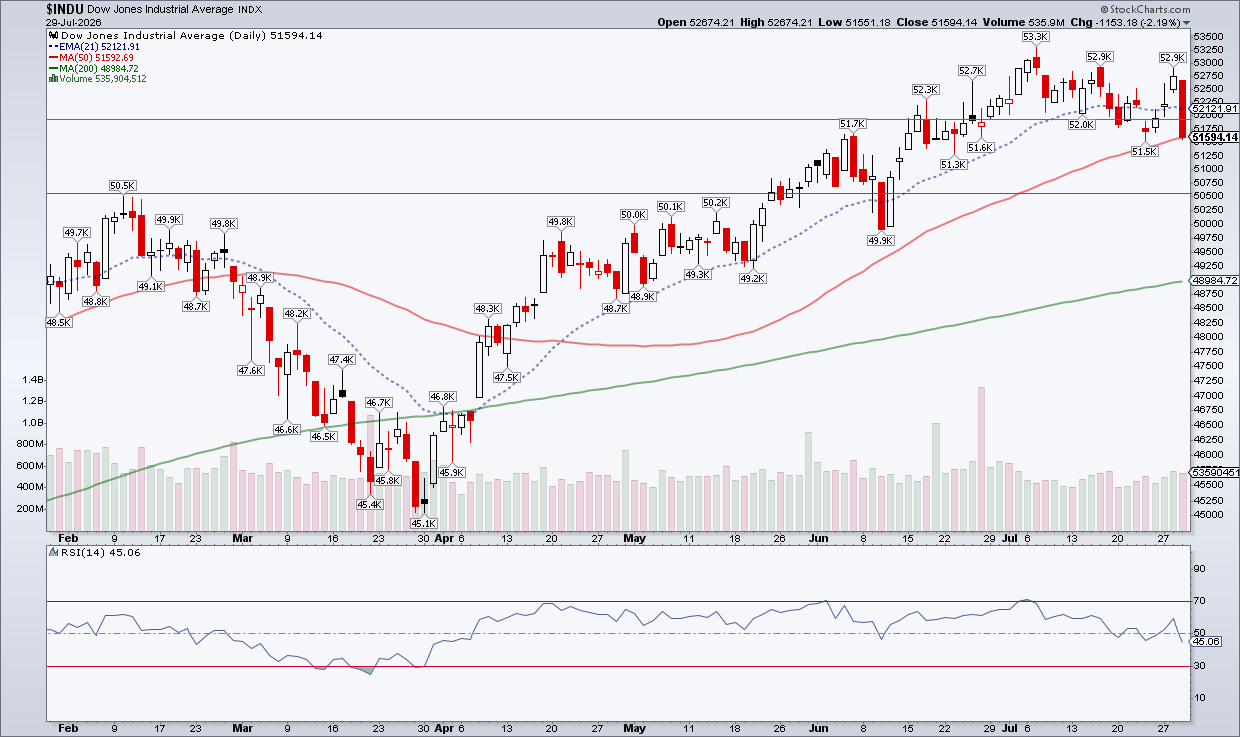
- Dow Industrials ($INDU): 51,594.14 (-2.19%)
All three are trading below the first key support level marked on my charts. Looking back at their weekly charts, the next important support level for the S&P 500 is 7,236. For the Nasdaq, it’s 24,000, which aligns with its 200-day simple moving average (SMA).
The Dow Industrials presented an interesting setup. Of the three, it was the only one that looked like it was going to trend higher and remain above its key support level (pink horizontal line). That changed on Wednesday, when the index broke below that level and fell to its 50-day SMA. The next downside level to watch is 50,560.
To put the magnitude of the selloff into perspective, I thought it would be helpful to focus on the Nasdaq Composite. The chart below applies the Nasdaq’s next key support level to its daily chart (purple horizontal line).
The tech selloff led the stock market lower, with semiconductors taking the brunt of the selling. The VanEck Semiconductor ETF (SMH) fell 4.79%.
Software stocks held up better. The iShares Expanded Tech-Software Sector ETF (IGV) gained 0.64%. Microsoft (MSFT) and Meta Platforms (META) reported earnings after Wednesday’s close. Meta traded lower while Microsoft moved higher. Whether software stocks can continue to move higher will be one of the key questions for Thursday, so keep a close eye on IGV.
It’s Not Just Equities
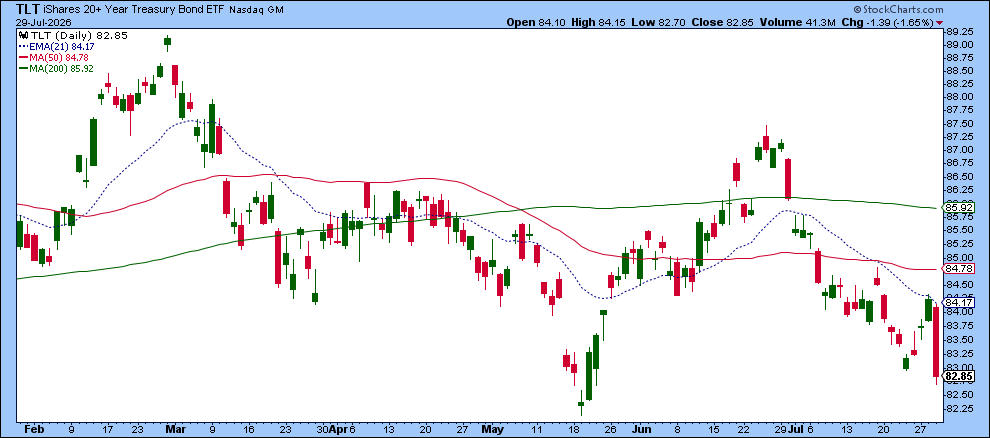
The selling wasn’t limited to stocks. Bonds sold off as well, with the iShares 20+ Treasury Bond ETF (TLT) falling 1.65% on Wednesday. It’s now approaching its May 19 low of 82.14.
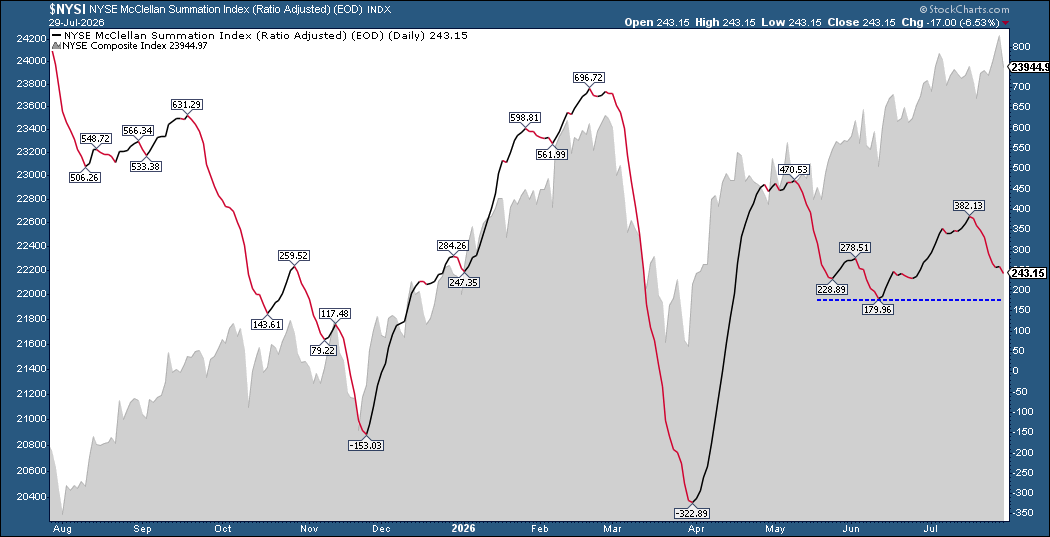
Overall, it isn’t looking favorable for the bulls. This prompted me to revisit my “Should I Be Trading” ChartList, which looks at New Highs - New Lows, NYSE Advancing/Declining issues, Percentage of stocks trading above moving averages, McClellan Summation Index ($NYSI), and volatility. Most of these charts are from the Market Summary ChartPack.
Interestingly, the market’s breadth indicators aren’t terribly concerning, at least not yet. The number of new highs slightly outnumbers new lows, except in the Nasdaq. More than 50% S&P 500 stocks remain above their 20-, 50-, and 200-day SMAs. In addition, the McClellan Summation Index hasn’t fallen back to its June low.
What concerns me more is the position of the major indexes relative to support levels. I’ll be closely watching the price action around these levels. How the indexes respond at these levels should provide clues about whether this is a pullback or a reversal.
The rise in volatility is another warning sign. The Cboe Volatility Index ($VIX) closed at 20.66 on Wednesday.
What’s Next?
Thursday morning brings the Personal Consumption Expenditures (PCE) data, one of the Fed’s preferred inflation measures. We’ll also get earnings from Alphabet (GOOGL) and Amazon (AMZN).
With the major indexes below short-term support levels and investors still digesting earnings, rising oil prices, and geopolitical conflicts, the stock market's uncertainty level is much higher than normal. Watch how prices behave at important support levels, and note if market breadth indicators confirm the move. This will tell you whether the stock market is going through a pullback or something more significant.
Don't miss the shifts everyone will notice tomorrow. The Market Summary page highlights the day's biggest movers, trends, and intermarket signals.
Disclaimer: This blog is for educational purposes only and should not be construed as financial advice. The ideas and strategies should never be used without first assessing your own personal and financial situation, or without consulting a financial professional.