These Two Markets are Starting to Look Sick

Key Takeaways
- The Russian Stock Market Index broke below a key support level in June, threatening to push $MOEX to a post-invasion low.
- The Shanghai Composite had an impressive breakout that is still holding up, but is struggling against resistance from an extended secular uptrend line.
- For both markets, decisive month-end closes below the respective secular support trendlines are worth watching for.
The Russian Stock Market Index Cracks its Secular Up Trendline
For the past few years, media coverage has suggested that the Russian economy is on the brink of collapse under the strain of the "Special Military Operation." Yet judging by the Russian Stock Market Index ($MOEX) and the ruble's exchange rate against the dollar—largely unchanged since mid-2023—little actually happened to disturb the market during the first three years of the conflict.
That began to shift in June, when the Index broke below a key support level marked by the dashed breakdown trendline.
Chart 1 currently shows a short-term momentum relief rally underway. But the more pressing question is the longer-term outlook: a drop below the June low would push the Index to a new post-invasion low.
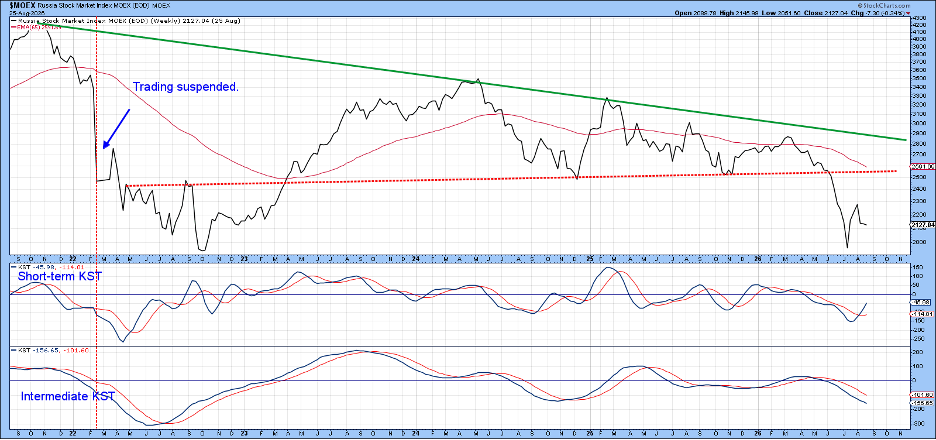
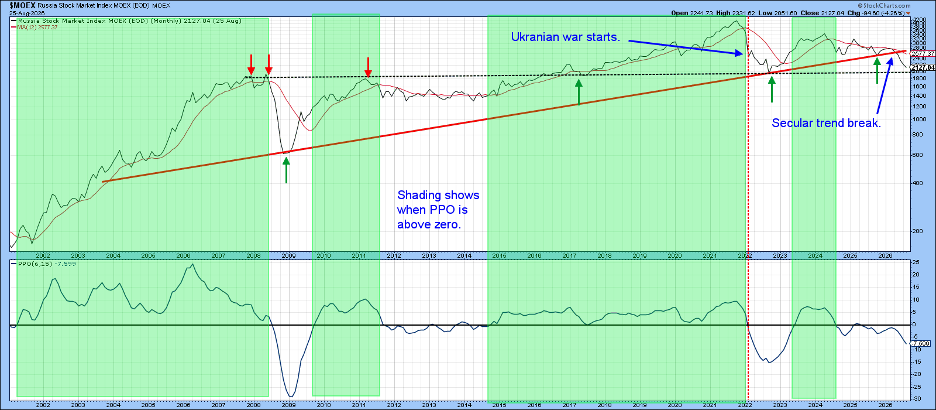
Chart 2 reveals just how precarious the situation has become: the secular uptrend line was violated at the same time the price broke below the red-dashed trendline shown in Chart 1. The shaded areas on the chart mark periods when the PPO, calculated using 6- and 15-month parameters, traded above its equilibrium zone, and it's clear these periods produced the bulk of the Index's gains. The unshaded periods, by contrast, were far more exposed to downside risk. Since mid-2024, the indicator has been essentially bearish, and the Index has spent most of this year trading below its 12-month moving average.
The critical test now lies just below the 2,000 level, which marks both the 2022 low and the low set earlier this summer. As Chart 2 shows, this is also roughly where the green dashed secular support trendline currently sits. A break below that level would effectively be the market's confirmation that Russia's economy is in serious trouble. It hasn’t happened yet, but certainly worth monitoring, since Russian investors have a better grip on things than the western financial press!
China Flashes Long-term Momentum Sell Signals
China has been one of the worst-performing markets since 2008, having made barely any progress over that span, as shown by the green secular resistance trendline in Chart 3. The 2025 breakout looked impressive at the time and is still holding up. However, the Index also ran into resistance at the red extended secular uptrend line, which proved too strong to overcome. The small green and red arrows highlight just how significant this line has historically been, having turned back numerous rallies and pullbacks alike. The question, then, is which signal to trust: the bullish message of the green line, or the warning implied by the violation of the secular uptrend line.
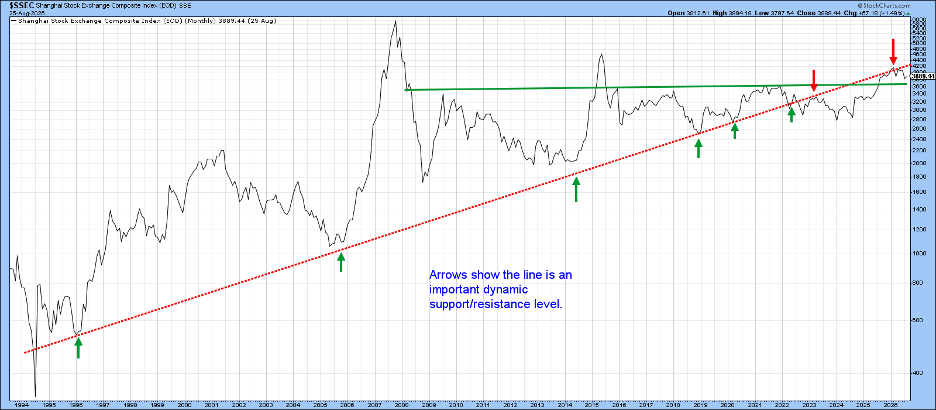
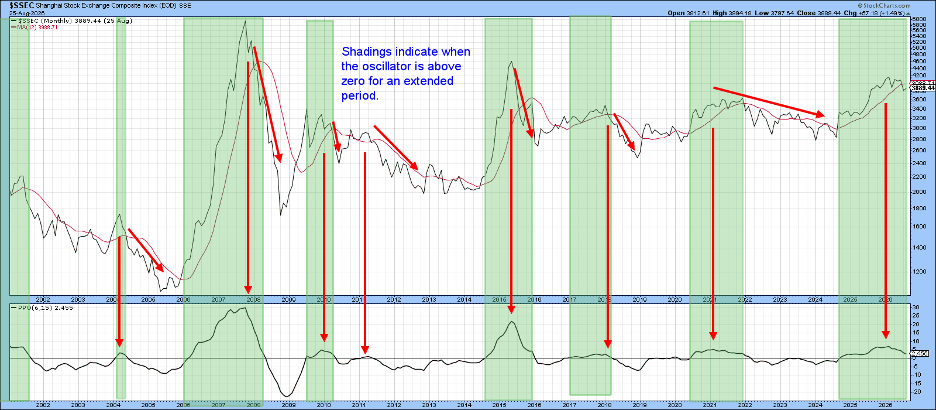
Chart 4, which compares the Shanghai Composite to its PPO, leaves little doubt about the direction of the primary trend. It also uses the 6- and 15-month EMA combination featured in Chart 2. The shaded areas approximate periods when the PPO is above zero. Right now, the picture is a tad clouded: the Index is decisively below its 12-month moving average, yet the oscillator, while declining, remains in positive territory. That said, the arrows tilt the balance toward the bearish side, as they mark seven previous PPO peaks, each of which was followed by a much larger decline than has occurred so far.
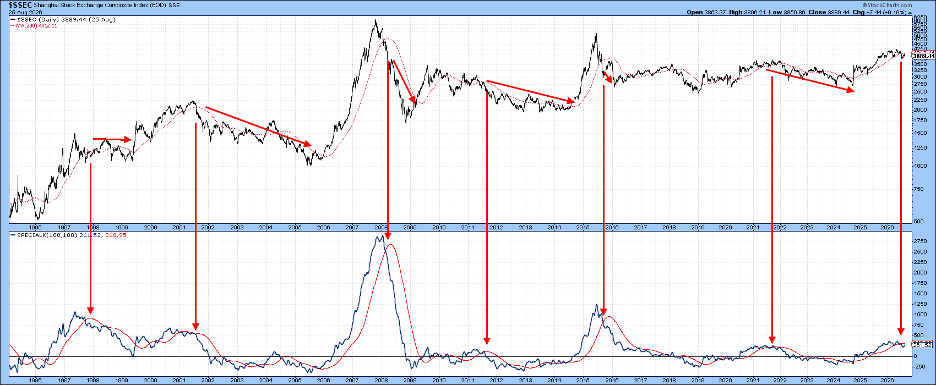
Finally, Chart 5 compares the Shanghai Composite to its Special K (SPK), which you can read about here. The red arrows mark instances when the SPK has crossed below its red signal line, as has recently occurred. The corresponding arrows against the price itself show that, in most prior cases, such crossovers have been followed by some form of multi-month correction.
Bottom Line
The Russian and Chinese markets have largely underperformed since the pandemic, and whether that trend continues remains an open question. What's notable, though, is that both markets have now experienced secular uptrend line violations, followed by primary trend sell signals, suggesting that Russian and Chinese investors themselves are uneasy about what lies ahead. The two areas to monitor are decisive month-end closes below the respective secular support trendlines, at 2,000 for the $MOEX and 3,000 for the $SSEC.
Good luck and good charting,
Martin J. Pring
The views expressed in this article are those of the author and do not necessarily reflect the position or opinion of Pring Turner Capital Group of Walnut Creek or its affiliates. The Six Stages of the Business Cycle are followed each month in Martin Pring’s Intermarket Review.