Growth vs. Value Just Flashed a Major Warning Signal

Key Takeaways
- Tech’s July slump has fueled a sharp rotation into value stocks, with some growth/value ratio charts trending lower.
- Technical signals favor value stocks for now, though one critical support level on IWF could determine whether growth stocks regain leadership.
- Despite steep declines across global tech stocks, the S&P 500 remains resilient thanks to sector and style rotation.
July has been a tech wreck so far, but the month isn't over yet, with major Mag 7 earnings reports on tap and a digestion of this week’s Fed rate decision. (July PCE inflation also looms.) Barring an impressive back half of the week, though, the Technology Select Sector SPDR ETF (XLK) will put in its worst monthly performance since September 2022, before the bull market began.
The correction comes during what's typically a favorable calendar stretch, too. XLK had been positive in 15 of the past 16 Julys, with 2024’s 3.3% dip being the lone blemish over that stretch. Price action didn’t bode well leading into Microsoft (MSFT) and Meta (META) earnings Wednesday night, along with Apple (AAPL) and Amazon (AMZN) results Thursday after the bell. XLK settled at its lowest mark since May 7 on Tuesday, falling 15% from its June 3 intraday peak.
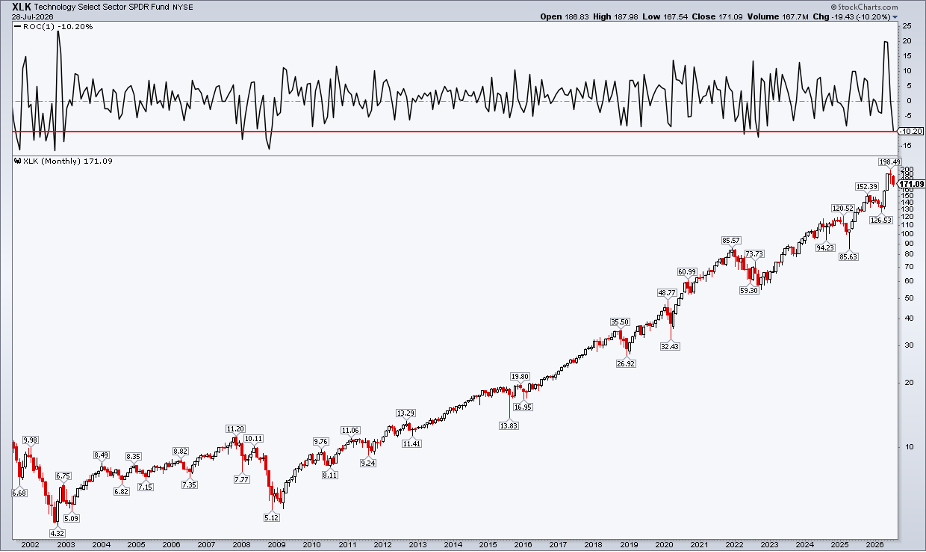
Tech’s summer reckoning (sans Apple) has far-reaching implications. Country ETFs like South Korea (EWY) and Taiwan (EWT) have been battered, retail favorites like the Roundhill Memory ETF (DRAM) have outright crashed, while the Philadelphia Semiconductor Index ($SOX) may print its largest monthly loss going back to 2001. Some assert that the SpaceX (SPCX) IPO was the ultimate “TMT” top-tick as well. SPCX was halved in about six weeks.
Value Takes the Wheel
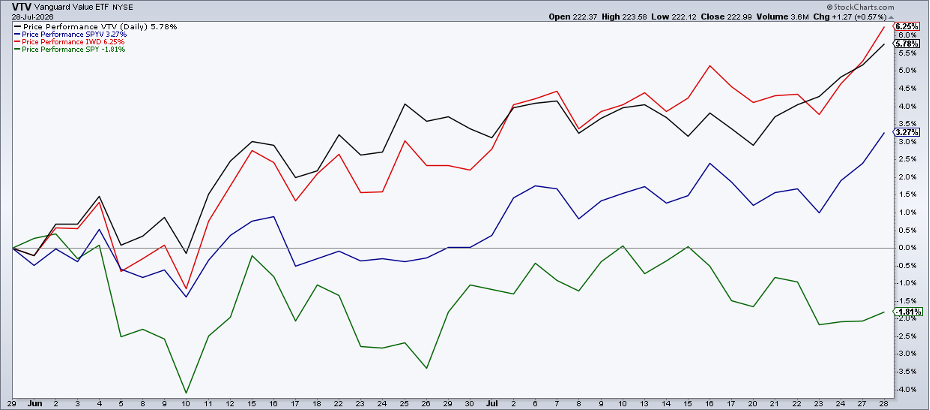
There are also style impacts within the market. Throw a dart at a "growth" fund, and you’ll come across second-half red. "Value" ETFs, however, chug along, with many reaching record highs seemingly by the day. Since the start of June, the iShares Russell 1000 Value ETF (IWD) has gained 6.3%, the Vanguard Value ETF (VTV) has returned 5.8%, and the SPDR S&P 500 Value ETF (SPYV) is up 3.3%. The S&P 500 ETF (SPY) is down 1.8% on a total return basis.
The "growth" counterpart ETFs (IWF, VUG, SPYG) are down 8.8%, 6.9%, and 5.9%, respectively. As mega caps stumble, one chart suggests more value alpha may be on the way.
The Ratio Flashing a Growth Warning
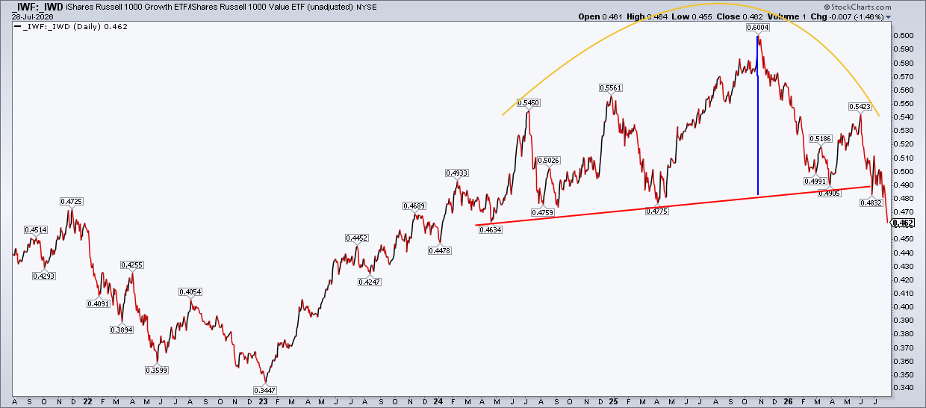
I first saw the ratio chart below posted by Grant Hawkridge, and it’s applicable to swing traders and active investors alike.
IWF:IWD (U.S. growth stocks compared to U.S. value stocks) fell to fresh lows going back to January 2024 ahead of four of the Mag 7 earnings reports this week. Notice in the chart that a bearish head-and-shoulders formation suggests more downside is on the way. Ratio charts can be a bit trickier when determining measured-move price objectives, so I wouldn't fall in love with the 0.38x ratio target. But the broader message (at least according to this growth vs. value stocks look) is that "real economy" stocks may hold up better as markets progress into an often-treacherous calendar stretch.
Look for Confirmation
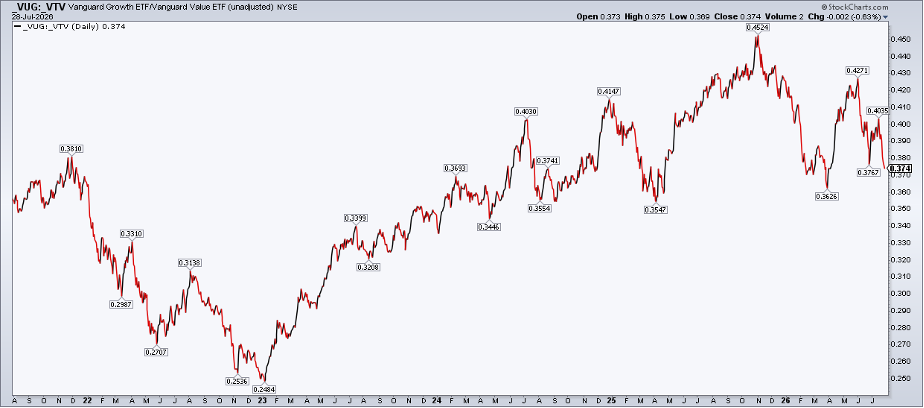
But IWF:IWD is just one version. Traders and technicians always seek confirmation of individual signals. Indeed, VUG:VTV and SPYG:SPYV are worth a glimpse. Vanguard’s version (shown below) is less definitive, with support in the 0.35 to 0.37 area, though a bearish rounded-top pattern is clearly seen.
Focusing on S&P 500 growth vs. value, SPYG still trends higher compared to SPYV.
Don’t Give Up on Growth Yet
The conclusion? I’m not willing to write off growth stocks just yet.
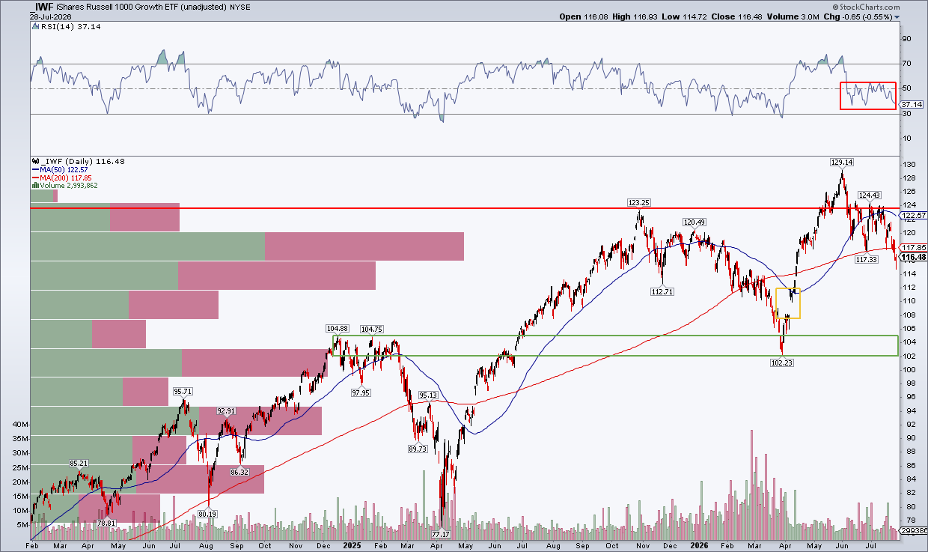
But what must happen for the former glamour stocks to regain their magic? Technically speaking, I see one major IWF price point that could determine the next style regime.
Shifting from ratio charts to traditional charts, a gap looms on IWF’s candlestick SharpChart. The April 8 thrust left an "open window" at $108, and assets often like to close the window. The iShares Russell 1000 Growth ETF fell below its long-term 200-day moving average this week, down for five consecutive sessions heading into Fed Day. That trend indicator line is also rolling over, possibly turning negative in the weeks ahead. A falling 200-DMA generally means the bears control the primary trend.
Also look at the RSI momentum oscillator at the top of the chart. It ranges in a weak zone from 35 to 55. Momentum’s giveback follows what now looks like a bearish false breakout at the early-June zenith. It wouldn’t take much additional volatility for IWF to fill the gap, with $102–$105 (the March low and range highs from late 2024 into early 2025) being the next support.
Value's Chart Is Boring... in a Good Way
As for a technical view of value ETFs... well, they are going straight up. That's the Reader’s Digest version. Perhaps I will analyze those later in Q3 once we get additional tells on IWD’s path toward year-end.
Strength Beneath the Surface
Big picture, the S&P 500 (and the global stock market) has been remarkably resilient in the face of crashes in the likes of Micron (MU), SanDisk (SNDK), and South Korea. Had you told me that MU would plunge 34% from its high, SNDK would lose 32% in three days, and EWY would drop by one-third, I would have assumed the S&P 500 would be more than 2.3% below its record high.
They say sector rotation is a bull market’s lifeblood, and that has been the summer zeitgeist. The same goes for style rotation.
The Bottom Line
Growth vs. value has completely rolled over, at least according to the IWF:IWD ratio chart. Still, other style gauges, such as VUG:VTV and SPYG:SPYV, are not yet outright sell signals. We have one key downside level to watch on IWF that may ultimately help growth reassert itself. Even with lots of kicking under the surface, the S&P 500 is keeping its head above water, not far from record levels.
Disclaimer: This blog is for educational purposes only and should not be construed as financial advice. The ideas and strategies should never be used without first assessing your own personal and financial situation, or without consulting a financial professional.