Three Breadth Indicators That Could Decide the Next Market Move

While the S&P 500 ($SPX) has been languishing in a consolidation phase, long-term market breadth indicators have remained quite constructive. Is this the sign of a healthy bull market phase, despite the lack of uptrend in the major averages?
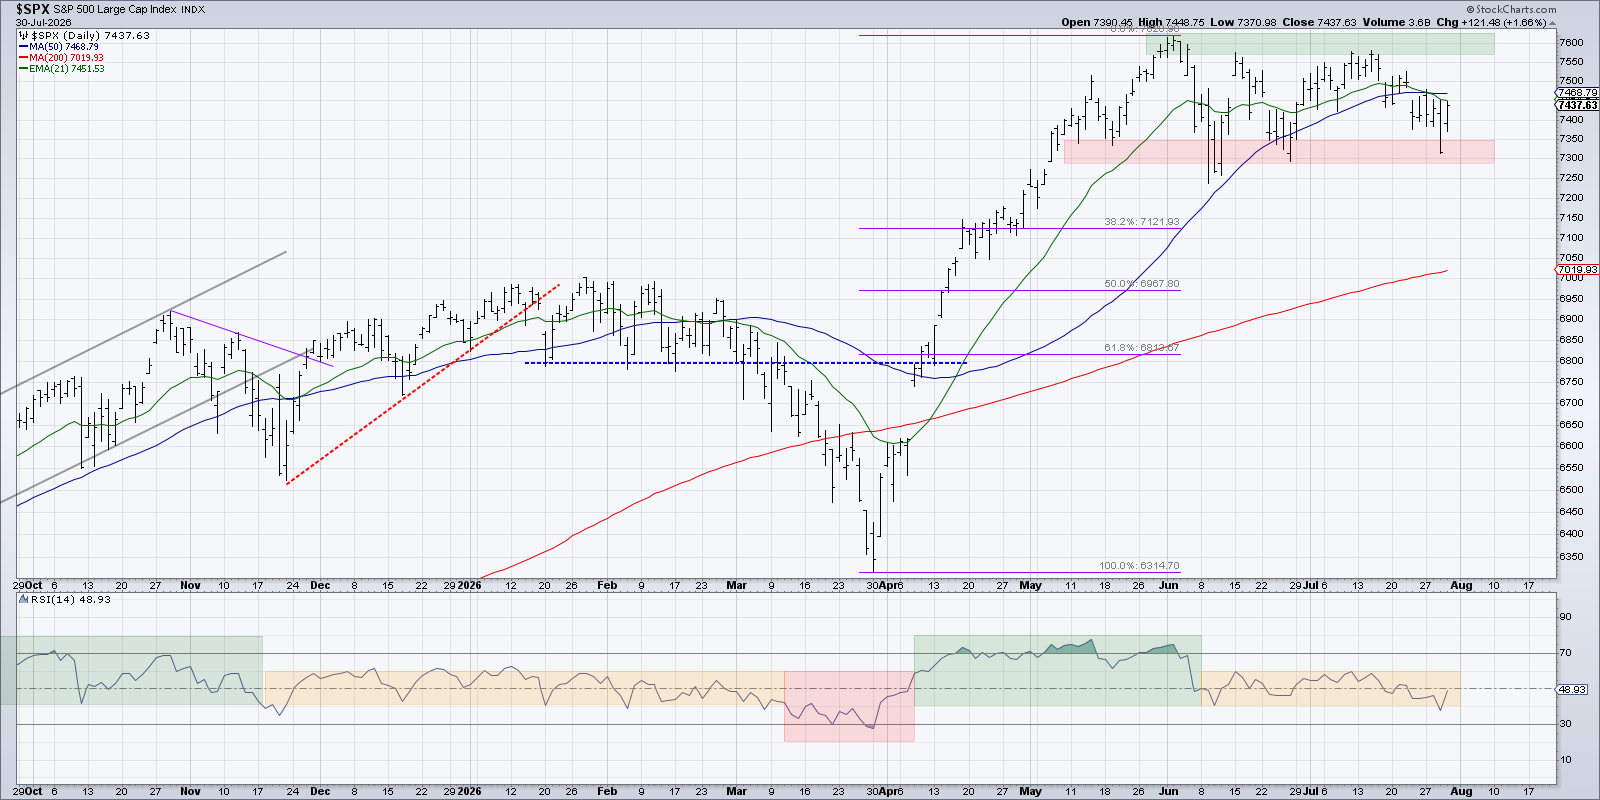
As the S&P 500 once again tests our “line in the sand” around 7300, it’s worth noting that most S&P 500 members remain in a primary uptrend based on their moving average readings. Until we see real improvement in some of the weaker breadth conditions here, though, we’ll remain skeptical that the major averages can experience meaningful upside.
Moving Average Breadth Confirms Primary Uptrend
We are indeed in unusual times, wherein the cumulative advance-decline lines are making new all-time highs and about 70% of S&P 500 members are above their 50-day moving averages, yet the major averages “just feel toppy” according to my anecdotal conversations with market practitioners.
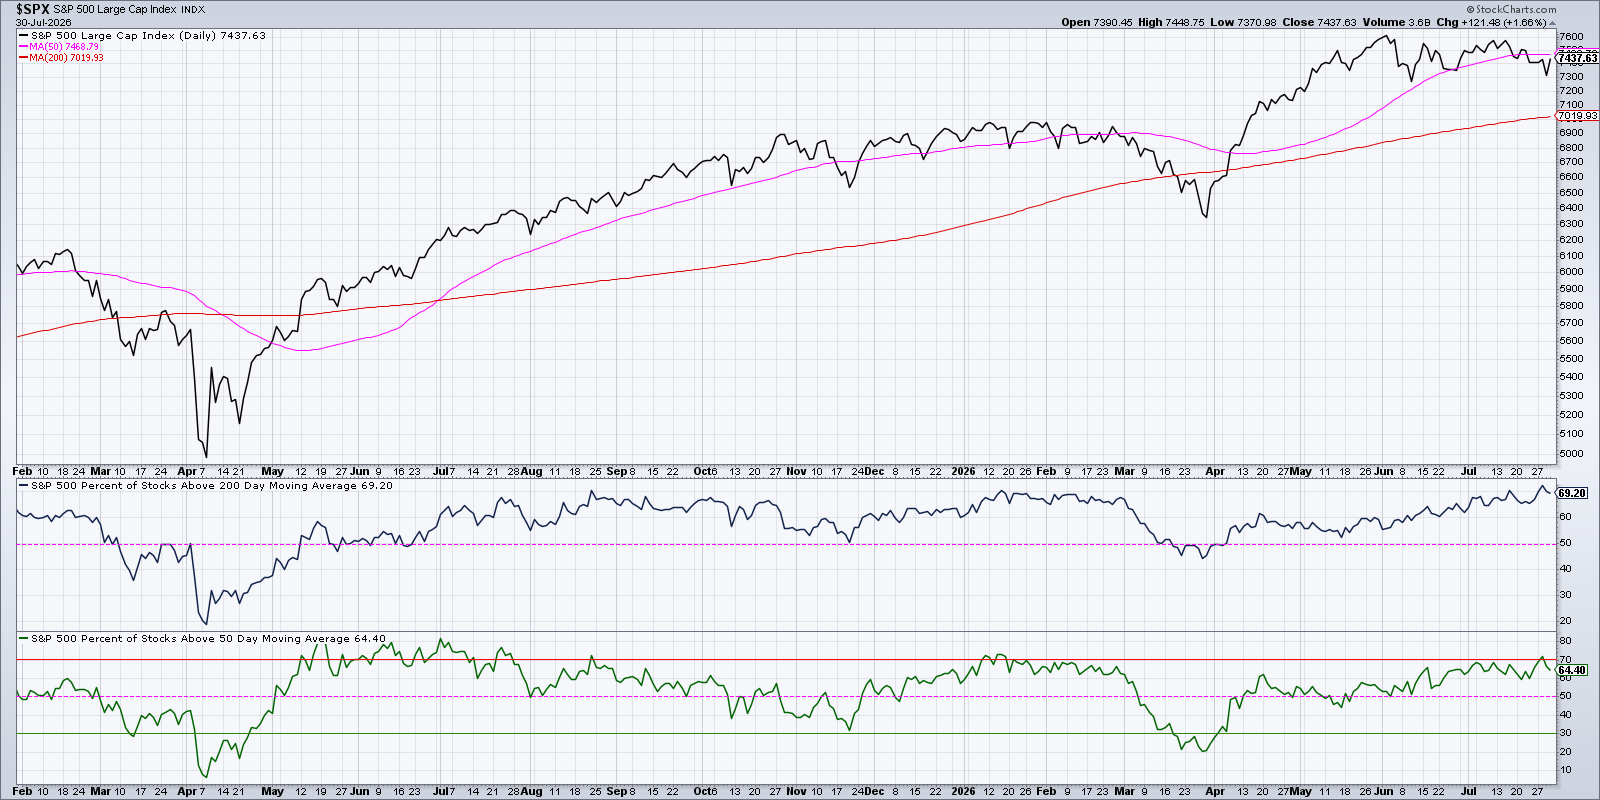
As of Thursday’s close, we’re down to about 64% of S&P 500 stocks above their 50-day moving averages. This indicator reached 70% earlier this week for the first time since January. Along with similar strength in the percentage of stocks above their 200-day moving average, this suggests a broad advance driven by plenty of uptrends. So the sideways action in the S&P 500 appears to be more about recent weakness in big tech as opposed to broad weakness in equities.
Three Breadth Indicators Painting More Cautionary Picture
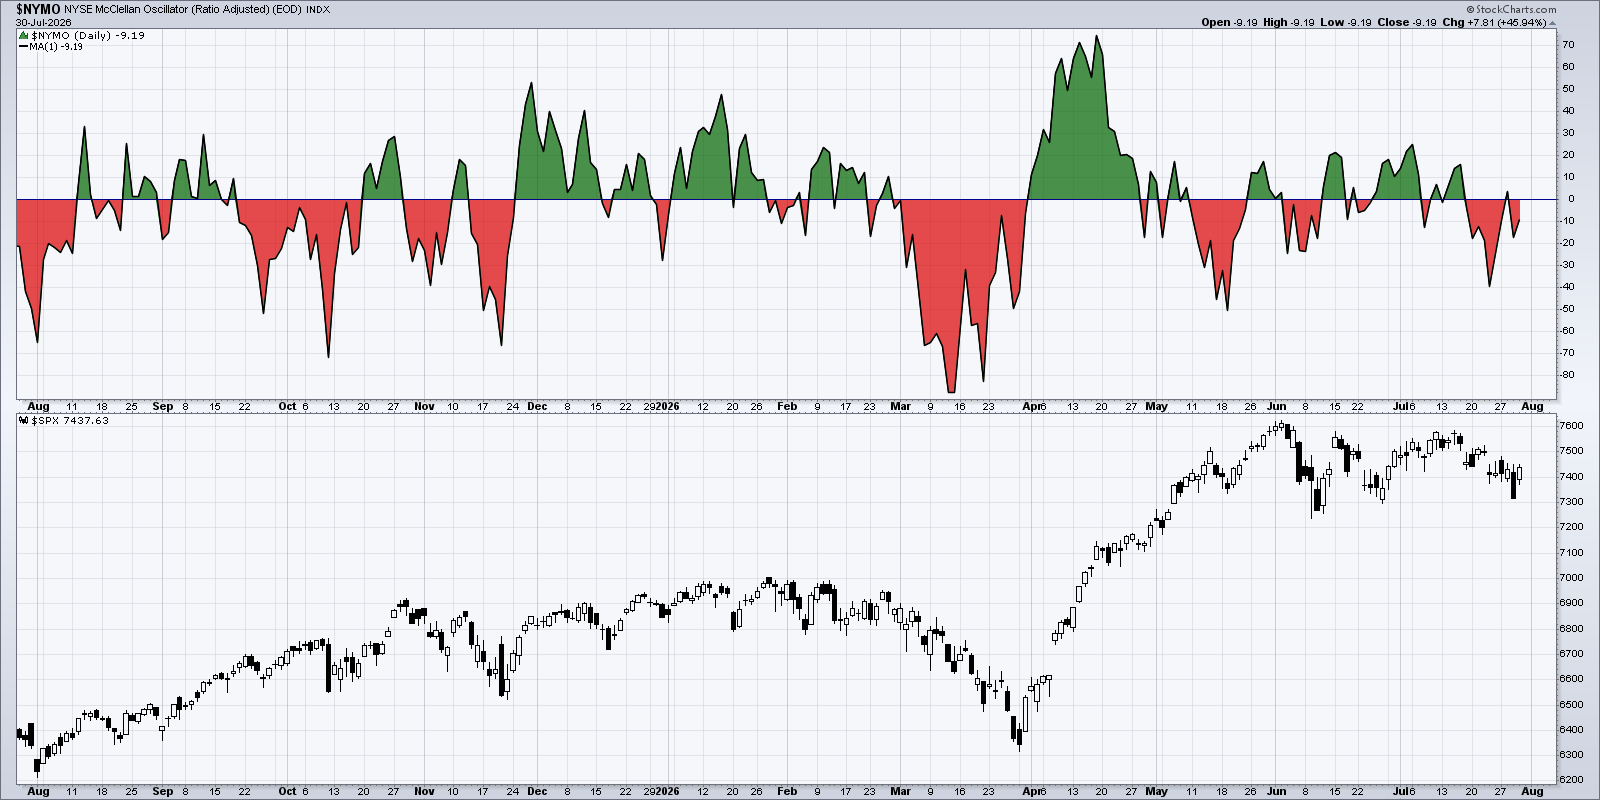
The McClellan Oscillator, a short-term breadth indicator derived from the advance-decline lines, has been below the zero level for the last couple weeks. So while the advance-decline lines achieved new all-time highs in July, the negative McClellan Oscillator means that the pace of that advance has slowed down.
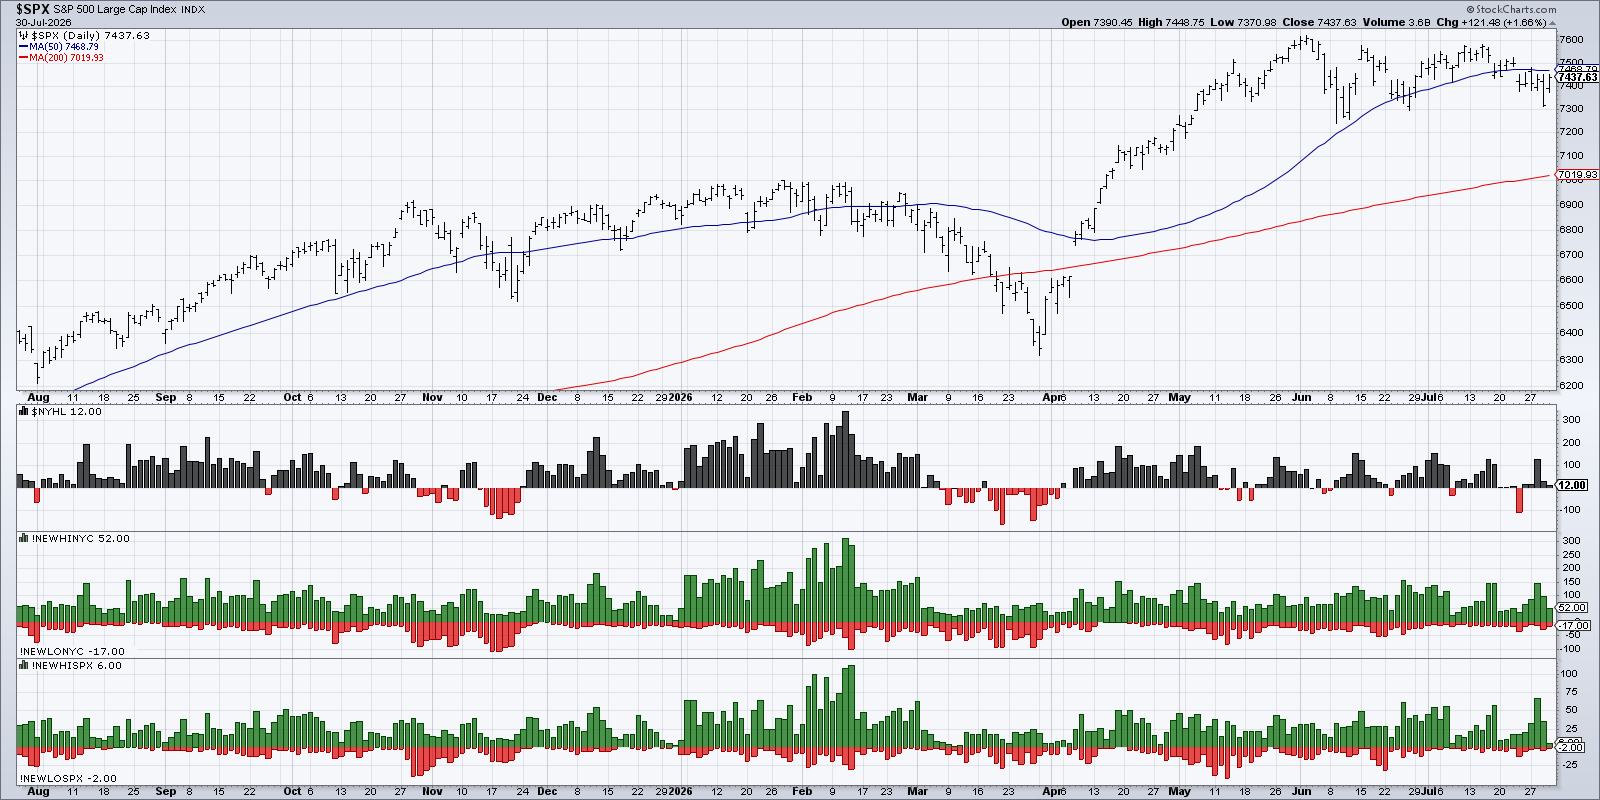
Healthy bull markets are marked by an expansion in new 52-week highs. Even if the S&P 500 and Nasdaq are not making new highs, early leadership names need to be paving the way higher. We’ve been noting a fairly low number of new 52-week highs over the last week, although this did spike up on Tuesday, with around 13.5% of the S&P 500 achieving this standard breakout.
One short-term breadth indicator pushed so low that it actually generated a contrarian bullish signal! The Nasdaq 100 Bullish Percent Index, a market breadth indicator based on point & figure charts, dropped all the way to 30% last Friday.
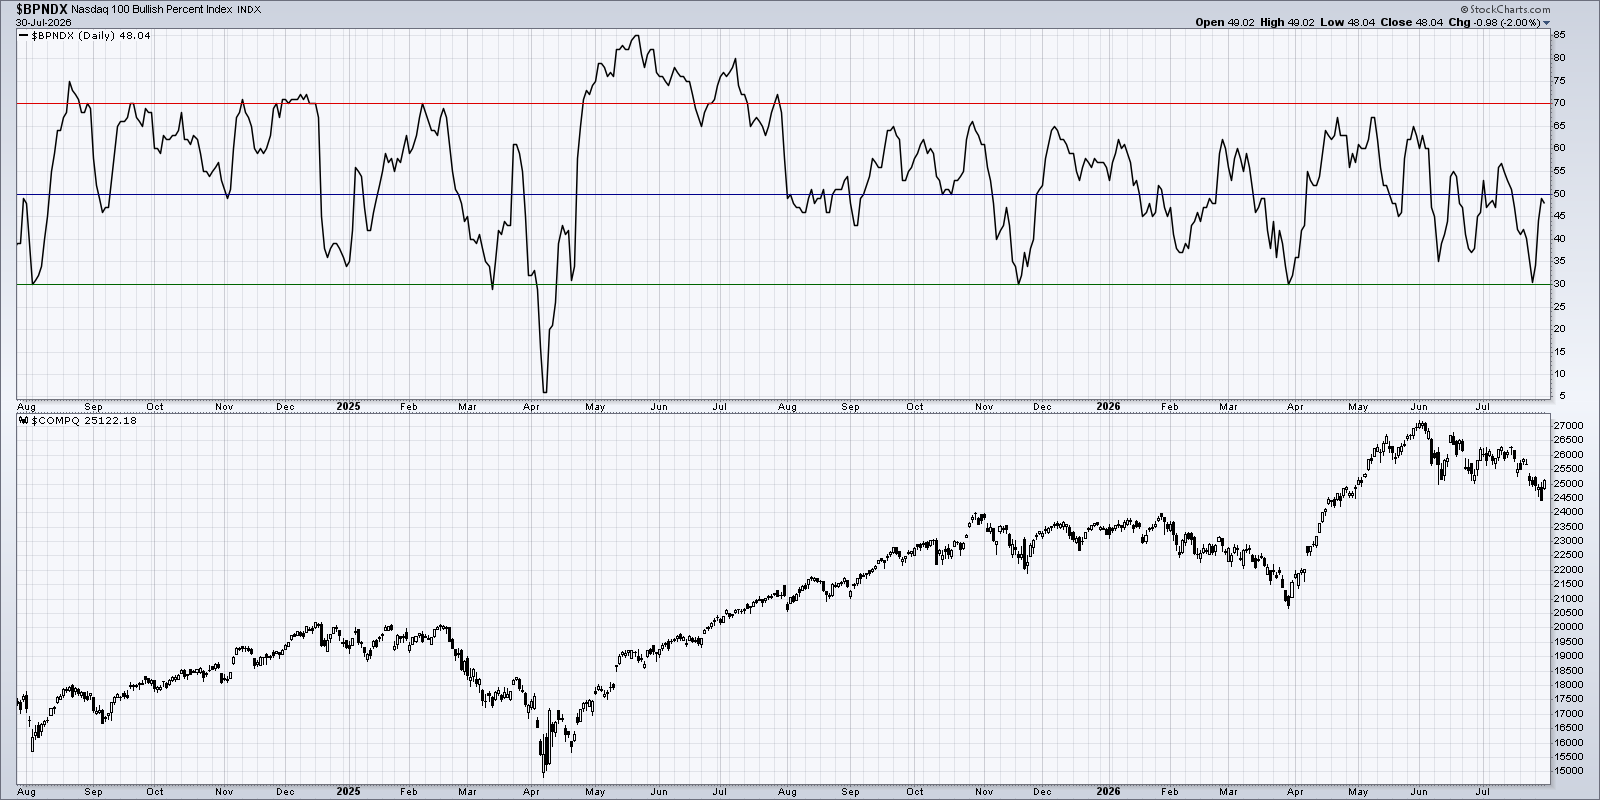
Looking back at the chart, we can see that when the Bullish Percent Index reaches 30%, there is often a decent bounce higher from the Nasdaq Composite Index soon after. Of course, this indicator can drop below 30%, as we witnessed back in April 2025. But a move back above the 30% level is the real signal we’re looking for to confirm a resurgence in the large-cap growth stocks in the Nasdaq 100 index.
Breadth Improvement Could Provide Crucial Bullish Signal in Q3
What would we need to see to confirm more bullish market breadth conditions into August? Firstly, the moving average breadth readings would have to remain above 50% to show that most stocks are holding key trend support. Secondly, the McClellan Oscillator popping back above zero would imply that the advance-decline lines are continuing their uptrend. In addition, we would need to see an expansion in new 52-week highs, indicating that leadership names are breaking out.
Perhaps most importantly, continued upside in the Nasdaq 100 Bullish Percent Index would suggest that large-cap growth stocks are returning to a position of strength. While stronger breadth readings can imply great opportunities for stock pickers, our growth-dominated benchmarks would only be able to break out of their own ranges if large cap growth was back on offense.
RR#6,
Dave
P. S. Ready to upgrade your investment process? Check out my free behavioral investing course!
David Keller, CMT
President and Chief Strategist
Sierra Alpha Research LLC
marketmisbehavior.com
https://www.youtube.com/c/MarketMisbehavior
Disclaimer: This blog is for educational purposes only and should not be construed as financial advice. The ideas and strategies should never be used without first assessing your own personal and financial situation, or without consulting a financial professional.
The author does not have a position in mentioned securities at the time of publication. Any opinions expressed herein are solely those of the author and do not in any way represent the views or opinions of any other person or entity.