StockCharts Insider: The Screener That Thinks Like a Market Technician and Fundamental Analyst
Before We Dive In…
There are times when you want to find tradable securities based on a simple premise. You want stocks or ETFs in certain groups exhibiting a few key technical and fundamental characteristics. What you don’t want to do in this early stage is to craft a more elaborate scan, especially if it entails coding. Maybe that’ll come later (and there’s a way to do it by clicking a button), but, for now, you just want fast results. In short, you need a powerful screener.
Here’s the problem: Most screeners are based on fundamentals only. Some are based solely on technicals. The new StockCharts Screener gives you the best of both.
An Industry-Leading Screen Engine
If you’re like me, you want to look at both price action and economic drivers when looking for a stock.
For example, why focus on a stock with strong technicals, but poor earnings, revenue history, and forward guidance? Sure, there might be some potential there, but aren’t there better candidates? The same can be said for a stock that analysts are raving about for its fundamentals. If it’s in a technical dead zone, why bother until it can prove itself in price?
Again, this generally touches on my preferred framework when setting up a screen. You’ll have your own, and there are more than enough tools to work with to get a quick scan going.

Take a look at each criterion. Below, we'll briefly go over what they mean.
- Groups: These let you choose index, sector, industry, exchange, etc. Before you start looking for assets, make sure you’re in the right universe.
- Key Properties: Things like market cap, dividend growth, float, beta, institutional ownership, and more.
- Price/Performance: How has price been moving, where are its highs and lows among other price action factors, etc. Relatively basic technical criteria.
- Technicals: RSI, moving averages, and other indicators you already use. These include basic indicators most traders use before adding anything else for a more nuanced read.
- Chart Patterns: These include several classic and candlestick patterns.
- Fundamentals: Business economic factors validating price, such as P/E ratio, PEG ratio, Price-to-Book, Price-to-Sales, and plenty more.
Mix and match across these six categories and the Screener becomes like a laboratory for testing your ideas.
Fine-Tune Your Results in Real-Time
As you add or change criteria, you’ll see them shift in real-time alongside the matching results. This is important, as screens are rarely adequate on the first pass. Here, you get to add a filter, glance at the results, and decide where to tighten, loosen, or swap things out entirely. The Screener is built for that kind of back-and-forth.
Pause here and spend a few minutes running your own screen. Come back when you're ready for some Insider Tips.
Insider Tip #1: Don’t Overload the Screener
The Screener can handle a good number of filters. Pile on too many, though, and you're scanning instead of screening. It’s possible to overload the system to the point of getting generic results. This is something you’ll have to experiment with. The moment you sense the results degrading because you’ve got too many things going on, you stop and hit Convert to Scan instead. You'll get the full logic of the Advanced Scan Workbench, built for exactly that level of complexity, instead of asking a screener to do a scan engine's job.
Insider Tip #2: Consider Using Both Technicals and Fundamentals
Unless you want a purely technical or fundamental screening, try using both. Pair a momentum filter (RSI above 50, price above its 50-day) with a fundamentals filter (positive earnings growth, reasonable PEG) in the same screen. A stock that passes both tests is a stock the technicians and Wall Street analysts might agree on. That alignment is rarer than you'd think, because it doesn’t happen often in the mainstream financial world.
Insider Tip #3: With Infinite Combinations Comes the Need to Experiment
With six categories and 99 filters, the combination using all six already numbers past 1.12 billion. Realistically, most of us won’t use all six. We’ll mix and match. Even so, the combinations, depending on how you go about it, can range from millions to virtually infinite. This means you need to experiment. Looking for oversold blue chips about to bounce? There’s a screen for that. Small caps breaking out on high volume with improving margins? There’s one for that too. Looking for sector rotation or dividend plays with good technicals? Another one for those.
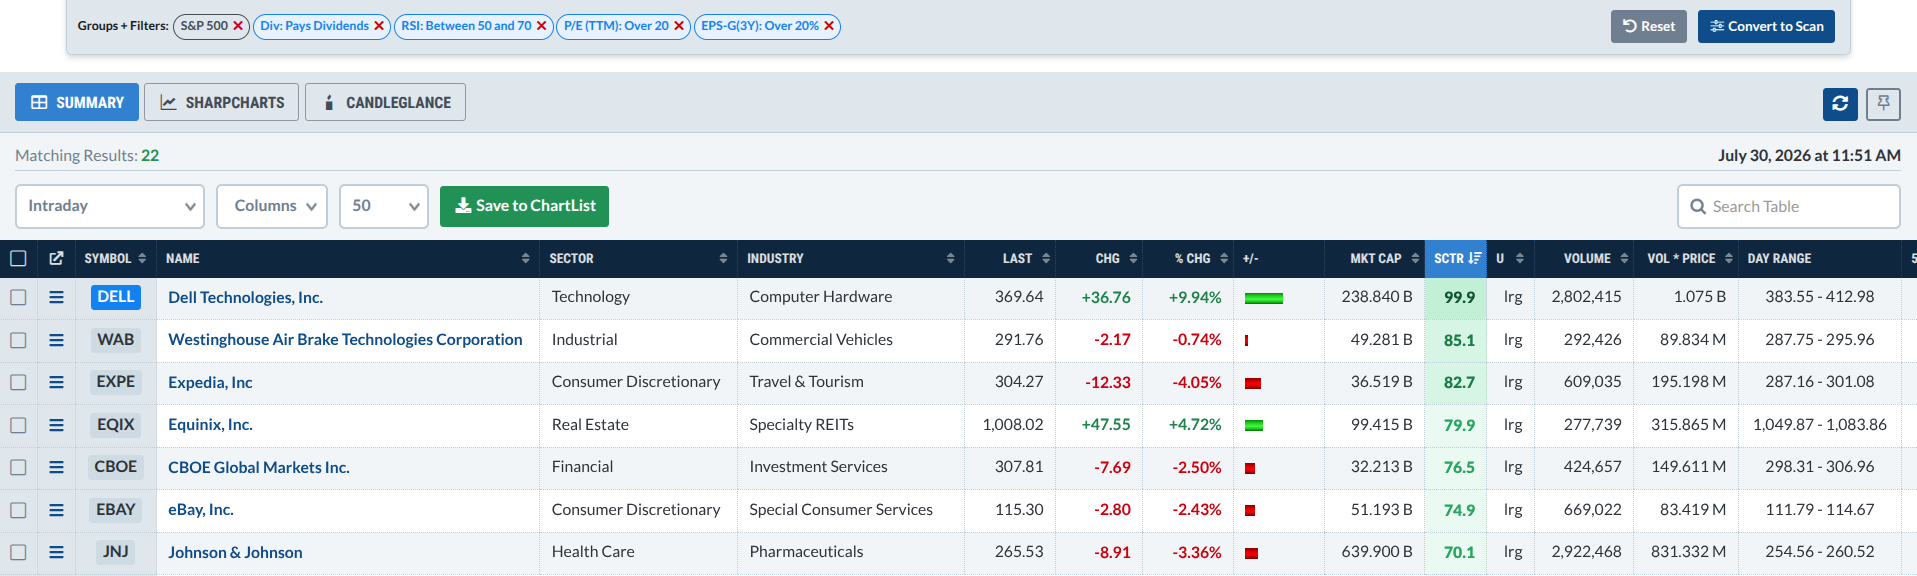
For example, here's a sample search for S&P 500 dividend-paying stocks, with an RSI in the bullish range, a P/E above 20, and EPS growth greater than 20% over the past three years.
The point is this: don’t box yourself into building the same screen every time. It doesn’t hurt to do frequent R&D. You’ll find that every new thesis entails a new combination with at least one variation.
And That's a Wrap
The StockCharts Screener is a way for you to test different market ideas and generate immediate results. It’s particularly helpful when market conditions shift. Trading sentiment, fundamental expectations, and technical conditions rarely move in sync, and the Screener lets you adjust your criteria to take advantage of these developments. Just remember to start simple and experiment with different filters. If your ideas outgrow the screener's capacity, simply convert it into a scan. Most importantly, though, you should make sure to spend some time with it.