MEMBERS ONLY
Top Ten Charts to Watch in August 2023
by David Keller,
President and Chief Strategist, Sierra Alpha Research
In this episode of StockCharts TV'sThe Final Bar, Dave shares the ten charts he'll be watching as we continue into the seasonally weakest part of the year. Will the mega-cap growth trade falter, putting downside pressure on the S&P 500 and Nasdaq?
StockCharts memberscan...
READ MORE
MEMBERS ONLY
Is The S&P 500 Forming a Huge Double Top? A Q&A with David Keller, CMT
by David Keller,
President and Chief Strategist, Sierra Alpha Research
In this episode of StockCharts TV'sThe Final Bar, David Keller hosts a special all-mailbag edition of The Final Bar featuring questions on trailing stop techniques, MACD histograms, uranium stocks, and a potential double top formation for the S&P 500 index.
This video was originally broadcast on...
READ MORE
MEMBERS ONLY
All That's Bullish is GLD as the Week Wraps
by David Keller,
President and Chief Strategist, Sierra Alpha Research
In this episode of StockCharts TV'sThe Final Bar, guest Jesse Felder of The Felder Report joins us in the studio to present the bullish case for gold based on price pattern analysis as well as a contrarian sentiment indicator. Dave wraps the week with a focus on bearish...
READ MORE
MEMBERS ONLY
A Painful Plummet for Netflix and Tesla; Is This Just the Beginning?
by David Keller,
President and Chief Strategist, Sierra Alpha Research
In this episode of StockCharts TV'sThe Final Bar, guest Danielle Shay of Simpler Trading breaks down today's Nasdaq bloodbath and focuses on potential support levels for TSLA, MSFT, TSM, and AMD. Host David Keller, CMT highlights one Health Care name showing a bullish momentum divergence.
This...
READ MORE
MEMBERS ONLY
Tired of Long Large-Cap Growth Stocks? Dave Shows His Top 2 Alternatives
by David Keller,
President and Chief Strategist, Sierra Alpha Research
In this episode of StockCharts TV'sThe Final Bar, guest Dana Lyons of J. Lyons Fund Management shares two ideas for investors looking to diversify away from the US large-cap growth space. Host David Keller, CMT highlights one key breadth indicator flashing a big time overbought signal as the...
READ MORE
MEMBERS ONLY
Another New High for the Year?
by David Keller,
President and Chief Strategist, Sierra Alpha Research
In this episode of StockCharts TV'sThe Final Bar, guest Nick Raich of The Earnings Scout focuses in on one sector that has a lot of earnings potential. Host David Keller, CMT explores more new highs in the S&P 500 and, with earnings season starting with force,...
READ MORE
MEMBERS ONLY
S&P 500 Pushing All-Time Highs? Strong Trends Getting Stronger
by David Keller,
President and Chief Strategist, Sierra Alpha Research
In this special episode of StockCharts TV'sThe Final Bar, Dave celebrates the S&P 500 making another new high for 2023 and focuses on two key growth stocks reporting earnings this week. He answers questions on linear vs. logarithmic-scale charts, upside for COIN and breakout potential for...
READ MORE
MEMBERS ONLY
How to Pick the Best Technical Indicator for You
by David Keller,
President and Chief Strategist, Sierra Alpha Research
In this special episode of StockCharts TV'sThe Final Bar, Dave answers questions from the mailbag on all things technical analysis and market strategy. He shares best practices on charting inflation rates, how the put/call ratio can be used for trend analysis, Elliott Wave corrective patterns, back testing...
READ MORE
MEMBERS ONLY
Absolutely Everything Goes Up
by David Keller,
President and Chief Strategist, Sierra Alpha Research
KEY TAKEAWAYS
* The ARK Innovation ETF has been a chronic underperformer in recent years, but 2023 has seen a dramatic turnaround.
* The top holdings of ARKK, especially TSLA, COIN, and ROKU, have been the source of key gains this year.
* Renewed strength from emerging technology is part of a broader...
READ MORE
MEMBERS ONLY
Top 3 Pitfalls YOU Probably Make When Trading
by David Keller,
President and Chief Strategist, Sierra Alpha Research
In this episode of StockCharts TV'sThe Final Bar, guest Dave Landry, MBA of DaveLandry.com gives us 3 of the most common behavioral pitfalls that traders make. Host David Keller, CMT explores what leadership themes we can uncover after the major moves in today's market and...
READ MORE
MEMBERS ONLY
One Chart SCREAMING Small-Caps Over Large-Caps
by David Keller,
President and Chief Strategist, Sierra Alpha Research
In this episode of StockCharts TV'sThe Final Bar, guest John Lewis of Dorsey Wright Money Management shares how his point & figure chart indicates upside potential for the Russell 2000 index. Host David Keller, CMT speaks to renewed strength in crude oil, energy stocks, NE, ROKU, and COIN....
READ MORE
MEMBERS ONLY
Industrials Ignite as Bitcoin Blasts Off
by David Keller,
President and Chief Strategist, Sierra Alpha Research
In this episode of StockCharts TV'sThe Final Bar, Dave highlights top performers in the industrial sector and tracks the renewed rally in Bitcoin after news of a $125K price target. He answers viewer questions on trailing stop indicators, exhaustion gaps, and support and resistance zones.
This video was...
READ MORE
MEMBERS ONLY
Three Key Charts Showing Bearish Divergences
by David Keller,
President and Chief Strategist, Sierra Alpha Research
KEY TAKEAWAYS
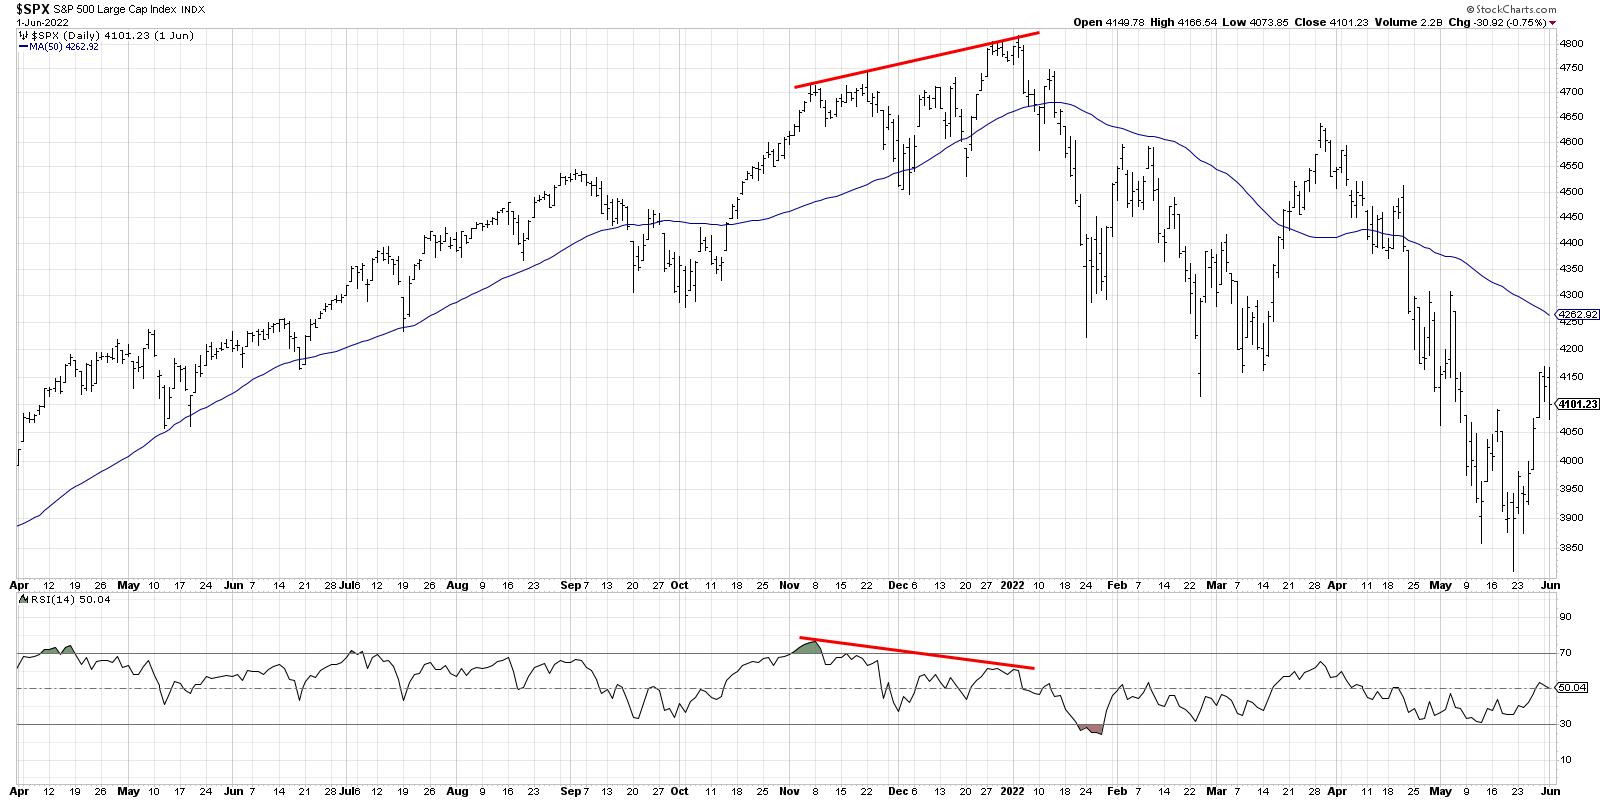
* Bearish momentum divergences suggest exhaustion for buyers after a long bullish phase.
* The 2021 market top was marked by a bearish momentum divergence for the S&P 500.
* Bearish divergences between price and RSI indicate potential downside for leading growth stocks, including AMZN and LRCX.
* The S&...
READ MORE
MEMBERS ONLY
Bearish Divergences Cause Market to Drop
by David Keller,
President and Chief Strategist, Sierra Alpha Research
In this episode of StockCharts TV'sThe Final Bar, Dave wraps the week with a focus on a growing number of bearish momentum divergences, including on the S&P 500 index itself! He answers viewer questions on trailing stops, taking profits on strong performers, and running technical indicators...
READ MORE
MEMBERS ONLY
Secular Trends Contrasted with Deterioration
by David Keller,
President and Chief Strategist, Sierra Alpha Research
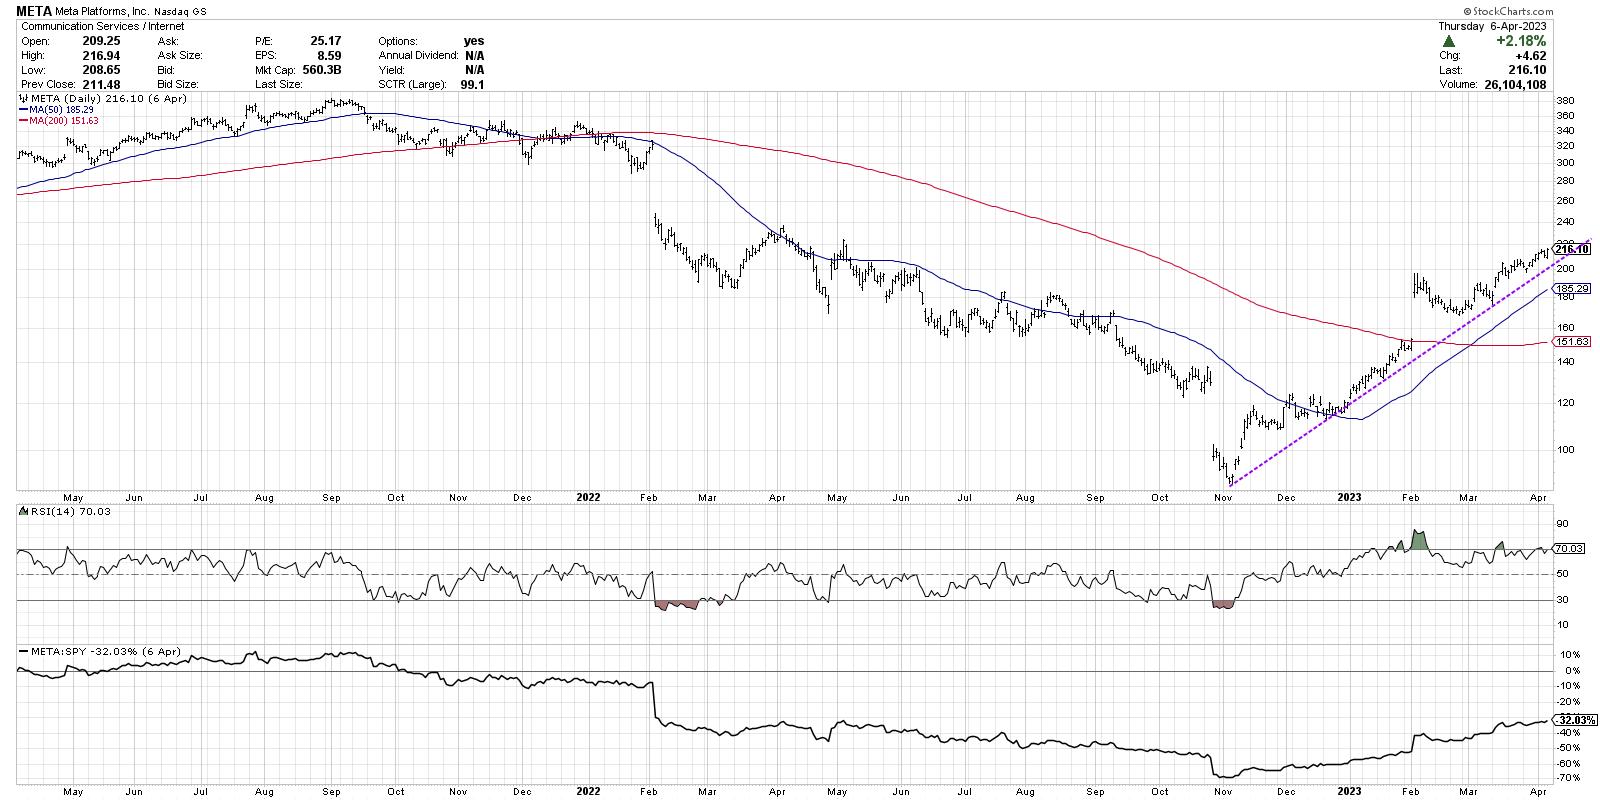
In this episode of StockCharts TV'sThe Final Bar, guest Mary Ann Bartels of Sanctuary Wealth reinforces the strength of long-term secular trends contrasted with short-term deterioration for growth stocks. Meanwhile, Dave highlights one of the FAANG stocks prominently displaying the dreaded bearish momentum divergence!
This video was originally...
READ MORE
MEMBERS ONLY
Red Flags Raised by Bearish Engulfing Patterns
by David Keller,
President and Chief Strategist, Sierra Alpha Research
In this episode of StockCharts TV'sThe Final Bar, Dave talks through potential red flags on two key growth stocks as the market uptrend pushes into the second half of the year. He answers viewer questions on tracking "smart money" behavior, navigating double top patterns and scanning...
READ MORE
MEMBERS ONLY
Top 10 Stocks to Watch in July 2023, Part 1
by David Keller,
President and Chief Strategist, Sierra Alpha Research
In this episode of StockCharts TV'sThe Final Bar, Part 1 of a two-part special examining the Top Ten Stocks to Watch in July 2023, Dave covers #10-#6, including AAPL, FDX, and more. Stay tuned for Part 2 tomorrow, in which Grayson will follow up with #5-#1....
READ MORE
MEMBERS ONLY
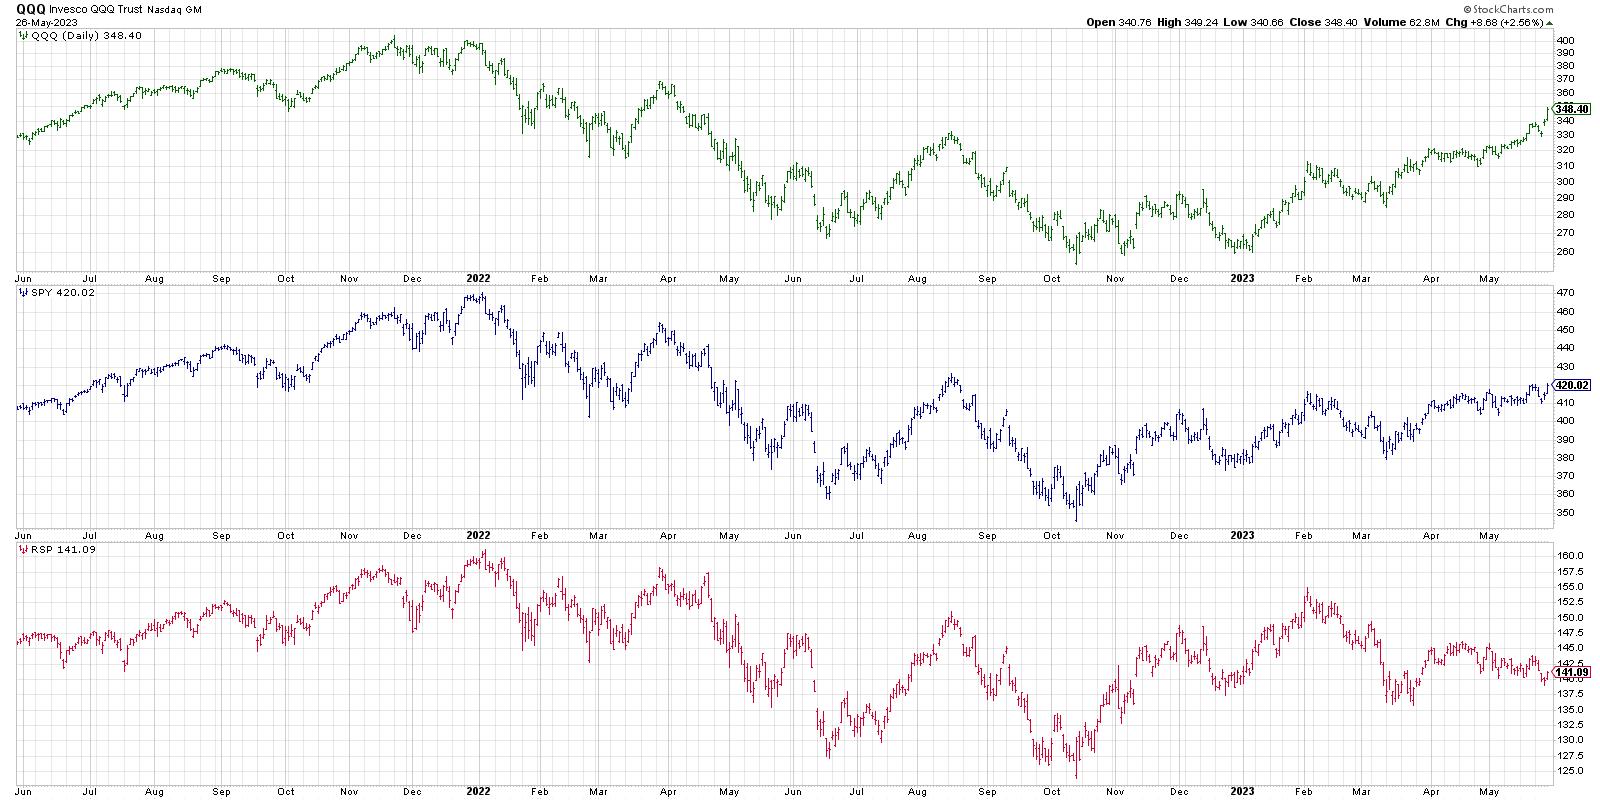
What's Next for QQQ: Super Bullish to Super Bearish
by David Keller,
President and Chief Strategist, Sierra Alpha Research
Exactly how long is this raging bull market driven by mega-cap growth stocks supposed to last? I was taught that, when price trends higher over time, there would often be brief countertrend pullbacks along the way. Apple (AAPL) has completely ignored that market truismand managed to ride this unrelenting ascent...
READ MORE
MEMBERS ONLY
Downside Targets For S&P 500 Pullback
by David Keller,
President and Chief Strategist, Sierra Alpha Research
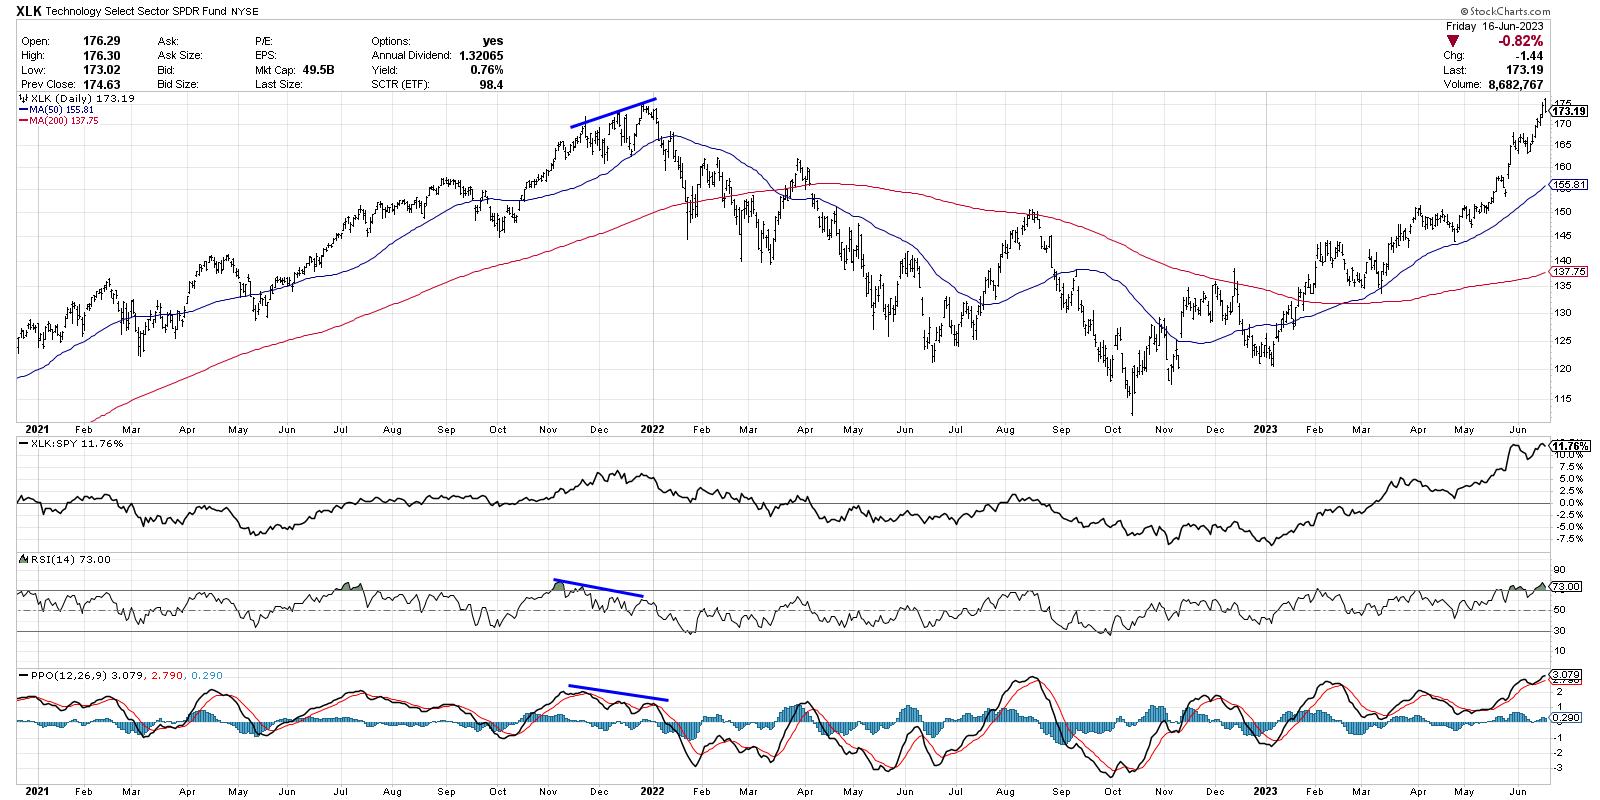
Recently, we've focused on the overextended nature of the small group of mega-cap leadership names in 2023, and even identified threekey charts to watch for a pullback in the technology sector.This week, we observed further deterioration in breadth indicators, with the cumulative advance-decline lines for all cap...
READ MORE
MEMBERS ONLY
Three Charts Show Bear Case for Technology
by David Keller,
President and Chief Strategist, Sierra Alpha Research
As a trend follower, I'm bullish. I can't deny that the trend is positive on all three time frames using my Market Trend Model. So any bear case at this point has to be based on a market being so overextended that it is ripe for...
READ MORE
MEMBERS ONLY
The Super Bullish to the Super Bearish
by David Keller,
President and Chief Strategist, Sierra Alpha Research
One of my favorite parts of hosting a show on StockCharts TVis being able to interview analysts, traders, and money managers with all sorts of different backgrounds.
Recently, I was asked in our mailbag segment about why and how my guests can have very different takes on the markets at...
READ MORE
MEMBERS ONLY
The Bull Case for Energy is Clear
by David Keller,
President and Chief Strategist, Sierra Alpha Research
What compels me to write a bold headline claiming one sector is obviously poised to break out to the upside?
As a trend follower, I have three goals every day: identify trends, follow those trends, and anticipate when those trends may reverse. Simple, right?
Energy has been the worst-performing sector...
READ MORE
MEMBERS ONLY
The Downside to This Up Market
by David Keller,
President and Chief Strategist, Sierra Alpha Research
Are stocks in a bull market phase at the moment?
Well, that certainly depends on where you're looking. If you're analyzing the Nasdaq 100 index, or semiconductors, or AAPL, or NFLX, or a handful of other mega-cap growth names, then that is basically an undeniable truth...
READ MORE
MEMBERS ONLY
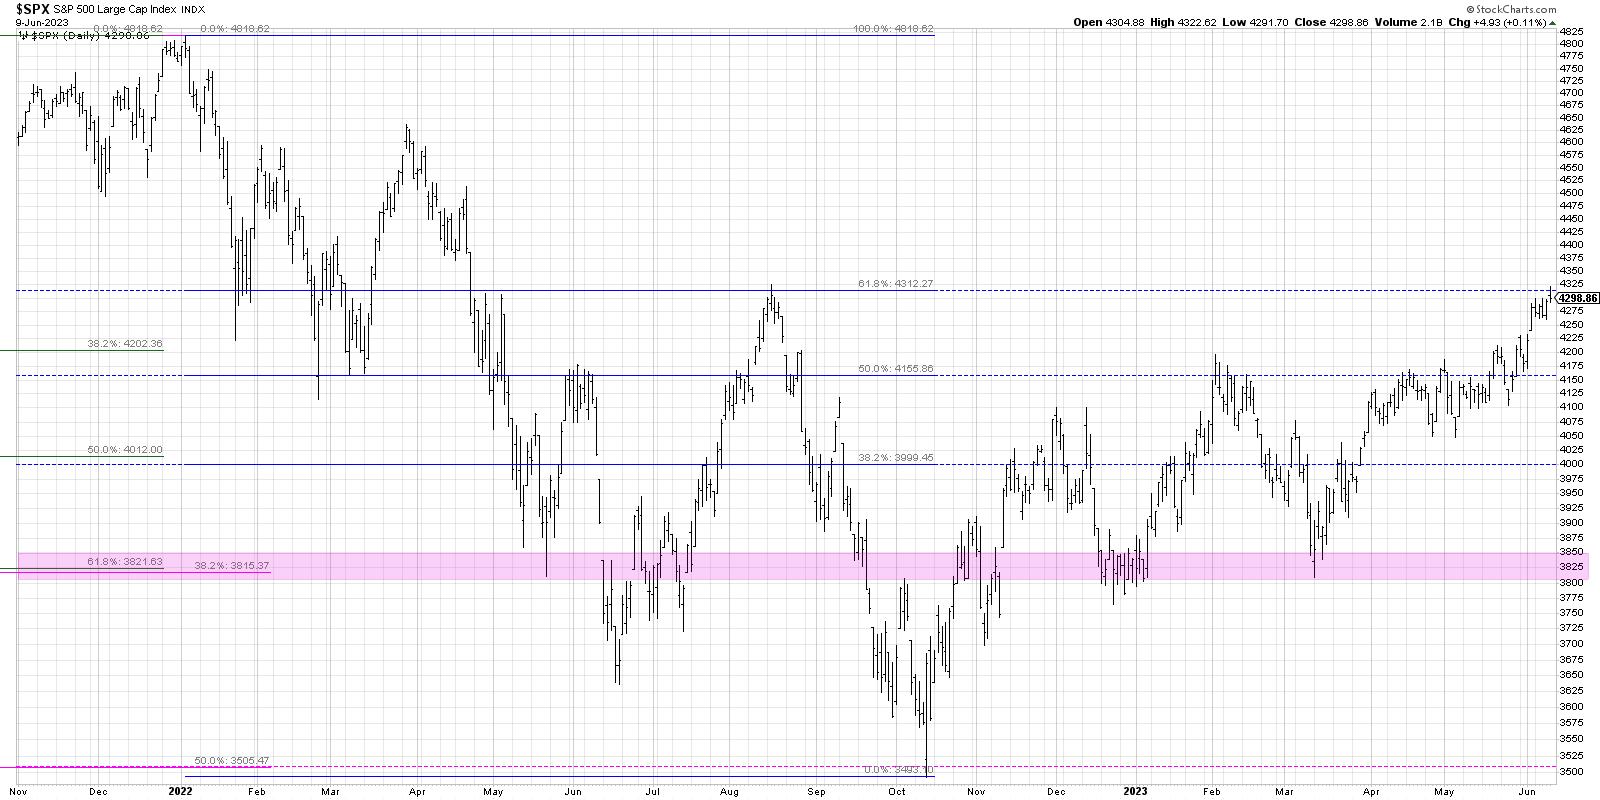
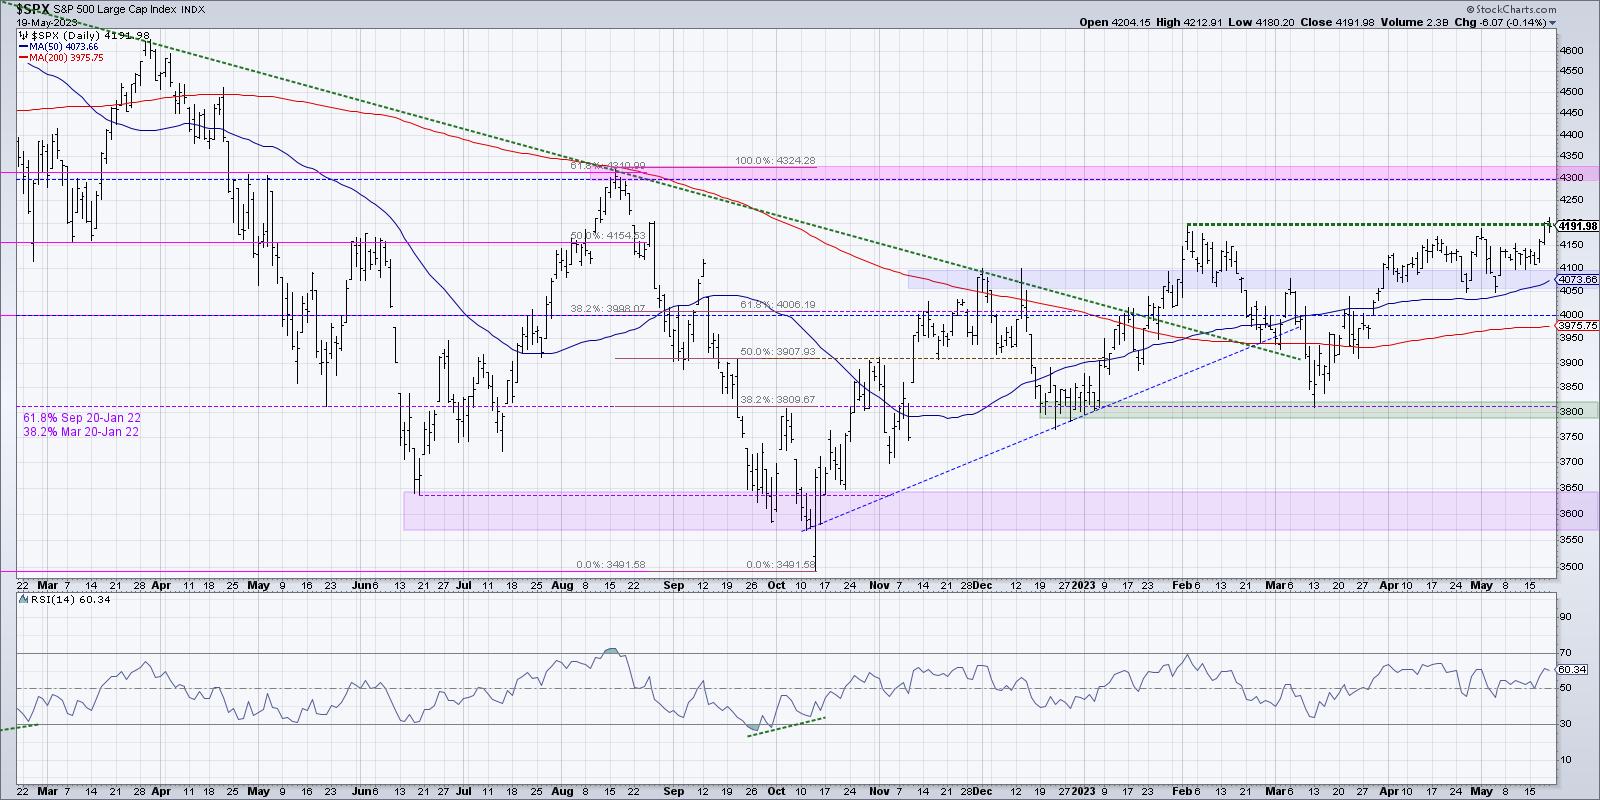
Fibonacci Says Upside to SPX 4300
by David Keller,
President and Chief Strategist, Sierra Alpha Research
Earlier this week, I completed a "clean slate" exercise on the S&P 500 chart.
You see, my charts become pretty busy over time, because I draw lots of trend lines and put notes on the charts as well. Basically, I consider charts to be the way...
READ MORE
MEMBERS ONLY
Ending the Sloppy Choppy Phase
by David Keller,
President and Chief Strategist, Sierra Alpha Research
In the last two weeks, I've heard this market described as "frustratingly neutral", "decidedly sideways", "stuck", and my personal favorite, the "sloppy choppy" phase. So how does the market breakout of this sideways period and move into a new bullish...
READ MORE
MEMBERS ONLY
Three Charts Suggest Pullback Imminent
by David Keller,
President and Chief Strategist, Sierra Alpha Research
The major equity averages have stalled out in recent weeks, trading up to their February highs but unable to muster enough positive momentum to push to new swing highs.
The key question as we continue through earnings season is whether there will arise a catalyst to propel the S&...
READ MORE
MEMBERS ONLY
Why Market Conditions Are Not Yet Bullish
by David Keller,
President and Chief Strategist, Sierra Alpha Research
A number of my recent conversations on The Final Barhave related to the conflict presented in the markets in April 2023.Classic measures of market trend, from the Coppock Curve to the Zweig Breadth Thrust to my own Market Trend Model, are all giving a strong positive signal on trend...
READ MORE
MEMBERS ONLY
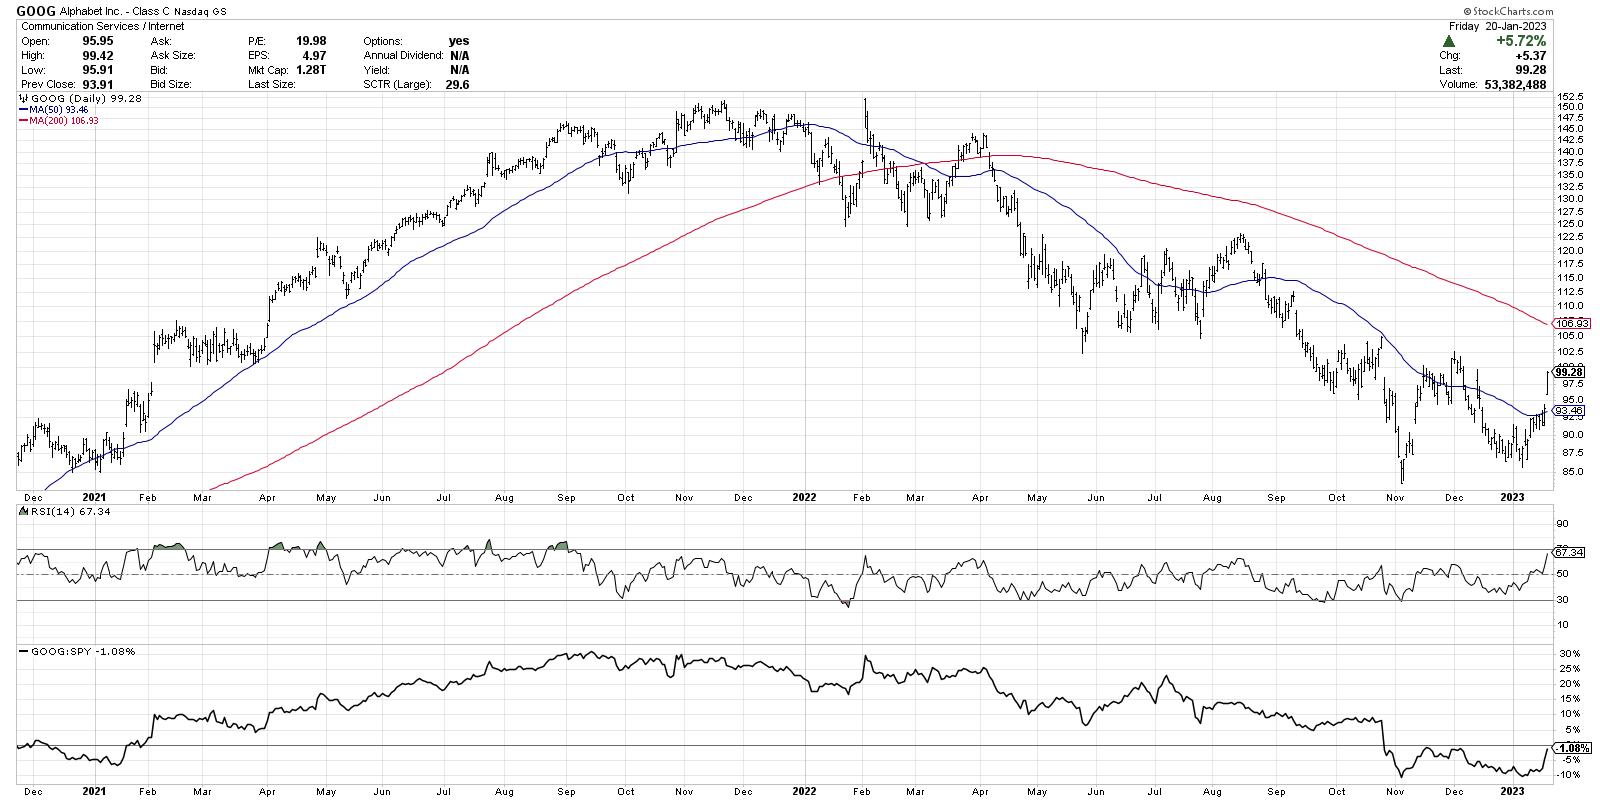
Key Levels for the FAANG Stocks
by David Keller,
President and Chief Strategist, Sierra Alpha Research
A number of my conversations this week on The Final Bardealt with the challenges presented by narrow leadership. Joe Rabil pointed out theweakness in small caps,and Jeff Huge focused on the difference between theYTD returns of FAANG stocksversus pretty much everything else.
Why is narrow leadership such a problem?...
READ MORE
MEMBERS ONLY
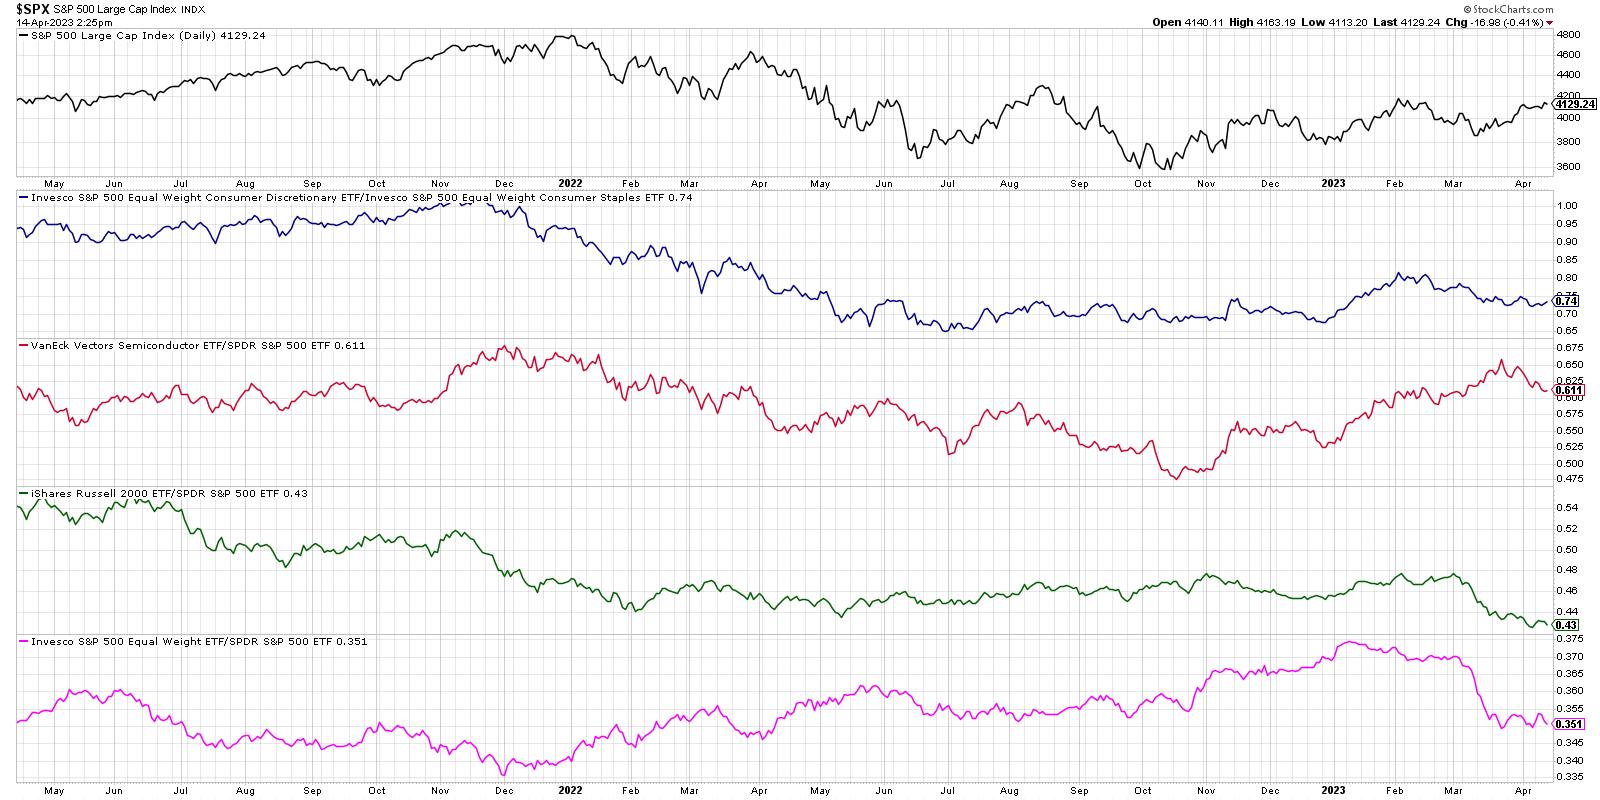
Three ETFs Showing Renewed Strength
by David Keller,
President and Chief Strategist, Sierra Alpha Research
With the first quarter of 2023 drawing to a close, what impresses me most about the equity markets are the improving breadth conditions. While the markets can move higher on strength from the MANAMANA stocks, sustained bull market phases usually need additional support from other stocks.
One could argue that...
READ MORE
MEMBERS ONLY
Market Trend Model Turns Bearish
by David Keller,
President and Chief Strategist, Sierra Alpha Research
This week, stocks started in a position of strength and ended in a position of weakness. While some groups, like semiconductors, have managed to remain strong, the major benchmarks managing to pound out a positive return for the week, the broad market message appears cautious-at-best by my read.
My main...
READ MORE
MEMBERS ONLY
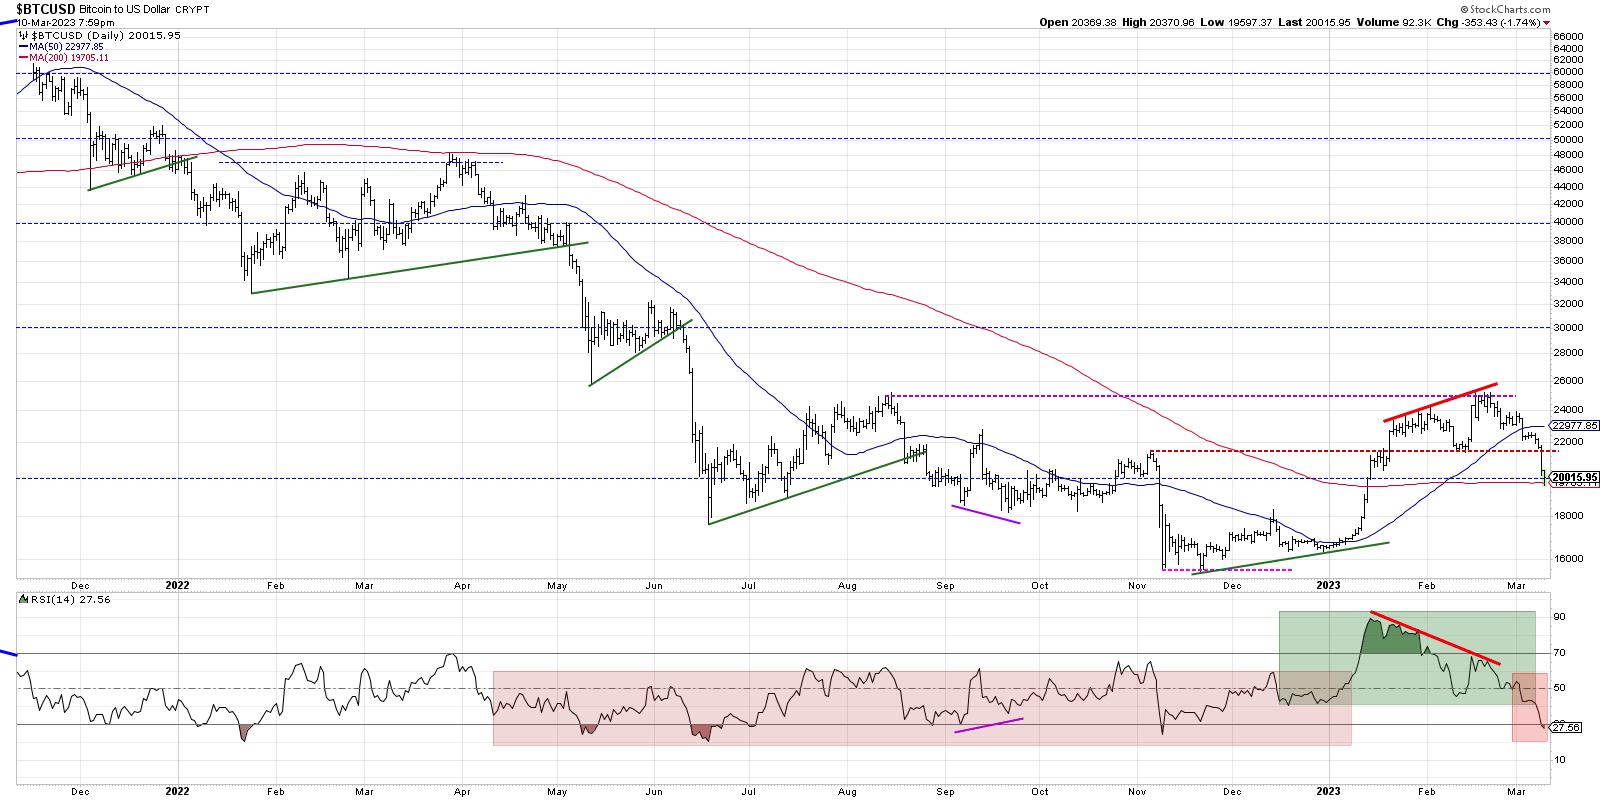
Downside for Bitcoin as Cryptos Crumble
by David Keller,
President and Chief Strategist, Sierra Alpha Research
I'm a big fan of playing the long game as an investor, particularly for long-term accounts that should arguably not be affected by short-term market fluctuations. Talking with experts like Jon Markman, author of Fast Forward Investing, has reminded me that overarching themes like artificial intelligence, electric vehicles,...
READ MORE
MEMBERS ONLY
The Road to SPX 5000
by David Keller,
President and Chief Strategist, Sierra Alpha Research
My conversations with Chris Verrone, Adrian Zduńczyk, and Mary Ellen McGonagle this week on The Final Barleft me striving to simplify my analysis of the S&P 500.
It's been a confusing time for stocks and as a result, my main daily chart of the S&...
READ MORE
MEMBERS ONLY
Nothing Good Happens Below the 200-Day
by David Keller,
President and Chief Strategist, Sierra Alpha Research
One of my early mentors often remarked, "Nothing good happens below the 200-day."This was his way of recognizing that, while stocks can certainly pop higher from beaten down levels, you're more likely to experience sustained advances once the price is above the 200-day moving average....
READ MORE
MEMBERS ONLY
The Bullish Case for Gold
by David Keller,
President and Chief Strategist, Sierra Alpha Research
People absolutely love to not love gold. When I post bullish gold comments on social media, I am guaranteed to get some not-so-constructive pushback on an optimistic thesis.
Why do people love to hate the gold trade? Well, for starters, it hasn't worked in a long time. But...
READ MORE
MEMBERS ONLY
Three Concerning Signs for Stocks
by David Keller,
President and Chief Strategist, Sierra Alpha Research
I've recognized the strength displayed by the S&P 500 and Nasdaq Composite off the October lows. I've written about the New Dow Theory buy signaland the improvement in breadth indicators like thepercent of stocks above moving averages.So, while I am not as all-in...
READ MORE
MEMBERS ONLY
New Dow Theory Declares Bullish Phase
by David Keller,
President and Chief Strategist, Sierra Alpha Research
While the technical analysis toolkit has certainly evolved over time, having benefitted from advances in computing and data analysis, in many ways, the tools of the modern technical analyst are not far from the original work of Charles Dow in the early 20th century. But an updated version of his...
READ MORE
MEMBERS ONLY
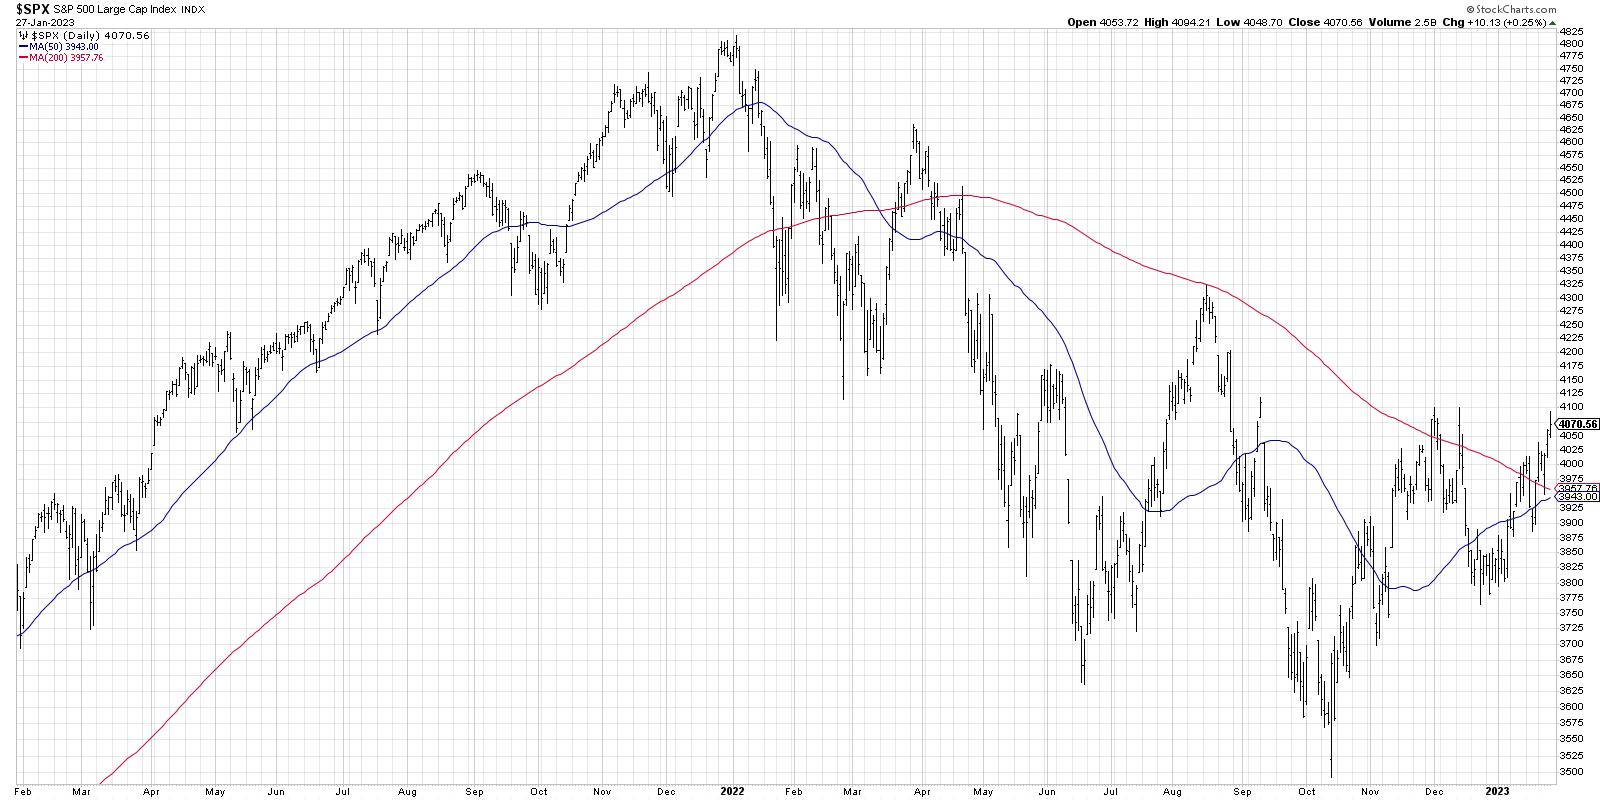
The S&P 500 Leaves the 200-Day Behind
by David Keller,
President and Chief Strategist, Sierra Alpha Research
How much weight should we put on the fact that the S&P 500 index powered above its 200-day moving average (MA) this week? If history is any indication, then this is actually a fairly momentous occasion. Unless it's a repeat of March 2022, in which case...
READ MORE
MEMBERS ONLY
The Most Important Breadth Indicator to Follow
by David Keller,
President and Chief Strategist, Sierra Alpha Research
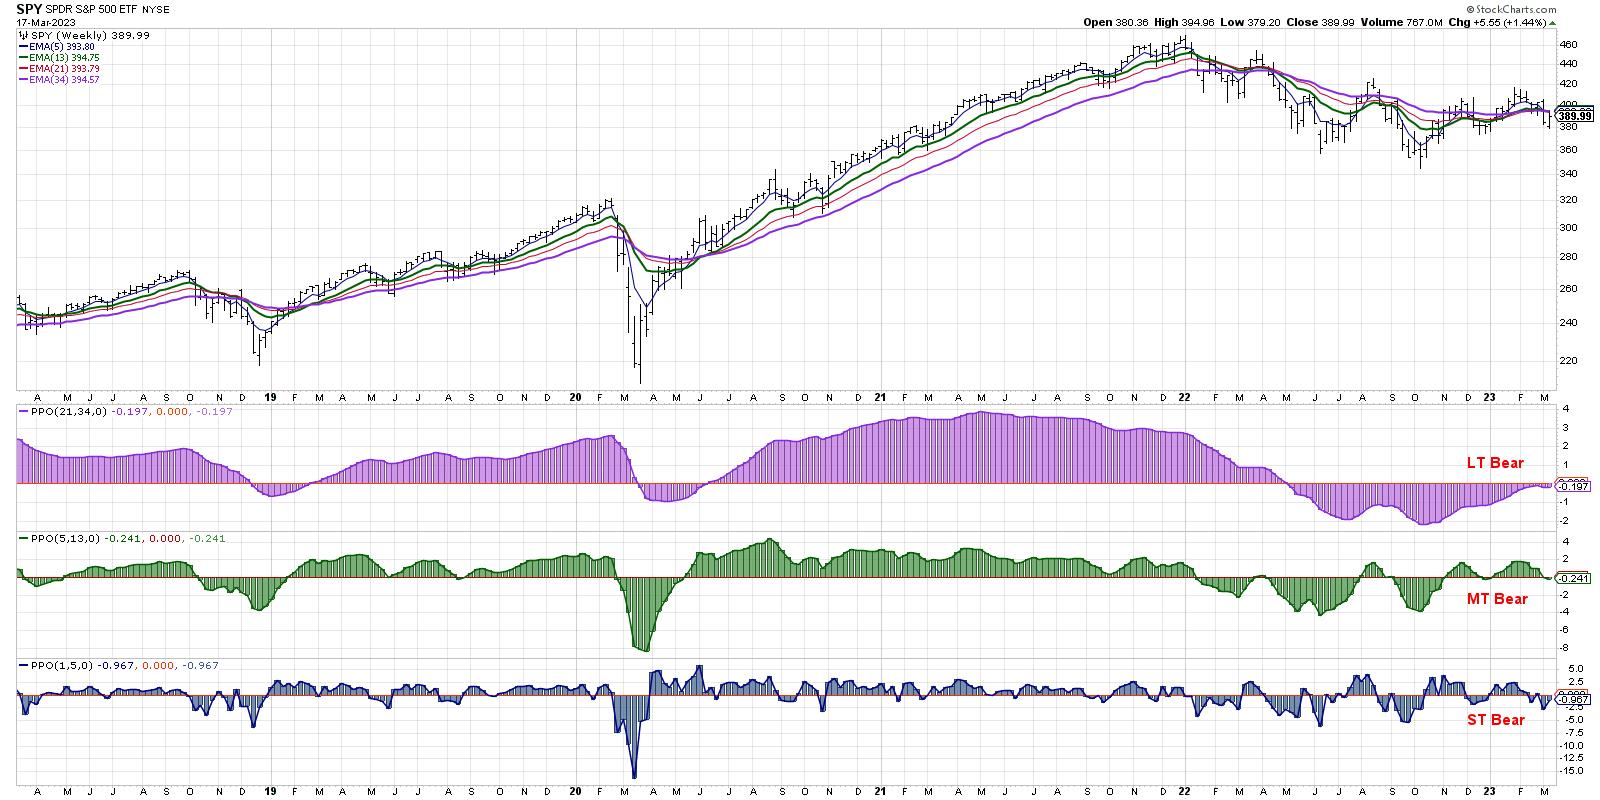
I like to keep my process simple. That means I define the market trend using a simple combination of exponential moving averages. That also means that my charts are relatively straightforward, avoiding too many indicators and sticking to what I consider simple measures of trend and momentum.
So when I...
READ MORE
MEMBERS ONLY
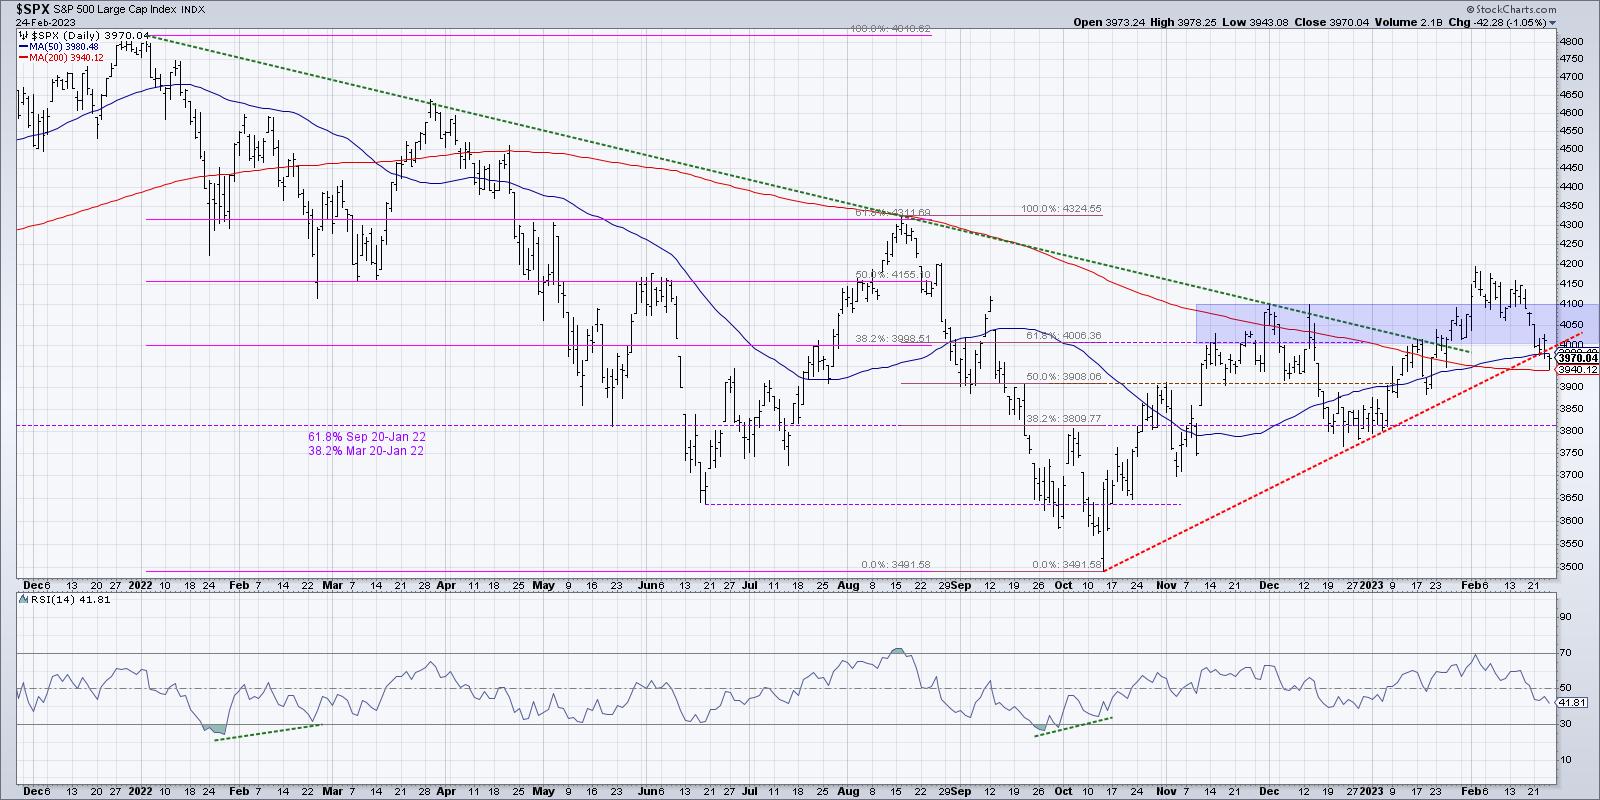
The Four Scenarios for the S&P 500
by David Keller,
President and Chief Strategist, Sierra Alpha Research
Position for the most probable scenario, but plan for alternative scenarios.
Why is this a sentence that should be printed out and taped to your monitor, now if not sooner? Because, as investors we often become very tied to a particular narrative.
The Fed is wrapping up its tightening cycle...
READ MORE
MEMBERS ONLY
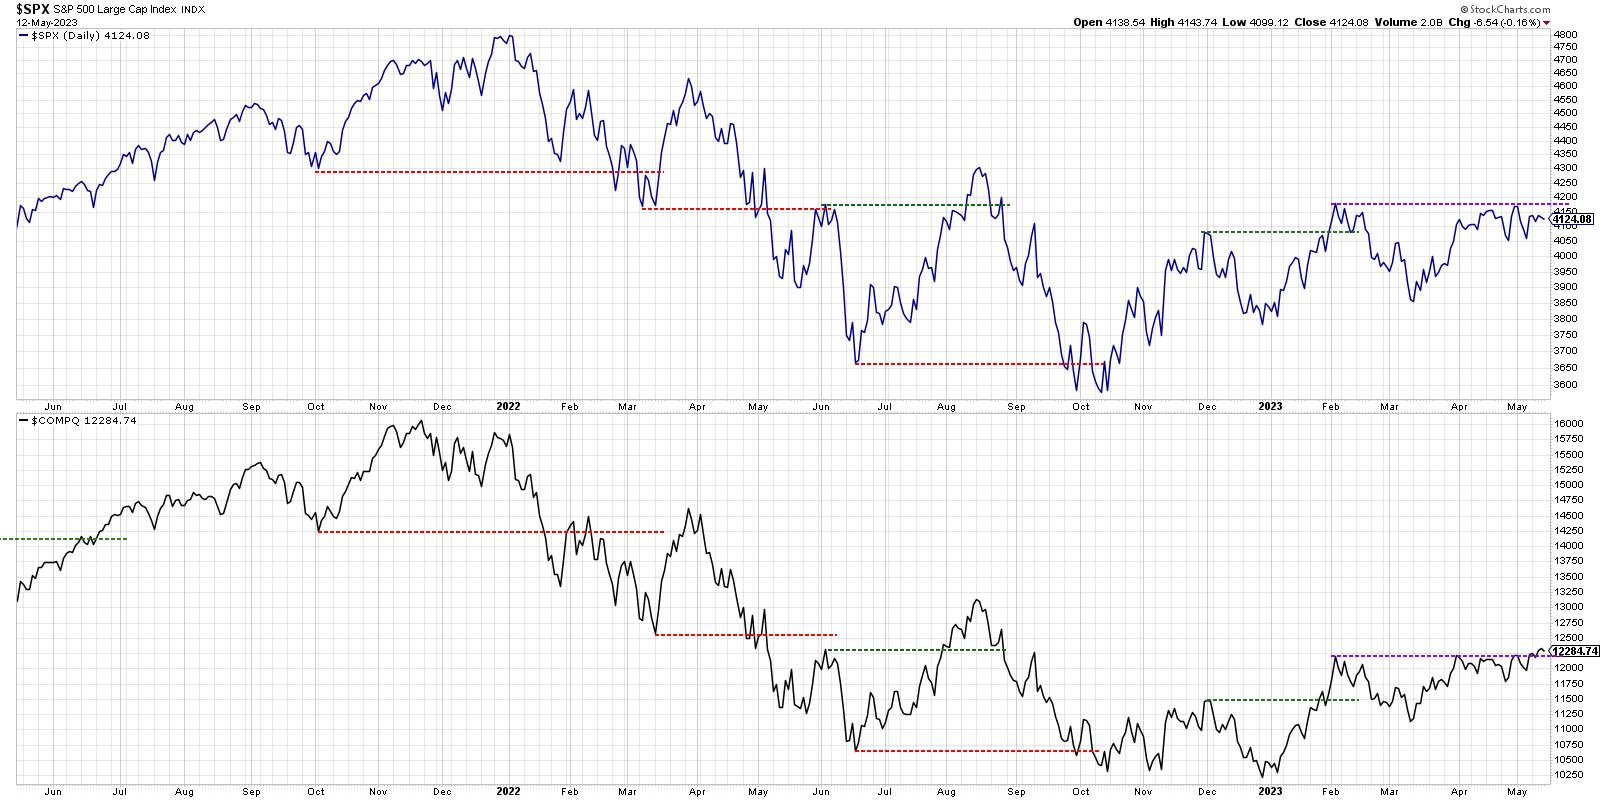
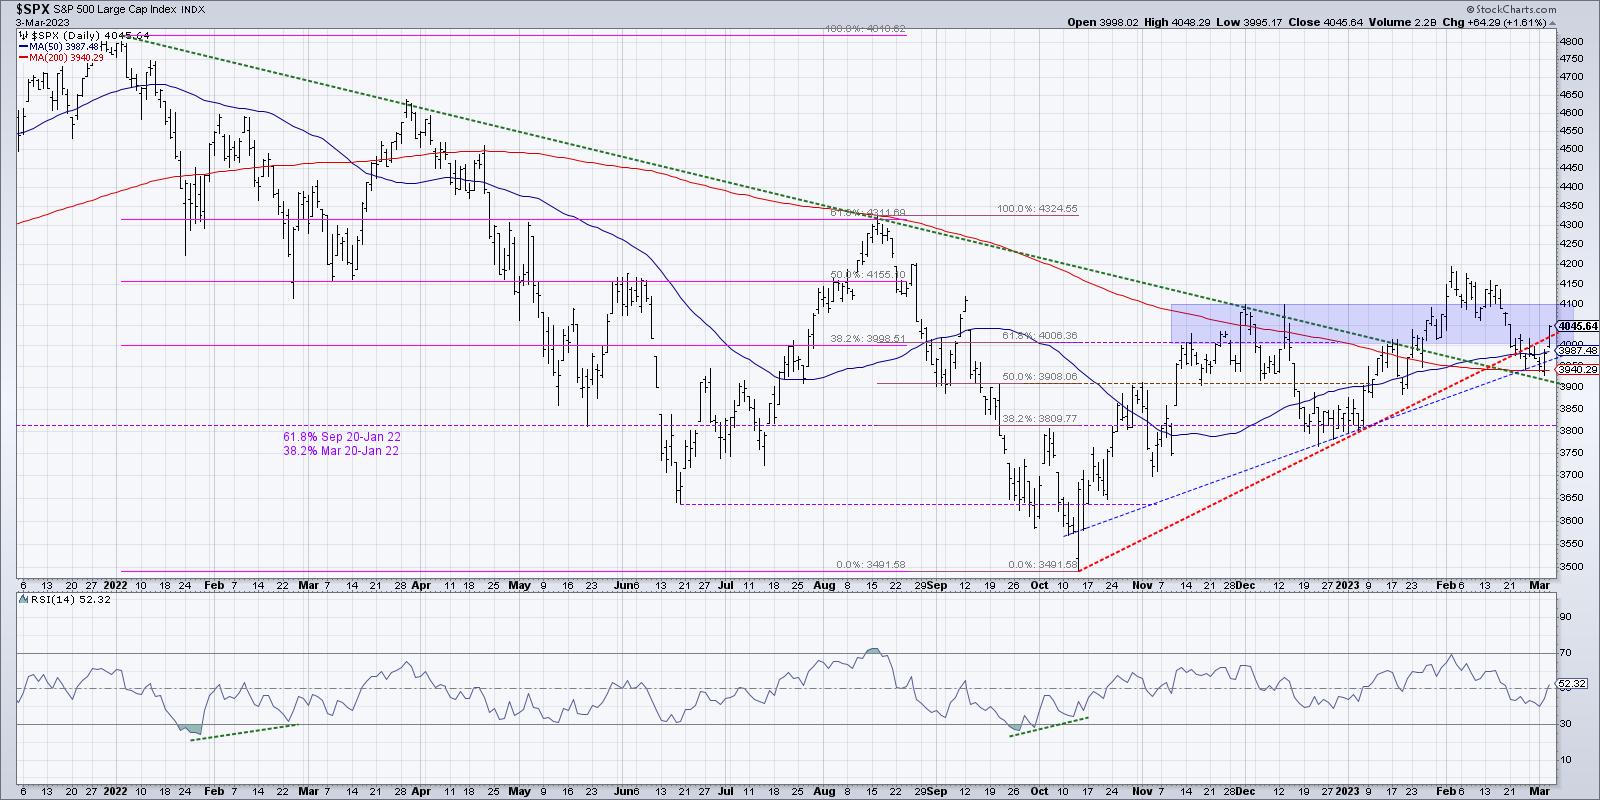
Respecting the Rangebound S&P 500
by David Keller,
President and Chief Strategist, Sierra Alpha Research
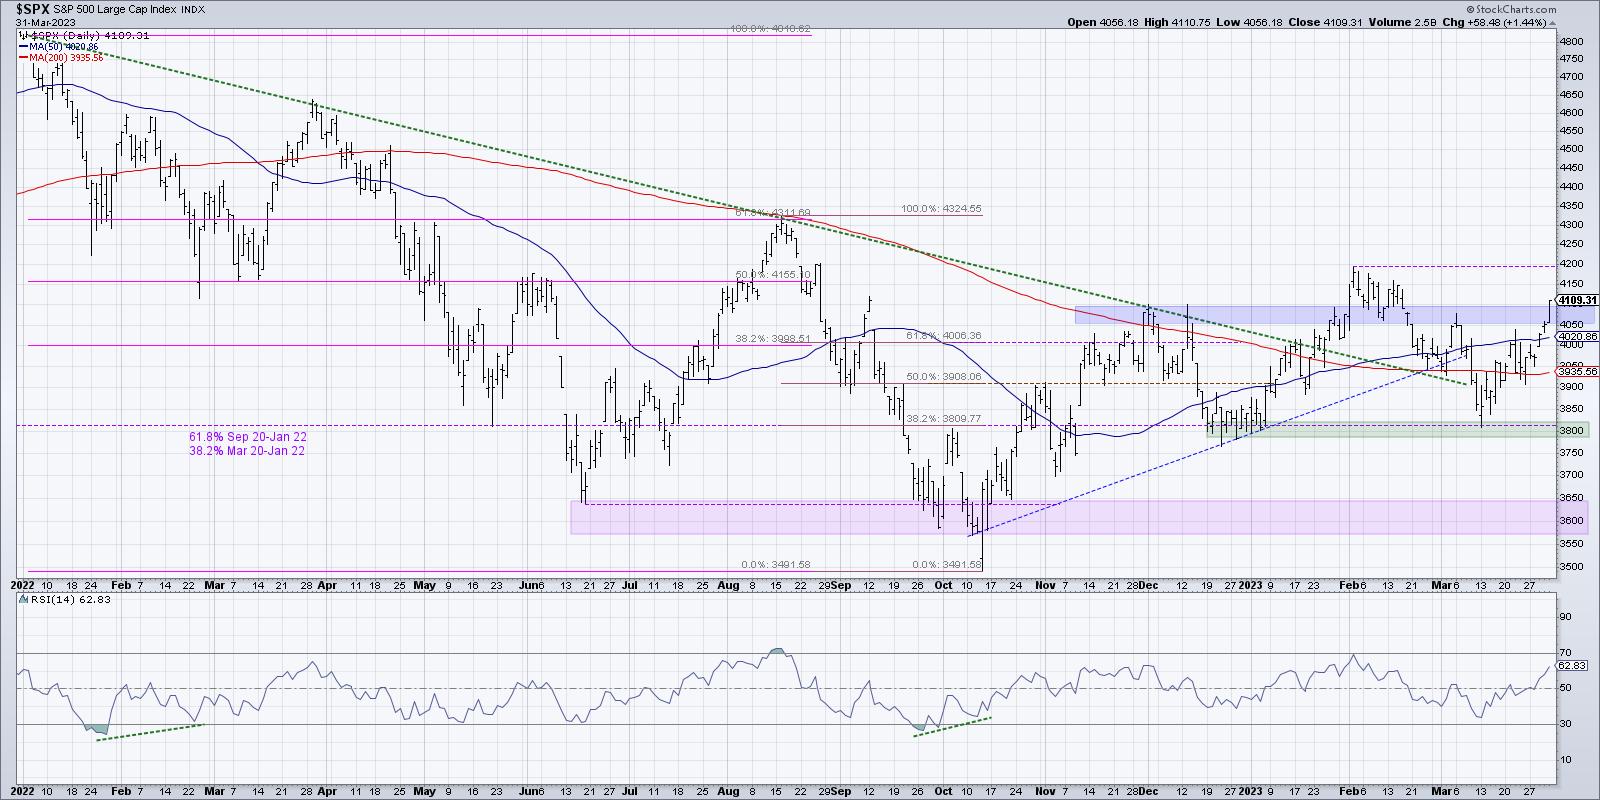
As the great bear market of 2022 was really hitting its stride, the 3800 level came into view as a likely support level for stocks. We keyed in on that level based on Fibonacci Retracements using the March 2020 low and the January 2022 high. At the time, that seemed...
READ MORE