MEMBERS ONLY
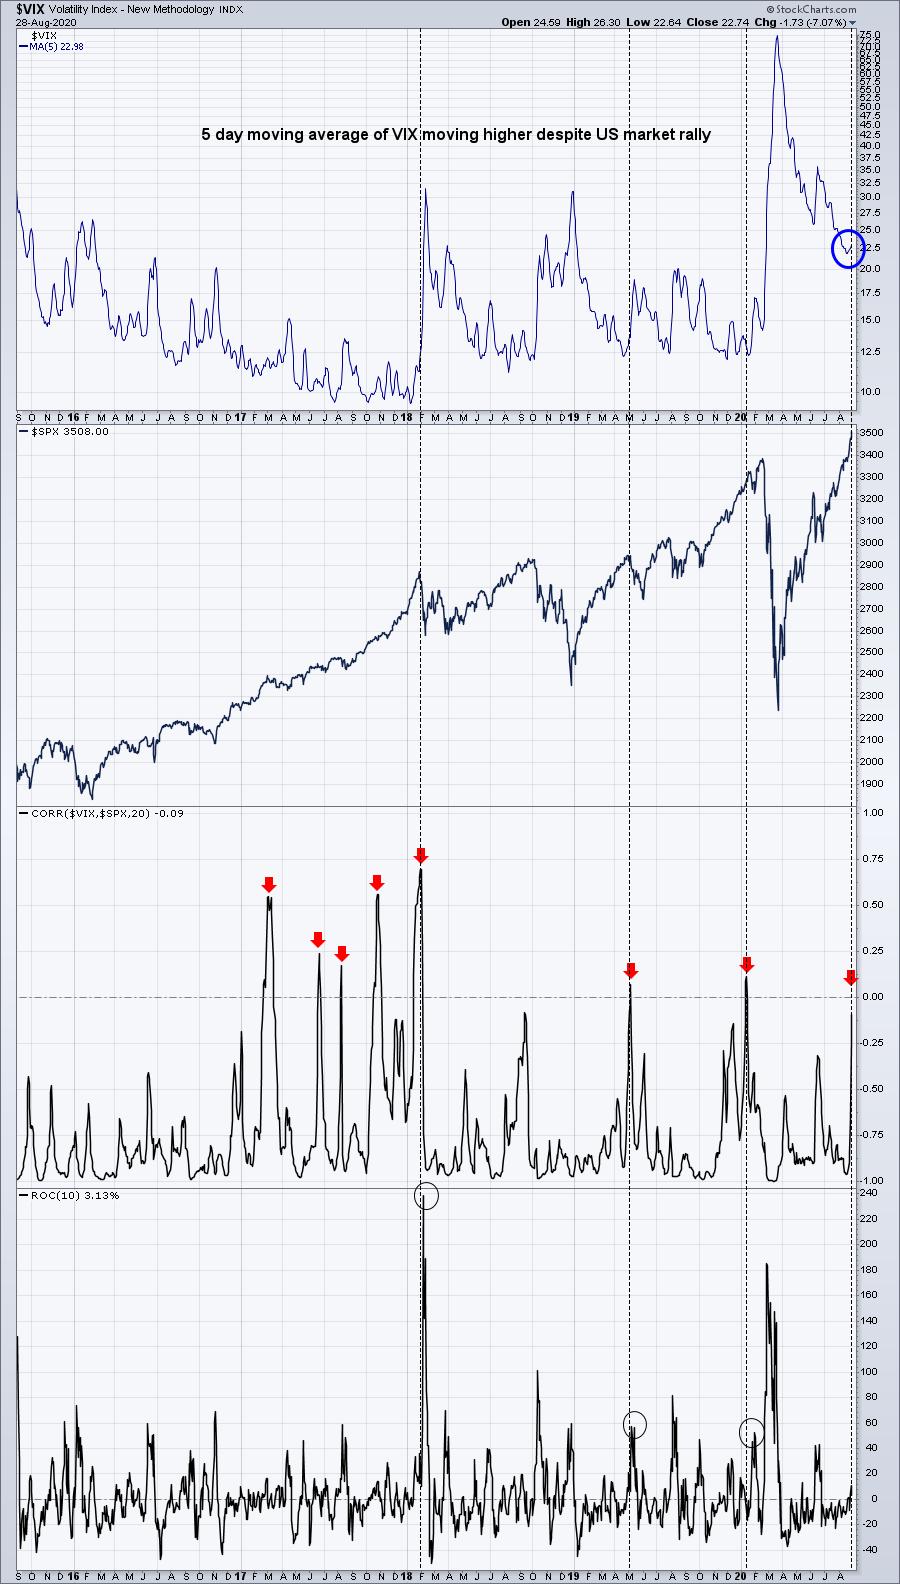
Key Sentiment Indicator is Flashing a Major Short-Term Warning

by Tom Bowley,
Chief Market Strategist, EarningsBeats.com
If you've followed my work, you know three things. First, I'm one of the few analysts that kept my long-term secular bull market call intact despite the pandemic-induced selloff back in March. Second, while my big picture view is firmly bullish, my primary focus is on...
READ MORE
MEMBERS ONLY
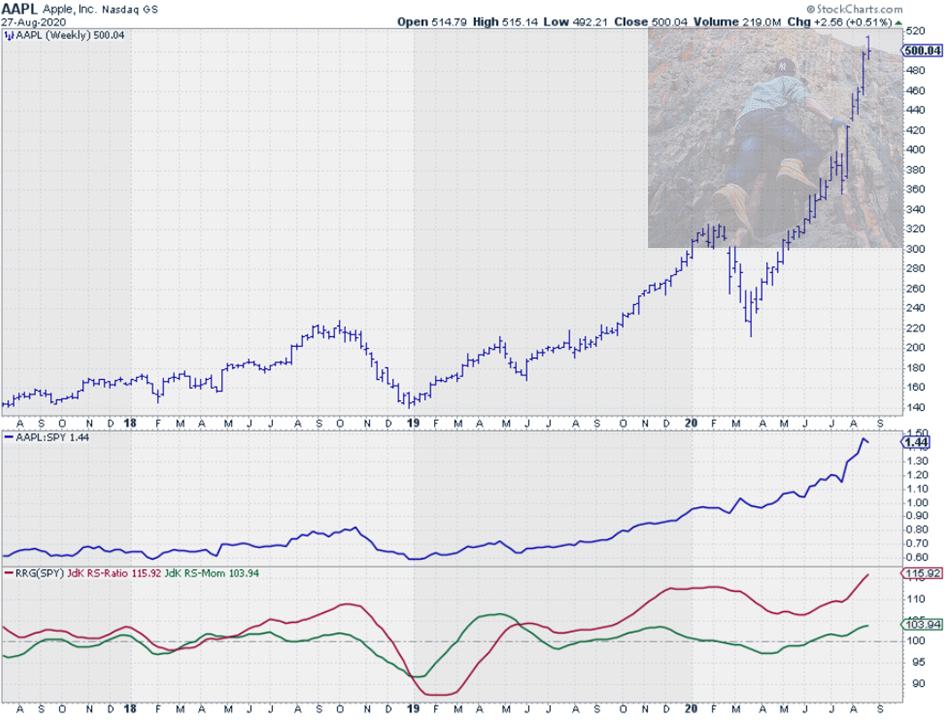
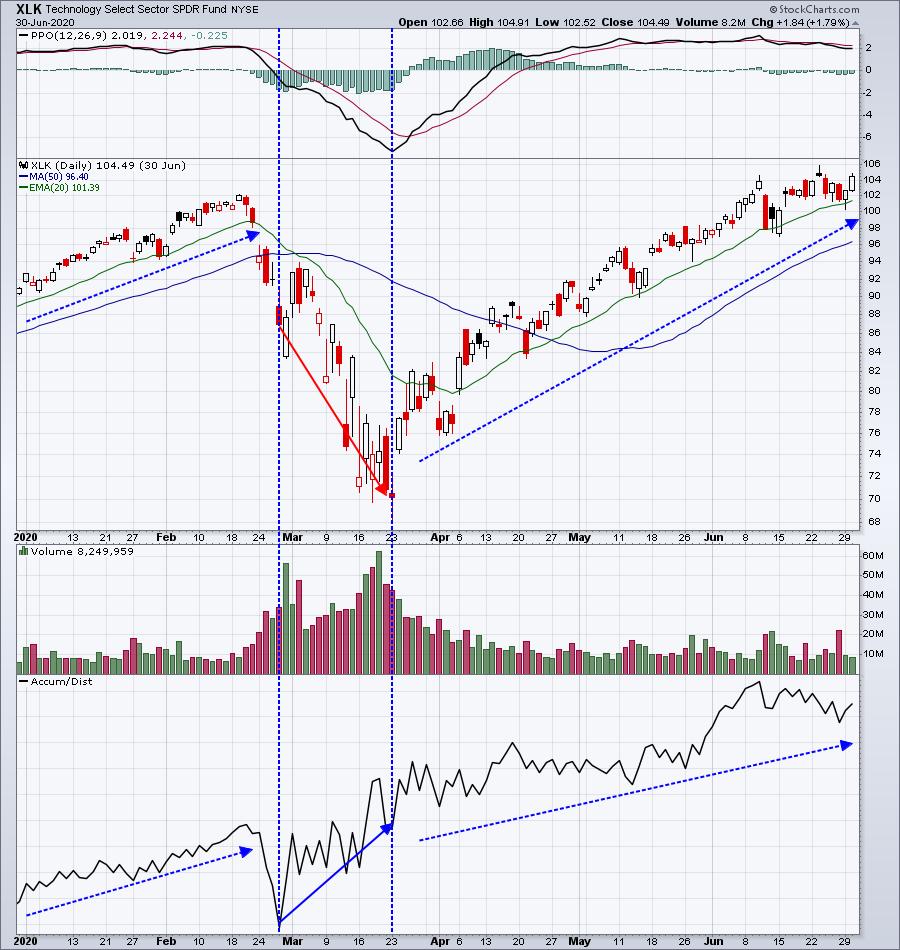
Swap From XLK to RYT to Mitigate The Increasing Risk For AAPL

by Julius de Kempenaer,
Senior Technical Analyst, StockCharts.com
Last week, I wrote an article titled "What Can We Learn From Equal Weight vs. Cap Weighted Rotations on RRG". In that article, I touched upon distortions between EW and CW sector ETFs because of the large and increasing weight of a few Mega-Cap stocks.
In this week&...
READ MORE
MEMBERS ONLY

PRECIOUS METALS BOUNCE BACK FROM YESTERDAY'S SELLING -- AND REMAIN ABOVE SUPPORT LEVELS -- THE FED'S NEW PATIENCE ON INFLATION SHOULD BE GOOD FOR GOLD AND SILVER

by John Murphy,
Chief Technical Analyst, StockCharts.com
GOLD SPDR HOLDS SUPPORT... My Wednesday message showed precious metals and their miners pulling back to underlying support levels within major uptrends. That's still the case. My message from yesterday described profit-taking in those same precious metals following an upside spike in bond yields after the head of...
READ MORE
MEMBERS ONLY
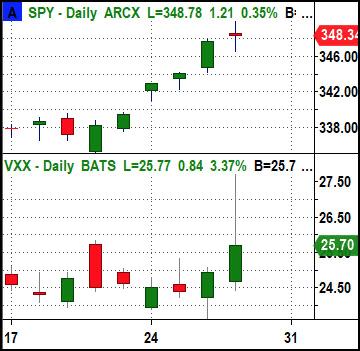
Big Red Flag for Stocks on Fed Day

by Geoff Bysshe,
Co-founder and President, MarketGuage.com
Today, while the SPY and QQQ were pushing to new highs, the VXX was telling a dramatically different story, which is a warning sign for a potential imminent correction.
The VIXX (Volatility Index ETF) is commonly referred to as a fear gauge, so it naturally tends to go up when...
READ MORE
MEMBERS ONLY
Chartwise Women: Big Gains for Consumer Stocks

by Mary Ellen McGonagle,
President, MEM Investment Research

by Erin Swenlin,
Vice President, DecisionPoint.com
Consumer Spending is taking two paths, both of which are seeing high growth. In this week's edition of Chartwise Women, Mary Ellen and Erin share stocks that are being driven higher by consumer-driven growth during this historical period. In "Yeah... That Happened!", they also discuss the...
READ MORE
MEMBERS ONLY

Eight Charts I Am Watching Closely Right Now

by Martin Pring,
President, Pring Research
* Strong Bull Market Indications
* Short-Term Vulnerability?
Strong Bull Market Indications
We are all aware of the Shakespearian saying "Beware of the Ides of March," which didn't go so well for Julius Caesar. In market folklore, October is the season for crashes and September is the worst-performing...
READ MORE
MEMBERS ONLY
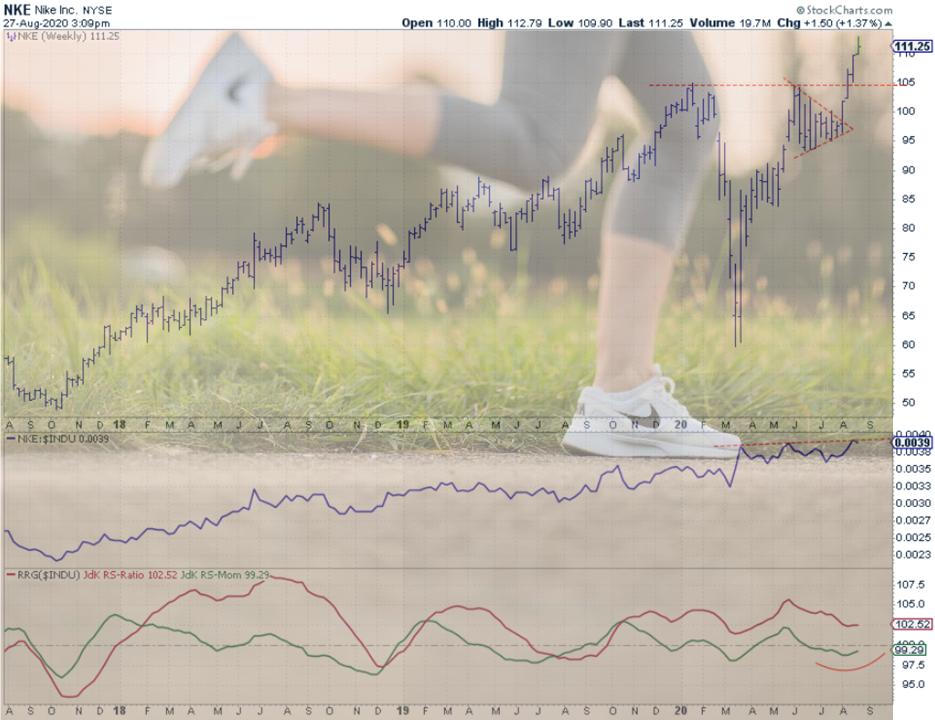
NKE Starts Running!
by Julius de Kempenaer,
Senior Technical Analyst, StockCharts.com
On the weekly Relative Rotation Graph for the DJ Industrials universe, NKE is inside the weakening quadrant following a completed rotation on the right side of the graph (Leading-Weakening-Leading). And over the last few weeks, the tail on NKE has again started to curl back up. These sort of rotations...
READ MORE
MEMBERS ONLY
DP ALERT: Sentiment Is Too Bullish

by Carl Swenlin,
President and Founder, DecisionPoint.com
The NAAIM Exposure Index hit 106.56 this week, which is the second highest reading in the history of this indocator (the highest being in December 2017, a few weeks before the January 2018 market top).
NAAIM (National Association of Active Investment Managers)member firms who are active money managers...
READ MORE
MEMBERS ONLY

10-YEAR YIELD AT TWO-MONTH HIGH -- RISE IN YIELDS BOOSTS FINANCIALS -- BUT MAY BE WEIGHING ON PRECIOUS METALS
by John Murphy,
Chief Technical Analyst, StockCharts.com
TEN-YEAR TREASURY YIELD REACHES TWO-MONTH HIGH...Bond yields are climbing today. That may be a reaction to Mr. Powell's speech suggesting that the Fed was relaxing its attitude toward the possibility of rising inflation. Treasury bonds are being sold as a result which is boosting bond yields. The...
READ MORE
MEMBERS ONLY
Biotechs Are Trending Lower BUT Sending A Major Bullish Signal
by Tom Bowley,
Chief Market Strategist, EarningsBeats.com
During the midst of the financial blow in March due to the pandemic, I realized that not all stock selloffs were created equal. While most stocks moved lower at the open, many were being bought, or accumulated, throughout the trading day. It was at that point that I ditched the...
READ MORE
MEMBERS ONLY
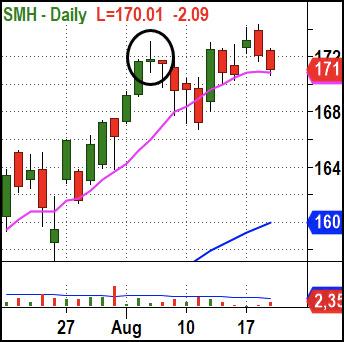
Patterns Combust into Panic
by Geoff Bysshe,
Co-founder and President, MarketGuage.com
If you were to look at the Modern Family you'd see a quiet August trading day waiting to hear Fed Chair Powell's speech tomorrow. Grandpa Russell (IWM) fell asleep and closed down for the day firmly stuck in a two-week bullish flag. Meanwhile, SMH edged higher...
READ MORE
MEMBERS ONLY

Darvas - The Good and Bad

by Dave Landry,
Founder, Sentive Trading, LLC
In this edition of Trading Simplified, Dave continues his discussion of Darvas Boxes to help you build upon your toolbox. He walks through Mystery Charts and presents examples of Darvas Methodology in action.
This video was originally broadcast on August 26th, 2020. Click anywhere on the Trading Simplified logo above...
READ MORE
MEMBERS ONLY

GOLD AND SILVER ETFS TEST UNDERLYING SUPPORTS WITHIN MAJOR UPTRENDS -- SO DO THEIR MINERS
by John Murphy,
Chief Technical Analyst, StockCharts.com
GOLD ETF AND ITS MINERS TEST UNDERLYING SUPPORT... Precious metals have spend most of August pulling back from their recent strong advances which has enabled them to work off some short-term overbought conditions. And they're testing underlying support levels. Chart 1 shows the Gold SPDR (GLD) testing a...
READ MORE
MEMBERS ONLY

FACEBOOK AND NETFLIX LEAD COMMUNICATIONS HIGHER -- TWITTER MAY BE BREAKING OUT
by John Murphy,
Chief Technical Analyst, StockCharts.com
COMMUNICATION SERVICES LEAD MARKET HIGHER... Chart 1 shows the Communication Services SPDR (XLC) climbing nearly 2% today to a new record. It's relative strength line in the upper box is breaking out as well. It's two biggest percentage gainers are Netflix and Facebook. Chart 2 shows...
READ MORE
MEMBERS ONLY
No Recovery Happening Here
by Geoff Bysshe,
Co-founder and President, MarketGuage.com
Today's chart (below) is the consumer confidence survey data, which today hit its lowest level since 2014.
At the same time, data on new home sales, as well as earnings from home builder Toll Brothers (TOL), are at their best levels in years. It seems a little inconsistent...
READ MORE
MEMBERS ONLY
Sector Spotlight: Putting Industries Inside Technology
by Julius de Kempenaer,
Senior Technical Analyst, StockCharts.com
In this edition of Sector Spotlight, I work my way through the investment pyramid in a top-down fashion using RRGs. After the break, I analyze an RRG that holds the industry indexes that make up the technology sector to get a more granular handle on the rotations of various groups...
READ MORE
MEMBERS ONLY

What Can We Learn From Equal Weight vs. Cap Weighted Rotations on RRG?
by Julius de Kempenaer,
Senior Technical Analyst, StockCharts.com
By far the most-watched Relative Rotation Graph is the one that shows the rotation for the 11 S&P sectors, and for good reason; it shows very clearly where the strengths and weaknesses in the various areas of the market are.
But we have to realize that some of...
READ MORE
MEMBERS ONLY

DP Show: Will These Bull Market Bubbles Pop?
by Erin Swenlin,
Vice President, DecisionPoint.com
by Carl Swenlin,
President and Founder, DecisionPoint.com
In this episode of DecisionPoint, Carl and Erin look back at the dot com bubble and discussed why many are talking "bubbles," given the voracity of the Bull Market coming out of the March lows. Carl zeroed in on Apple (AAPL) then and now, before then discussing a...
READ MORE
MEMBERS ONLY

GAP AND GENERAL MOTORS HELP LEAD XLY HIGHER TODAY -- REBOUND IN TRAVEL & TOURISM STOCKS BOOSTS EXPEDIA
by John Murphy,
Chief Technical Analyst, StockCharts.com
GAP AND GENERAL MOTORS HELP LEAD CYCLICALS HIGHER... My weekend message showed the Consumer Discretionary SPDR (XLY) setting new records. It's hitting another one today led higher by cruise lines, clothing, travel & tourism, gambling, and apparel retailers. Two stocks in particular show up on today's...
READ MORE
MEMBERS ONLY

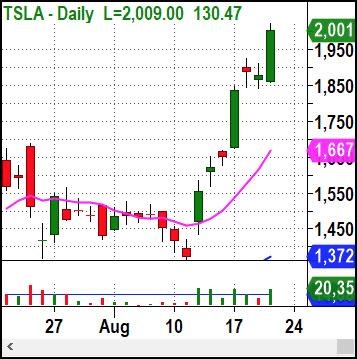
Towering TSLA!

by Bruce Fraser,
Industry-leading "Wyckoffian"
Starting in the second quarter of 2019, Tesla Inc. (TSLA) stock has launched like a SpaceX rocket. In the Wyckoff Method a ‘Cause' will precede an ‘Effect'. A Cause is a preparation phase of Accumulation or Distribution (a trading range). The Horizontal Point and Figure (PnF) counting technique...
READ MORE
MEMBERS ONLY

S&P 500 ENDS WEEK AT NEW RECORD -- TECHNOLOGY STOCKS CONTINUE TO LEAD -- SO DO CONSUMER DISCRETIONARY STOCKS -- ESPECIALLY STOCKS TIED TO HOUSING
by John Murphy,
Chief Technical Analyst, StockCharts.com
S&P 500 HITS NEW RECORD ON FRIDAY... The S&P 500 hit a record close on Tuesday and on Friday exceeded its February intra-day peak at 3393 to confirm a new all-time high as shown by the weekly bars in Chart 1. The Nasdaq hit another record...
READ MORE
MEMBERS ONLY

Week Ahead: These Two Factors Will Affect NIFTY; RRG Chart Point Towards Broader Indexes Performing Well

by Milan Vaishnav,
Founder and Technical Analyst, EquityResearch.asia and ChartWizard.ae
After taking a breather in the week prior, this week the markets resumed their move higher and posted some incremental gains once again. Over past five days, the NIFTY has experienced range-bound oscillations, with the range still being close to its normal trading width. At the same time, the Index...
READ MORE
MEMBERS ONLY
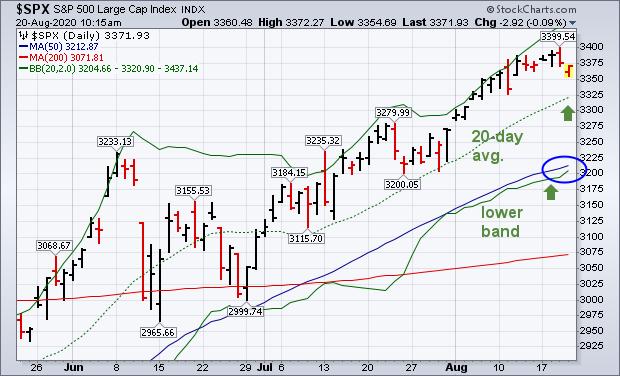
Another Look at Bollinger Bands
by John Murphy,
Chief Technical Analyst, StockCharts.com
Last Friday's message applied Bollinger bands to the S&P 500 and cautioned that the market looked a bit stretched over the short-run. Prices have since backed off slightly from the upper band, but remain well above the dashed 20-day average (green arrow) which means that the...
READ MORE
MEMBERS ONLY

Huge Inflection Point for This Leading Group!
by Mary Ellen McGonagle,
President, MEM Investment Research
In this episode of StockCharts TV'sThe MEM Edge, Mary Ellen shares the one group that's trading on news and what to be on the lookout for. She also discusses economic reports, add-on plays and the housing industry, plus provides her outlook on which lockdown stocks to...
READ MORE
MEMBERS ONLY
Powerful Scanning Strategies for Our Strong Earnings ChartList

by John Hopkins,
President and Co-founder, EarningsBeats.com
It's been a very exciting time for the bulls, with the NASDAQ and S&P hitting all-time highs this week. In fact, for those who have been skeptical and sat out the move off of the March 21 bottom, this has been painful to watch, with the...
READ MORE
MEMBERS ONLY

After You've Pored Over The Charts And They've Yielded All Their Truths, Try These Tools

by Gatis Roze,
Author, "Tensile Trading"
Yes, I'm a chartist.
Yes, I can glean profitable insights using my technical tools.
No, charts are not the only tool in my analysis bag.
If that were the case, it would be akin to buying a Ferrari while living in a studio rental. That would be totally...
READ MORE
MEMBERS ONLY
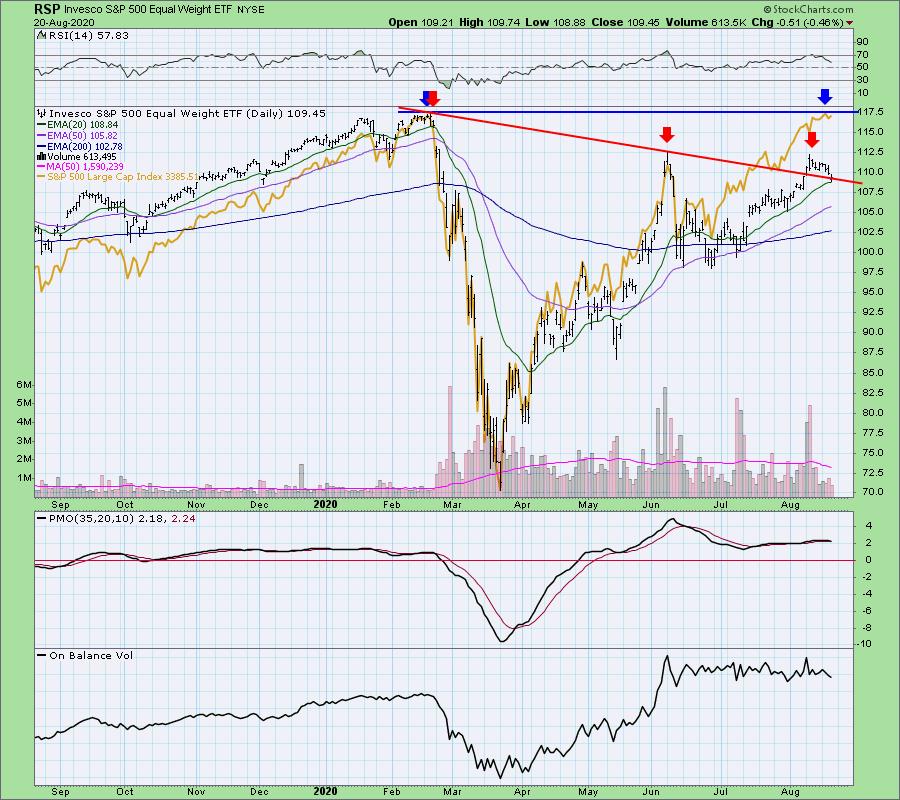
Equal-Weight S&P 500 (RSP) Weaves Bearish Tale + Free DP Trading Room Monday with Carl!
by Erin Swenlin,
Vice President, DecisionPoint.com
Yesterday I had the pleasure of doing a podcast with FinancialSense.com's James Puplava (I'll send the link out to the DecisionPoint free email list when I have it - sign up on the DecisionPoint.com homepage). We talked at length about the "top ten&...
READ MORE
MEMBERS ONLY

Information - Actionable or Observable

by Greg Morris,
Veteran Technical Analyst, Investor, and Author
I published this article in 2017 and believe it has even more merit today. Financial and business-related television always tries to relate an up market to good news and a down market to bad news. Some truly believe they are the ones that move the market; that is an amazing...
READ MORE
MEMBERS ONLY

New 52-week Highs Underwhelm, But Outpace New Lows

by Arthur Hill,
Chief Technical Strategist, TrendInvestorPro.com
The total number of new highs in the S&P 500, S&P MidCap 400 and S&P SmallCap 600 continues to underwhelm. Even so, new highs are still outpacing new lows and this is enough to keep the uptrend since late March going.
The first chart...
READ MORE
MEMBERS ONLY
A Secret Buy Signal
by Geoff Bysshe,
Co-founder and President, MarketGuage.com
Today was the first time that the SPY opened lower than the prior day's low since July 24th. The same is true for the QQQ. Grandpa Russell did it just last week, but not since July 7th prior to that.
The significance of this pattern is twofold:
1....
READ MORE
MEMBERS ONLY

TESTING PROCESS CONTINUES FOR S&P 500 -- ANOTHER LOOK AT BOLLINGER BANDS
by John Murphy,
Chief Technical Analyst, StockCharts.com
S&P 500 STILL HASN'T CLEARED FEBRUARY INTRA-DAY HIGH... The news media has been quick to declare a new record high in the S&P 500. However, we may not be there just yet. The SPX did hit a new closing high. The February intra-day high,...
READ MORE
MEMBERS ONLY

Trains Trump Planes!
by Julius de Kempenaer,
Senior Technical Analyst, StockCharts.com
Last Tuesday in Sector Spotlight, I covered the Industrials sector. While looking into the constituents of the sector and the group breakdown, it was pretty clear that the group "airlines" is not doing very well.
UAL, DAL and LUV are all inside the improving quadrant, but they also...
READ MORE
MEMBERS ONLY
The Fed: Friend or Foe?
by Geoff Bysshe,
Co-founder and President, MarketGuage.com
With so much attention being paid to AAPL reaching a valuation of $2 trillion, I decided to see if AAPL's market cap would make it into the IMF's list of the world's richest countries based on GDP.
In fact, it does! Can you guess...
READ MORE
MEMBERS ONLY

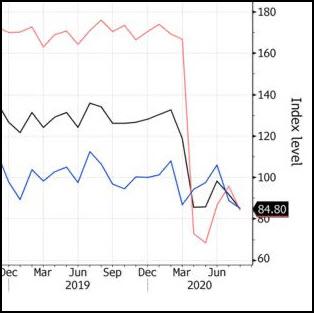
Dollar Bear to Take a Breather?
by Martin Pring,
President, Pring Research
* The Bear Market Case
* Time for a Counter-Cyclical Rally?
The Bear Market Case
By most methods and approaches, the Dollar Index is in a bear market. Take Chart 1, for instance, which compares the Index to its long-term KST. The pink-shaded areas tell us when it is below its 12-month...
READ MORE
MEMBERS ONLY

The Bull Market Top Checklist: What Would Change My Mind?

by David Keller,
President and Chief Strategist, Sierra Alpha Research
The last five months of market history are a blur for me. Back in mid-March, the S&P 500 was in free fall with no end in sight. Here we are in mid-August, and the S&P is retesting all-time highs. Trend-following is about defining the trend, recognizing...
READ MORE
MEMBERS ONLY

IPOs are Still the Next Big Thing
by Dave Landry,
Founder, Sentive Trading, LLC
"Let's make hay while the sun shines." - Dave Landry
The market is trending and in this situation, the trend following system works well. In this edition of Trading Simplified, Dave walks through Mystery Charts to show how his systems and breakout systems work well with...
READ MORE
MEMBERS ONLY

Here Are The Biggest Concerns I Have Heading Into My Quarterly "Draft Day"
by Tom Bowley,
Chief Market Strategist, EarningsBeats.com
At EarningsBeats.com, we announce the portfolio stocks for each of our 4 portfolios on February 19th, May 19th, August 19th and November 19th. We then hold those 10 equal-weighted stocks in each portfolio until it's time to announce new stocks.
Well, it's August 19th. It&...
READ MORE
MEMBERS ONLY

Amazon.com (AMZN) Makes a Delivery to Investors - A Continuation Pattern Breakout
by Tom Bowley,
Chief Market Strategist, EarningsBeats.com
After an uptrend, I always look for a continuation pattern, especially when I believe we're in a major secular bull market advance. Well, look no further than Amazon.com (AMZN), which doubled in price from its March low to its early-July high. Since that stunning advance, AMZN had...
READ MORE
MEMBERS ONLY

Blowout Earnings Report in WMT Benefits its Competition
by Geoff Bysshe,
Co-founder and President, MarketGuage.com
There were several market messages in today's price action. Starting from the top...
The SPY finally closed at an all-time higha nd, after what seems like weeks of anticipating this moment, it closed over the level by fractions of a percent and a doji pattern. This follows a...
READ MORE
MEMBERS ONLY

FALLING DOLLAR BOOSTS COMMODITIES -- PRECIOUS METALS REBOUND -- COPPER CONTINUES TO GAIN -- COMMODITY INDEX CLEARS 200-DAY AVERAGE
by John Murphy,
Chief Technical Analyst, StockCharts.com
DOLLAR INDEX HITS ANOTHER LOW... The greenback continues its decline to the lowest level in nearly two years. Chart 1 shows the Invesco US Dollar Bullish Fund (UUP) falling to another multi-year low today. And it's falling against all of its major trading partners. As is normally the...
READ MORE