MEMBERS ONLY
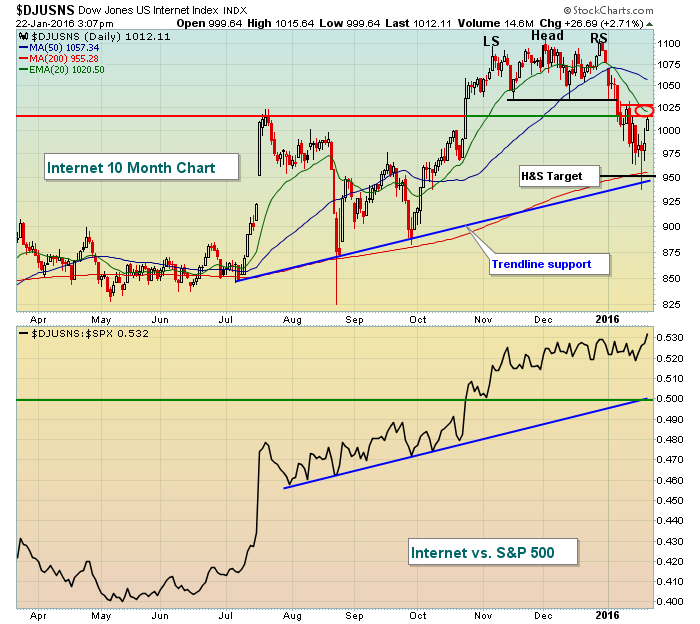
When Will Internet Stocks Lose Their Connection?

by Tom Bowley,
Chief Market Strategist, EarningsBeats.com
Much of the bull market was led higher by technology, particularly the Dow Jones U.S. Internet Index. So after the 2016 head & shoulders and long-term price breakdown, where might the current rally stall? The 1015-1025 range has proven in the past to be quite significant. Therefore, as prices...
READ MORE
MEMBERS ONLY
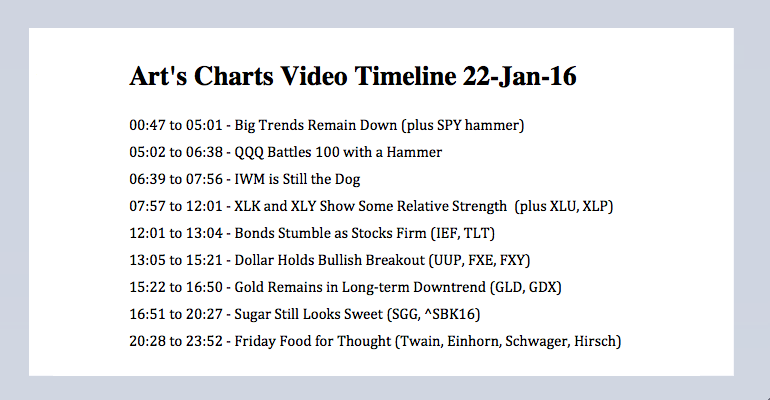
IWM Continues to Lag - QQQ and XLK form Big Hammers - Dollar-Gold-Sugar

by Arthur Hill,
Chief Technical Strategist, TrendInvestorPro.com
Big Trends Remain Down // IWM is Still the Dog // QQQ Battles 100 with a Hammer // XLK and XLY Show Some Relative Strength // Bonds Stumble as Stocks Firm // Dollar Holds Bullish Breakout // Gold Remains in Long-term Downtrend // Sugar Still Looks Sweet // Friday Food for Thought ////
Big Trends Remain Down
The bulk...
READ MORE
MEMBERS ONLY

Point and Figure Magic

by Bruce Fraser,
Industry-leading "Wyckoffian"
It is a little like magic when Point and Figure counts work out. Long term counts, short term counts, big counts and little counts; PnF is a robust and useful tool. Many Wyckoffians in training do not trust the counts. It seems to me this is because it is so...
READ MORE
MEMBERS ONLY

WOW! The 10th Tensile Trading ChartPack Update!

by Gatis Roze,
Author, "Tensile Trading"
This is the tenth update to the Tensile Trading ChartPack. When I look back at the initial version, let me just say I am astonished at how far we’ve come and how many improvements we’ve made over the past ten quarters. At this juncture, I think it’s...
READ MORE
MEMBERS ONLY
Futures Bright Green, How Long Will Rally Last?
by Tom Bowley,
Chief Market Strategist, EarningsBeats.com
Market Recap for Thursday, January 22, 2016
We saw some hesitation from small cap stocks ($RUT) to continue their relative surge from Wednesday, but other key aggressive areas of the market took over to provide hope of a continuing rally. First and foremost, however, the stock market gained relief from...
READ MORE
MEMBERS ONLY
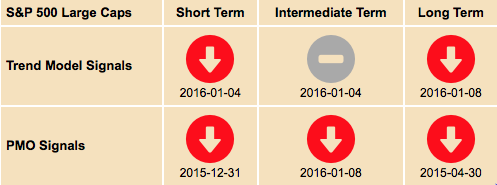
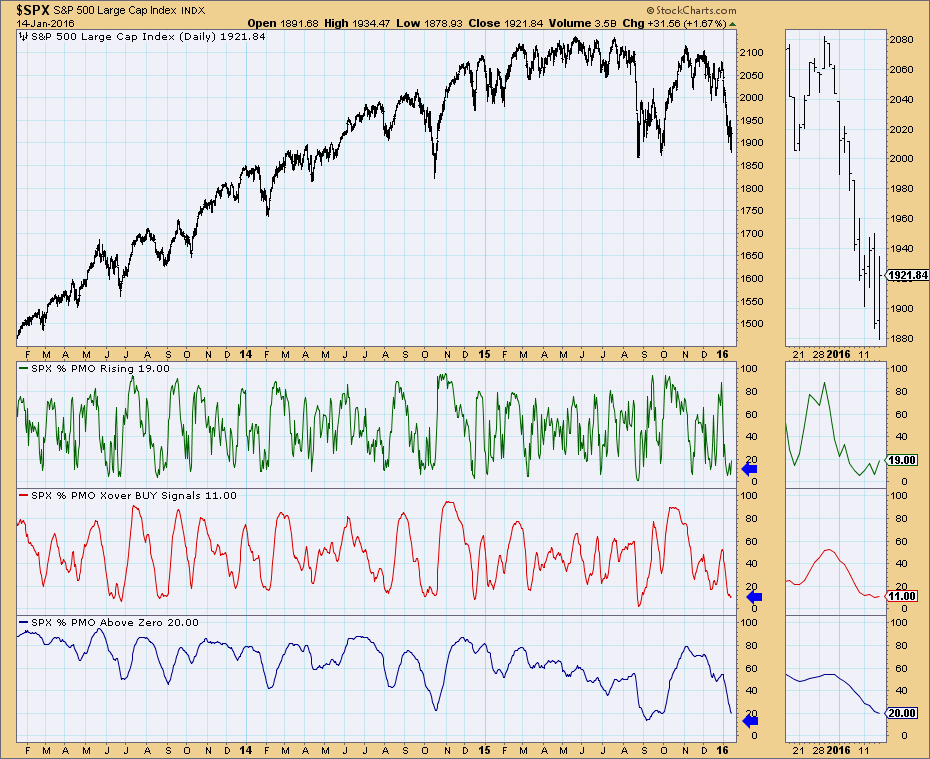
What Does a Neutral Signal Really Mean?

by Erin Swenlin,
Vice President, DecisionPoint.com
I'm asked frequently, especially now that we use the DecisionPoint Scoreboards, "What is a Neutral signal?" You'll see on the DecisionPoint Scoreboard for the S&P 500 (found in the DP Chart Gallery) that all sections are red except for the Intermediate-Term Trend...
READ MORE
MEMBERS ONLY
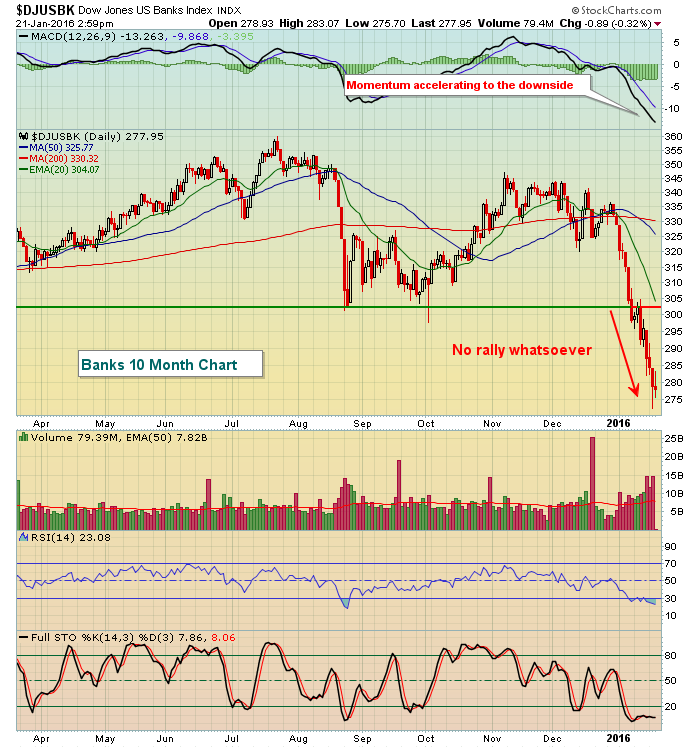
Traders Making Bank Withdrawal
by Tom Bowley,
Chief Market Strategist, EarningsBeats.com
Banks ($DJUSBK) cannot catch a bid. Despite the market's attempt at a rally (finally!), no one appears to be intrigued by bank prospects. We saw an afternoon rally on Wednesday and it's being followed up with a decent rally today on the heels of European Central...
READ MORE
MEMBERS ONLY
Understanding Bear Market Bounces, Patterns, Signals and Retracements
by Arthur Hill,
Chief Technical Strategist, TrendInvestorPro.com
Candles Show Firming, but Closes say Otherwise // Trading Counter-trend Patterns and Signals in Bear Markets // Using Retracements to Anticipate Counter-trend Peaks // Understanding ZigZag Extensions ////
Candles Show Firming, but Closing Prices say Otherwise
There is certainly a lot of chatter concerning Wednesday's intraday reversal. The S&P 500...
READ MORE
MEMBERS ONLY
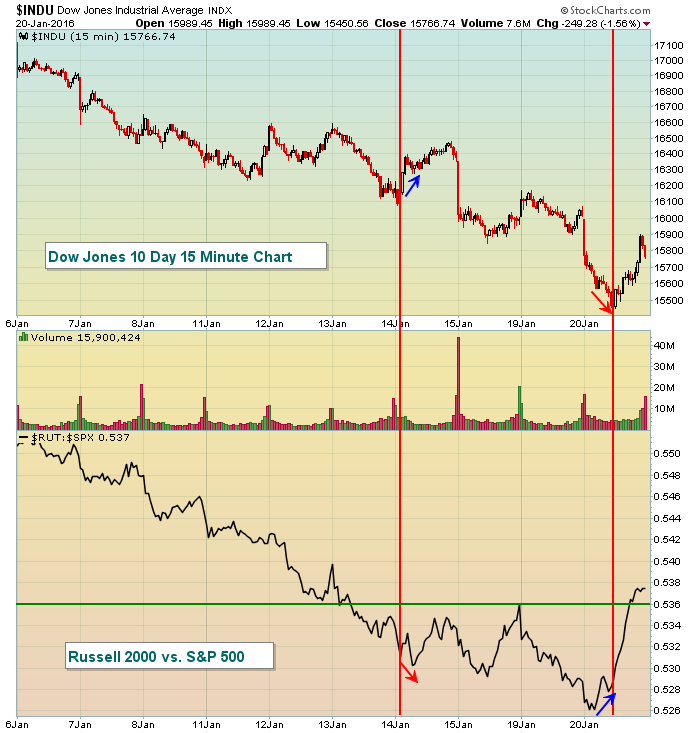
Russell 2000 Reverses, ECB President Draghi Lifts Futures
by Tom Bowley,
Chief Market Strategist, EarningsBeats.com
Market Recap for Wednesday, January 20, 2016
The U.S. stock market finally had a day where traders decided enough was enough and they scurried into aggressive parts of the market. Even the 228 point gain on the Dow Jones Thursday, January 14th wasn't as impressive under the...
READ MORE
MEMBERS ONLY

Trolling For Bottom Fishing Indicators

by Martin Pring,
President, Pring Research
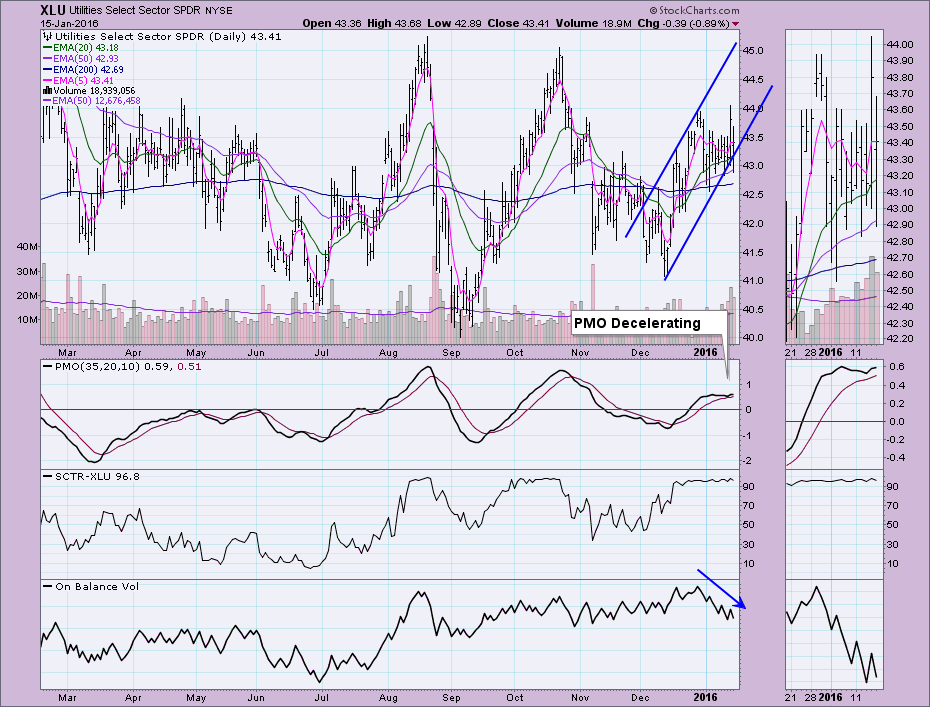
* Dow Jones Utility Average just above its secular up trendline
* 2-year yield probably gave a false upside breakout signal
* Three indicators to watch for an intermediate equity bottom
Yesterday at the webinar Greg asked me a question that was posed by one of the attendees relating to a potential reverse...
READ MORE
MEMBERS ONLY
Rotation Turns Very Bullish This Afternoon
by Tom Bowley,
Chief Market Strategist, EarningsBeats.com
But will it last?
I'll be back in the morning with my normal blog article, but wanted to point out that major reversals are taking place this afternoon in terms of rotation. The 10 year treasury yield ($TNX) has reversed in a key support zone from 1.90%...
READ MORE
MEMBERS ONLY

GLOBAL SELLOFF CONTINUES -- CRUDE OIL NEARS $25 -- CRB INDEX DROPS TO LOWEST LEVEL SINCE EARLY 1970S WHICH IS DEFLATIONARY -- TREASURY ETF BREAKS OUT TO UPSIDE AS YIELD FALLS BELOW 2%

by John Murphy,
Chief Technical Analyst, StockCharts.com
LONG-TERM LOOK AT CRUDE... The price of crude oil continues to drop and is bringing global stocks down with it. The monthly bars in Chart 1 show how bad the decline has been and where it appears headed. The recent decline pushed WTIC Light Crude Oil below its early 2009...
READ MORE
MEMBERS ONLY
Gold Surges as Market Swoons, but Miners remain Weak
by Arthur Hill,
Chief Technical Strategist, TrendInvestorPro.com
The Gold SPDR (GLD) and the Silver ETF (SLV) continue to attract money as alternatives to stocks and other commodities. GLD and SLV were down rather sharply in 2015, but both are up year-to-date in 2016. GLD is up over 4% and SLV is up just over 2%. In contrast,...
READ MORE
MEMBERS ONLY

Article Summaries 9-2015 to 11-2015

by Greg Morris,
Veteran Technical Analyst, Investor, and Author
Most blog authors on StockCharts.com are writing about the current markets and do an exceptional job. I do not write about the current markets as I want to share my experiences after 40+ years as a technical analyst. Not only experiences with trading and investing, but model building and...
READ MORE
MEMBERS ONLY
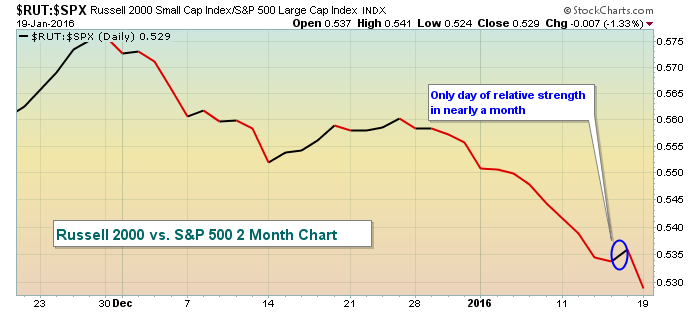
Russell 2000 Sending Ominous Signal; Futures Again Under Pressure
by Tom Bowley,
Chief Market Strategist, EarningsBeats.com
Market Recap for Tuesday, January 19, 2016
Coming off the long holiday weekend, U.S. futures were poised to try to reverse the ugly behavior of equities thus far in 2016. And they did - for roughly 60 seconds. In just another awful performance for equities, the Russell 2000 once...
READ MORE
MEMBERS ONLY
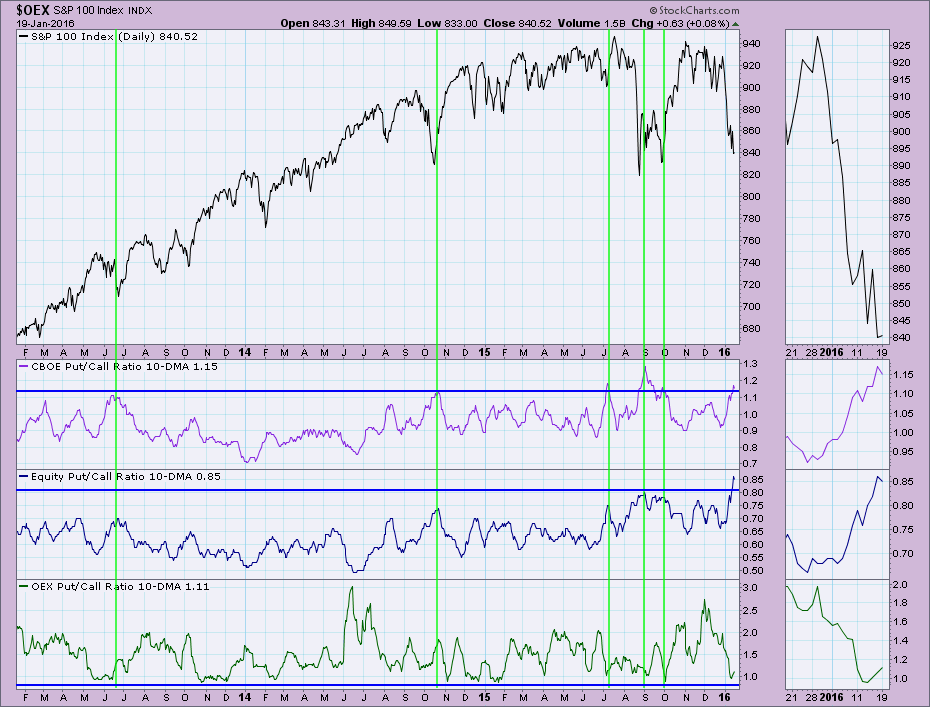
Put/Call Ratio 10-DMA Bullish
by Erin Swenlin,
Vice President, DecisionPoint.com
DecisionPoint with StockCharts.com offer numerous ready-to-go indicators and charts. The easiest way to observe them is by downloading the DecisionPoint Market Indicators ChartPack. One of the ChartLists that I hadn't visited in some time was the DPMI - 1300 Put/Call Ratio, particularly the 10-DMA of the...
READ MORE
MEMBERS ONLY
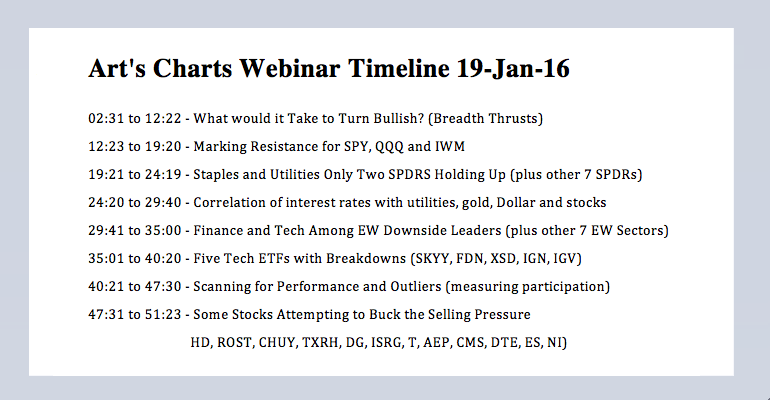
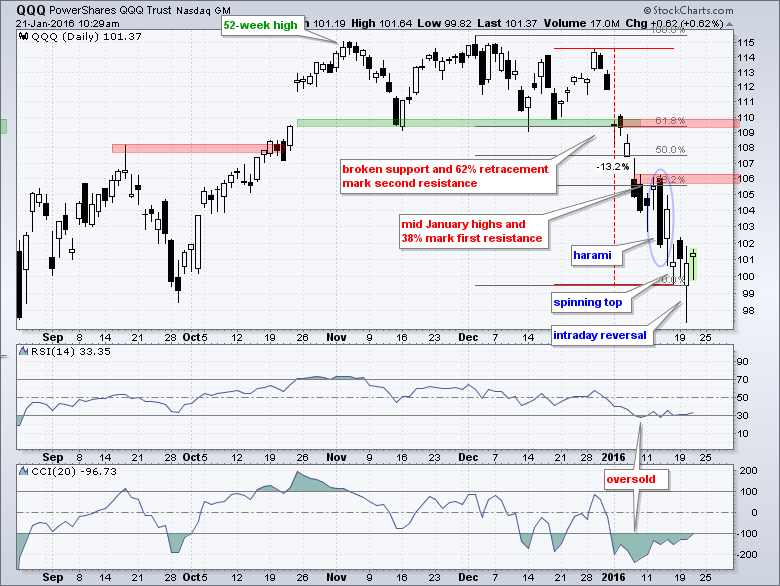
Why Bearish and What would it Take to Turn Bullish Again? - Webinar Video
by Arthur Hill,
Chief Technical Strategist, TrendInvestorPro.com
SPY Sets up Oversold Bounce // QQQ Firms with Spinning Top // What Would it take to Turn Bullish? // Finance and Tech Among the Downside Leaders // Webinar Highlights //// SPY Sets up Oversold Bounce // QQQ Firms with Spinning Top // What Would it take to Turn Bullish? // Finance and Tech Among the Downside Leaders...
READ MORE
MEMBERS ONLY
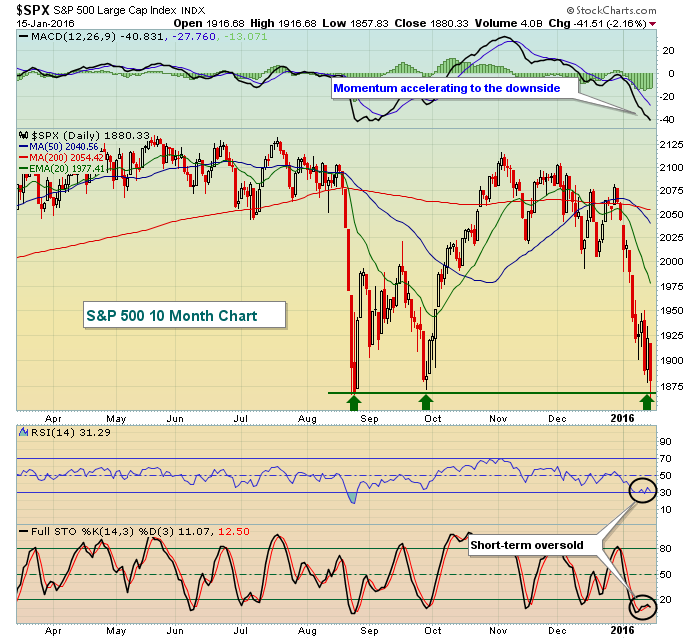
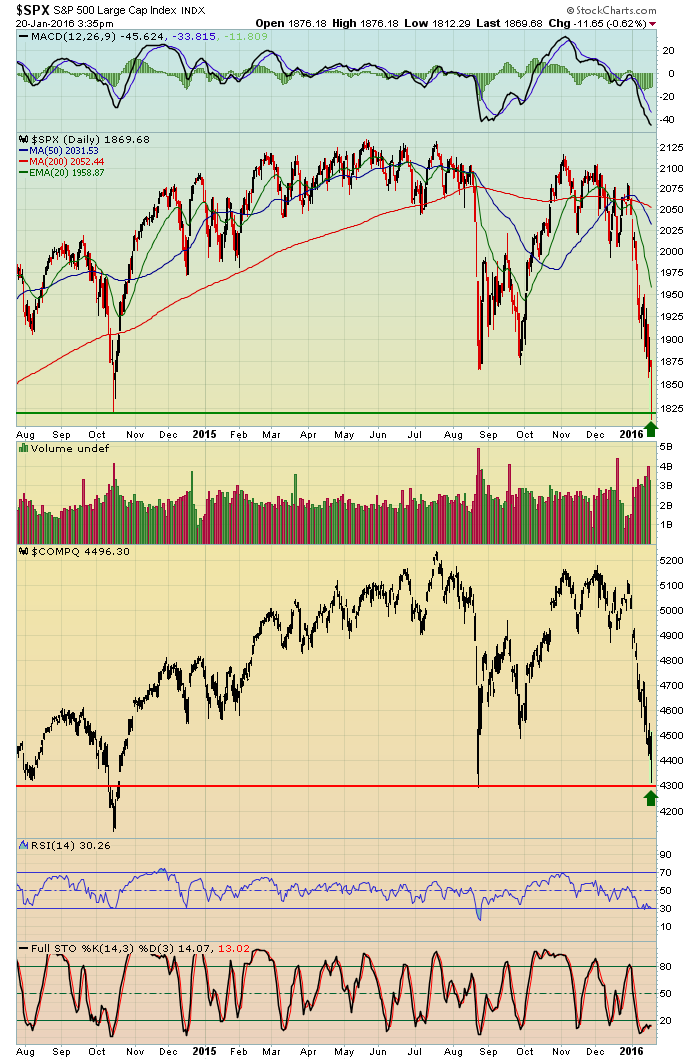
S&P 500 Holds August Lows, Futures Soaring
by Tom Bowley,
Chief Market Strategist, EarningsBeats.com
Market Recap for Friday, January 15, 2016
After last Friday's rout to sustain the recent hemorrhaging of the U.S. stock market, one positive developed. The August low close of 1867.61 held. Friday's intraday low was 1857.83 so the bears had an opportunity to...
READ MORE
MEMBERS ONLY
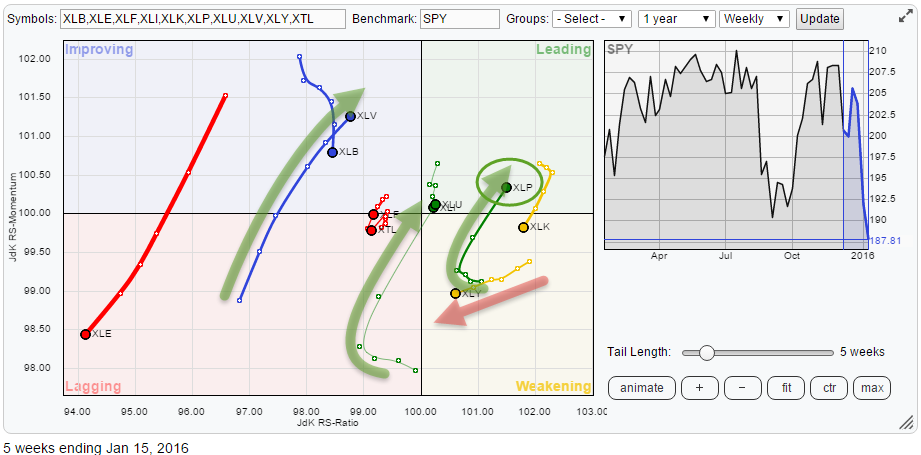
Picking stocks inside XLP

by Julius de Kempenaer,
Senior Technical Analyst, StockCharts.com
The sector rotation inside the S&P 500 index is getting more and more pronounced.
The Relative Rotation Graph holding the sector ETFs that make up the entire S&P 500 index clearly shows the recent improvement for Health Care (XLV), Utilities (XLU) and Consumer Staples (XLP). I...
READ MORE
MEMBERS ONLY
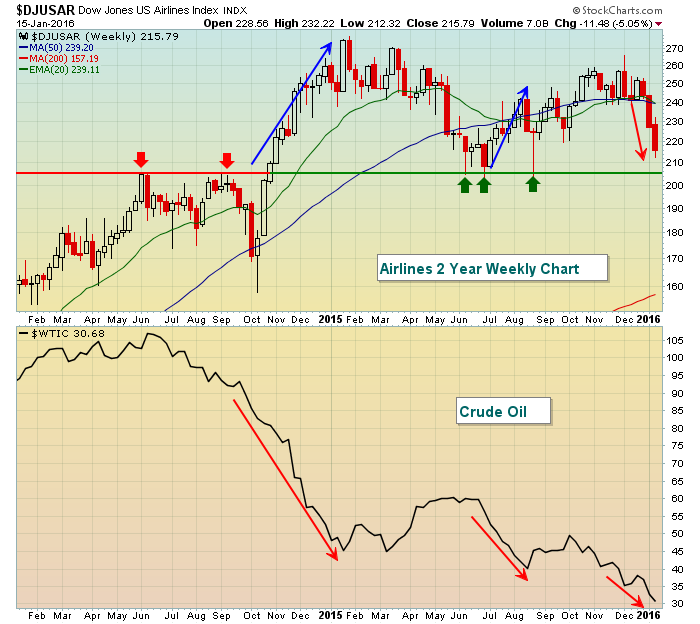
Airlines Approaching Key Support Despite Low Crude Oil Prices
by Tom Bowley,
Chief Market Strategist, EarningsBeats.com
It would seem logical that falling crude oil prices ($WTIC) would help propel airlines ($DJUSAR) higher and rising crude oil prices would have the opposite effect. In the second half of 2014 and into early 2015, that was the case. The same scenario developed over the summer of 2015. More...
READ MORE
MEMBERS ONLY
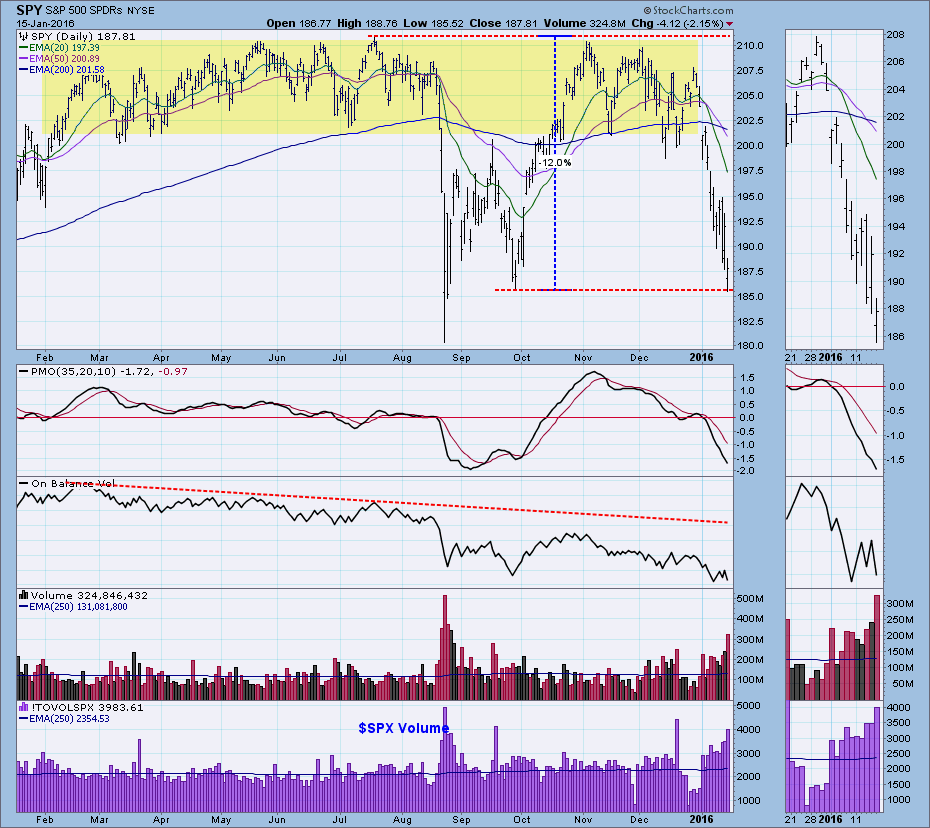
Is the Market Oversold Enough Yet?

by Carl Swenlin,
President and Founder, DecisionPoint.com
It was an unbelievably choppy week, with Friday delivering a stunning reversal from the strong advance of the previous day. Intraday SPY was down -12% from its all-time high last July, and with Friday's intraday low, SPY may have found support at the September low. The market is...
READ MORE
MEMBERS ONLY
Last Sectors Standing
by Erin Swenlin,
Vice President, DecisionPoint.com
If you go to our DP Reports blog and take a gander at the DecisionPoint Market/Sector Summary, you'll find there are only two sectors left with BUY signals. I'll give you a moment to guess which ones. Those of you familiar with John Murphy'...
READ MORE
MEMBERS ONLY

Secrets of Point and Figure Distribution
by Bruce Fraser,
Industry-leading "Wyckoffian"
The procedure for the horizontal PnF counting of Distribution follows the same logic as counting Accumulation. A cause is built during Accumulation and Distribution that results in a trend. Point and Figure chart construction allows us to estimate the extent of a trend. This adds a powerful tactical tool to...
READ MORE
MEMBERS ONLY
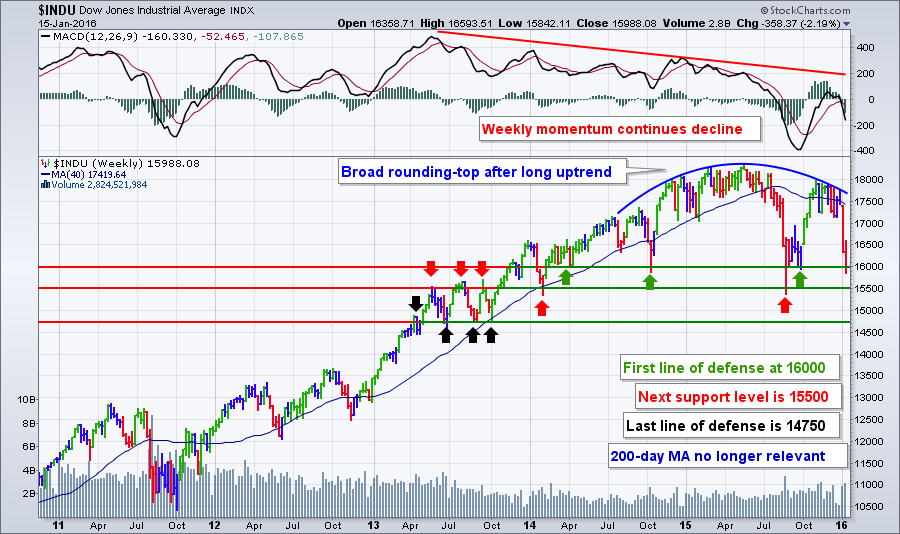
The One Where a 4-month Setback Freaks Everyone Out
Hello Fellow ChartWatchers!
It was "back to the future" time for the markets this week with the Dow falling over 350 points and ending up just below 16,000. This has caused lots of consternation and teeth-gnashing in the mainstream financial press, but let's back up...
READ MORE
MEMBERS ONLY
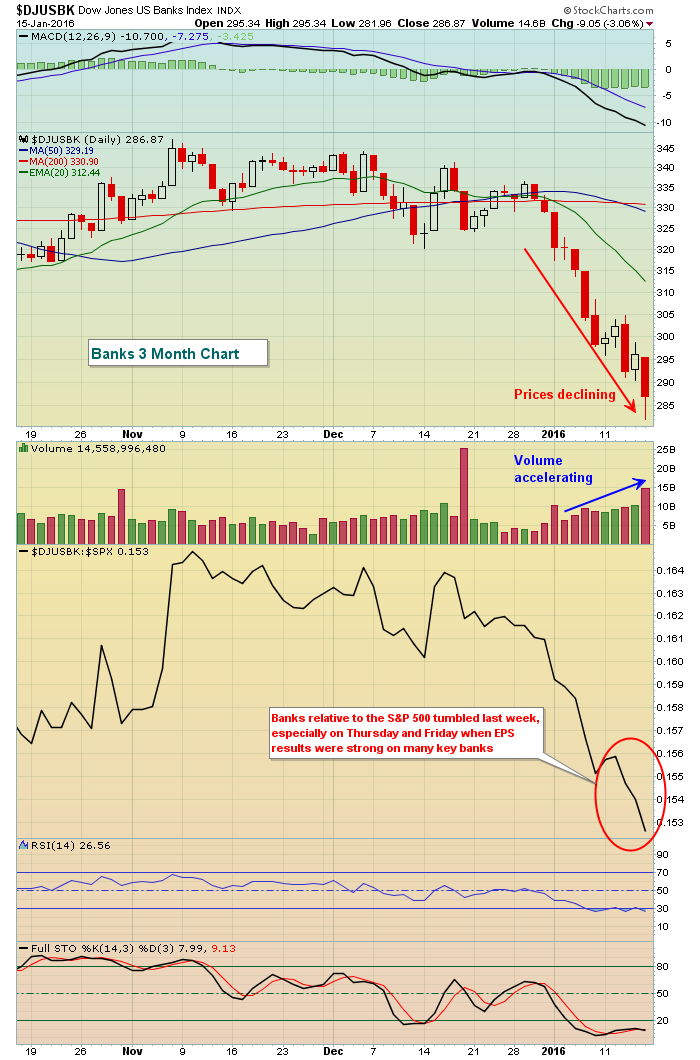
Banks Lose Two Year Support Despite Solid Results
by Tom Bowley,
Chief Market Strategist, EarningsBeats.com
Technical analysis doesn't try to answer why questions. Fundamentalists are constantly bewildered by price action, especially when it seems to contradict fundamental news. Technicians simply don't care. The stock market looks ahead and therefore price action precedes news. That's why it's important...
READ MORE
MEMBERS ONLY
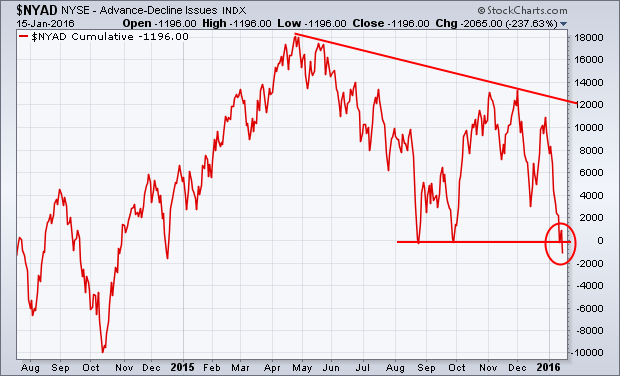
Advance-Decline Turns Down, Foreign Markets Already Bearish
by John Murphy,
Chief Technical Analyst, StockCharts.com
A lot of us on this site have been warning about the fact that the fourth quarter rally was mainly driven by large cap stocks and wasn't being supported by the vast majority of stocks. That's been shown by breakdowns in small and midsize stocks and...
READ MORE
MEMBERS ONLY

U.S. STOCK INDEXES THREATEN 2015 LOWS -- WHAT HAPPENS IF THEY DON'T HOLD -- THE S&P 500 COULD LOSE ANOTHER 10-12% AND DROP TOWARD 1600 -- NYSE ADVANCE DECLINE LINE TURNS DOWN -- INDEX OF FOREIGN STOCKS IS IN BEAR MARKET
by John Murphy,
Chief Technical Analyst, StockCharts.com
U.S. STOCK INDEXES THREATEN 2015 LOWS ... Another week of heavy selling has pushed major U.S. stock indexes into a critical test of their 2015 lows. The first three charts tell the story. Chart 1 shows the Dow Industrials ending the week just above its late September intra-day low...
READ MORE
MEMBERS ONLY
Will Earnings Matter?

by John Hopkins,
President and Co-founder, EarningsBeats.com
Earning's season will kick into high gear this week and trader's are wondering how much they will matter after the market slaughter already experienced this year. Since this is the worst start to a year for stocks it's a legitimate question.
Let's...
READ MORE
MEMBERS ONLY
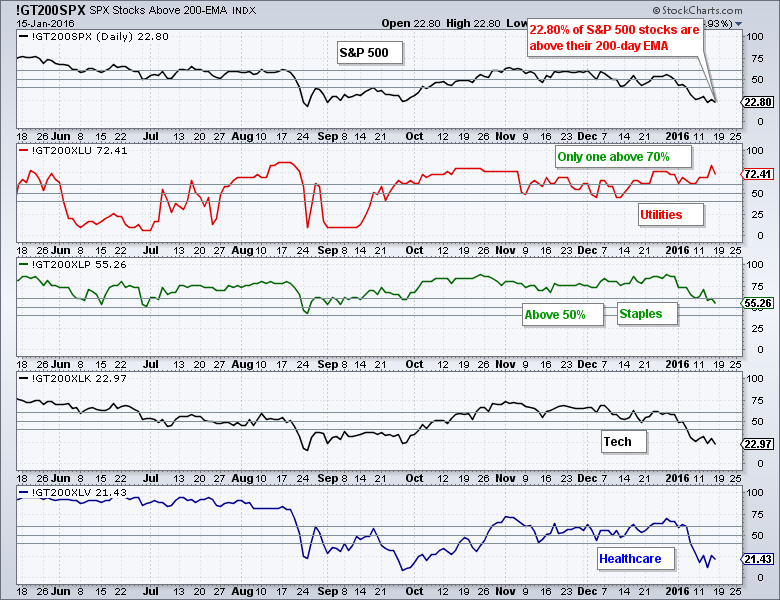
Using %Above 200-day to Rank Sectors and Define the Market Environment
by Arthur Hill,
Chief Technical Strategist, TrendInvestorPro.com
Chartists can use the percentage of stocks above the 200-day EMA to rank the sectors based on component trends. Using this breadth indicator, we can separate the weak sectors from the strong and get a good idea of the current market environment. I am working under the assumption that a...
READ MORE
MEMBERS ONLY

What I Learned from 30,874 Trades
by Gatis Roze,
Author, "Tensile Trading"
Thomas Edison said “Vision without execution is hallucination.” Real estate experts love to claim that success is based on “location, location, location.” For his recent book, The Art of Execution (Harriman House 2015), Lee Freeman-Shor analyzed over 30,000 trades by 45 professional investors and concluded that success in the...
READ MORE
MEMBERS ONLY
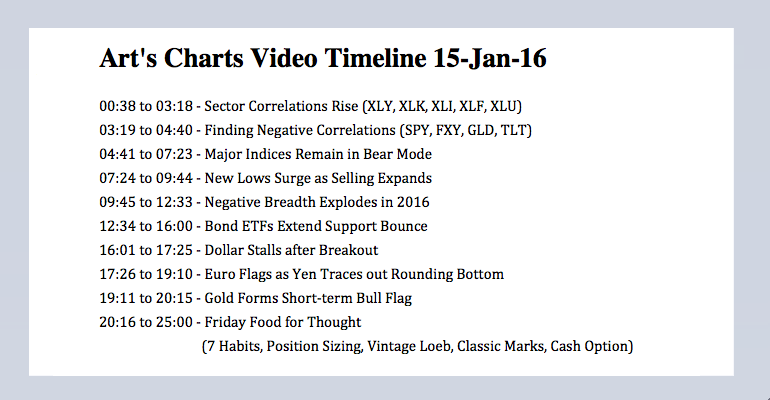
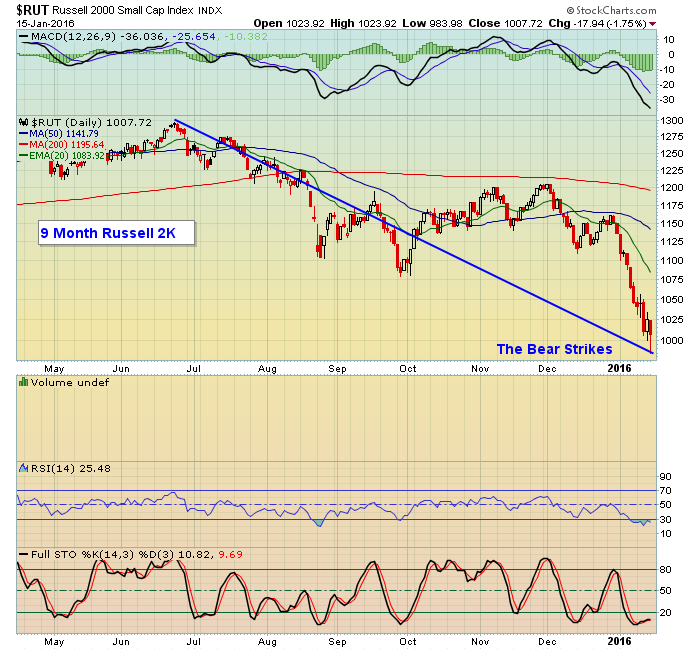
Finding Negative Correlations - Bonds and Yen Surge - Friday Food for Thought
by Arthur Hill,
Chief Technical Strategist, TrendInvestorPro.com
Finding Negative Correlations // Major Indices Remain in Bear Mode // New Lows Surge as Selling Expands // Bond ETFs Extend Support Bounce // Dollar Stalls after Breakout // Yen Traces out Rounding Bottom // Gold Forms Short-term Bull Flag // Friday Food for Thought ////
Finding Negative Correlations
Stocks were hammered again on Friday morning as the...
READ MORE
MEMBERS ONLY
Oil, China Drop; U.S. Futures Tanking AGAIN
by Tom Bowley,
Chief Market Strategist, EarningsBeats.com
Note: Two quick reminders. First, if you haven't already, please subscribe to my blog. By doing so, my blog articles will be sent directly to your email upon publishing. You'll receive my article the moment it's published. It's easy and it'...
READ MORE
MEMBERS ONLY
Evaluating Bullish Scan Results in a Bear Market
by Erin Swenlin,
Vice President, DecisionPoint.com
First, I am not encouraging anyone to buy stocks in a bear market. If you are evaluating investments in a bear market, you do need to keep a few things in mind. In a bear market the majority of stocks are in decline (hence it being a bear market). Check...
READ MORE
MEMBERS ONLY
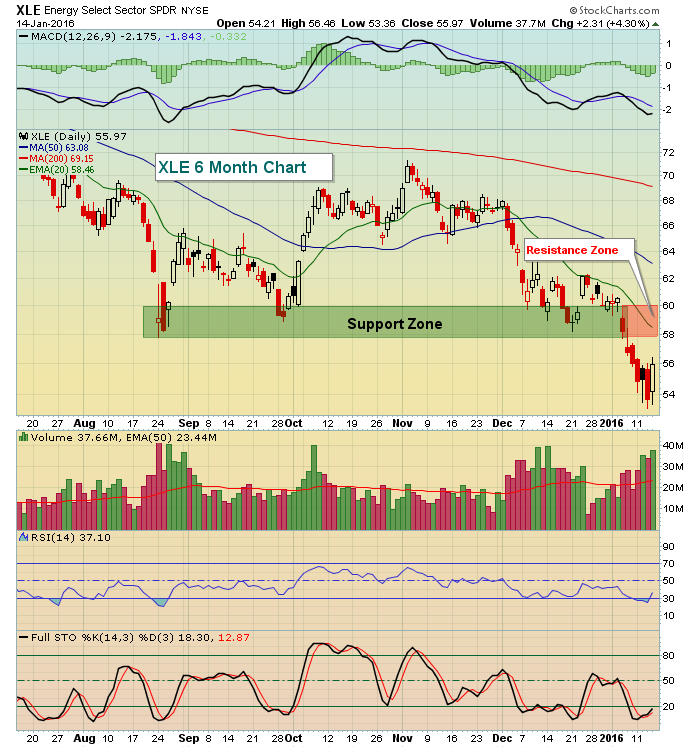
Energy Ignites U.S. Equity Rally
by Tom Bowley,
Chief Market Strategist, EarningsBeats.com
It's no secret that crude oil prices ($WTIC) have been tumbling over the past 18 months, but that has kept tremendous pressure on energy-related shares and the energy ETF (XLE). Crude oil managed to close back above $31 per barrel with the Dow Jones U.S. Pipelines Index...
READ MORE
MEMBERS ONLY
Measuring Stock, Economic and Credit Risk - Negativity Abounds - Stress Index Holds Up
by Arthur Hill,
Chief Technical Strategist, TrendInvestorPro.com
High Beta Stocks Versus High Quality Stocks // Equal-weight versus Large-caps // Small-caps versus Mega-caps // Charting the Economy with Four ETFs // Junk versus Investment Grade and Treasuries // TED Spread Surges // Charting the Financial Stress Index // Conclusions ////
Introduction
Measuring the risk appetite in the financial markets can help investors with their portfolio allocations....
READ MORE
MEMBERS ONLY
How To Approach A Technically Broken Market?
by Tom Bowley,
Chief Market Strategist, EarningsBeats.com
Market Recap for Wednesday, January 13, 2016
What a mess. Money has been rotating toward defense for months and now we know why. Because market participants want nothing to do with risk right now. Last year, the sectors attracting sellers were energy (XLV) and materials (XLB). Those two groups held...
READ MORE
MEMBERS ONLY

Deficient Frontier
by Greg Morris,
Veteran Technical Analyst, Investor, and Author
It is almost impossible to see any performance comparisons that not only show a benchmark, but also show a mix of 60% equity and 40% fixed income, known as 60/40 in the fund industry. The Efficient Frontier is one of those terms that came from a theory developed decades...
READ MORE
MEMBERS ONLY

What Happens If The Fed Is Wrong
by Martin Pring,
President, Pring Research
* Erie comparisons to 1929
* Credit spreads worsen
* 30-year bond yields break down prices break out
When the fed raises interest rates after a long series of declines it usually signals a change in policy and the start of a new trend to higher rates. What happens, though, when the Fed...
READ MORE
MEMBERS ONLY
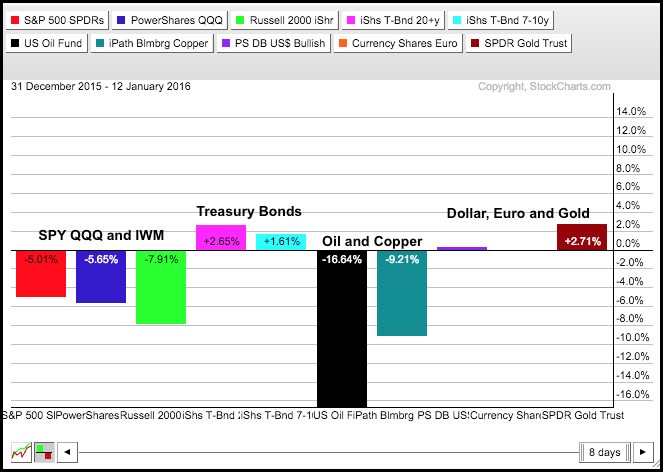
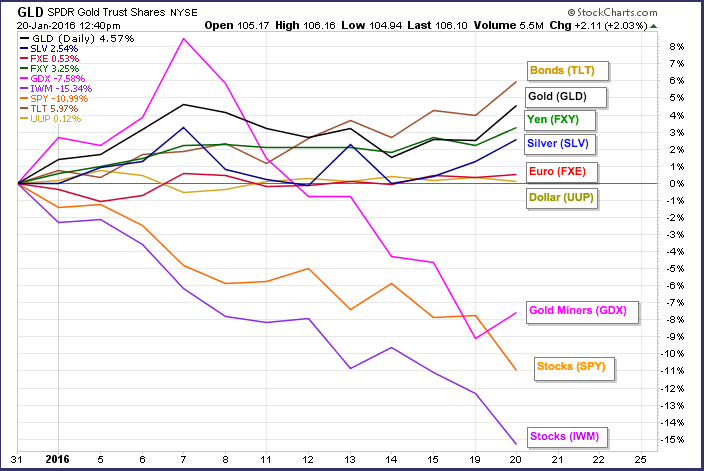
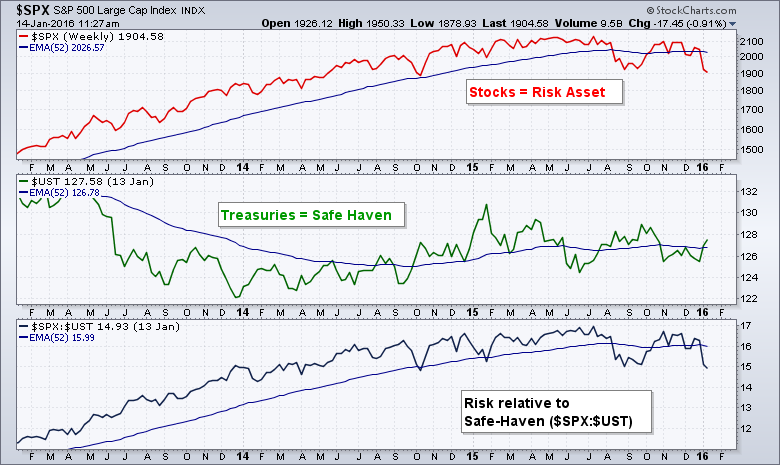
Gold, Dollar and Bonds Lead in 2016
by Arthur Hill,
Chief Technical Strategist, TrendInvestorPro.com
The year is young, but we are already seeing money move from relative risk (stocks) to relative safety (bonds). The PerfChart below shows the performance for ten intermarket ETFs year-to-date (12 January close). The histogram format makes it easy to spot the winners and the losers. The USO Oil Fund...
READ MORE
MEMBERS ONLY

AUTO PARTS AND RAILS LEAD MARKET LOWER -- BORGWARNER HITS THREE-YEAR LOW -- CSX AND UAL LEAD TRANSPORTS LOWER -- TREASURIES CONTINUE TO GAIN AS STOCKS SINK -- FALLING YIELDS, HOWEVER, ARE HURTING BANKS -- S&P 500 NEARS TEST OF 2015 LOW
by John Murphy,
Chief Technical Analyst, StockCharts.com
AUTO PARTS LEAD CYCLICALS LOWER... A week ago Tuesday (January 5), I showed a chart of General Motors falling below its 200-day moving while autos were leading the Consumer Discretionary SPDR lower. Today, the main drag on that sector is auto parts. Chart 1 shows the Dow Jones US Auto...
READ MORE
