MEMBERS ONLY

Tariff Shock Spurs "Buy-the-Dip" Setups in Tesla and ON Semiconductor

by Jayanthi Gopalakrishnan,
Director of Site Content, StockCharts.com
Just when we thought tariff talk had gone quiet, it's back on center stage. With the reciprocal tariff deadline landing this Wednesday, President Trump has mailed out notices that new duties will kick in on August 1. Countries such as Japan, South Korea, Malaysia, and Kazakhstan face a...
READ MORE
MEMBERS ONLY

The Best Five Sectors, #26

by Julius de Kempenaer,
Senior Technical Analyst, StockCharts.com
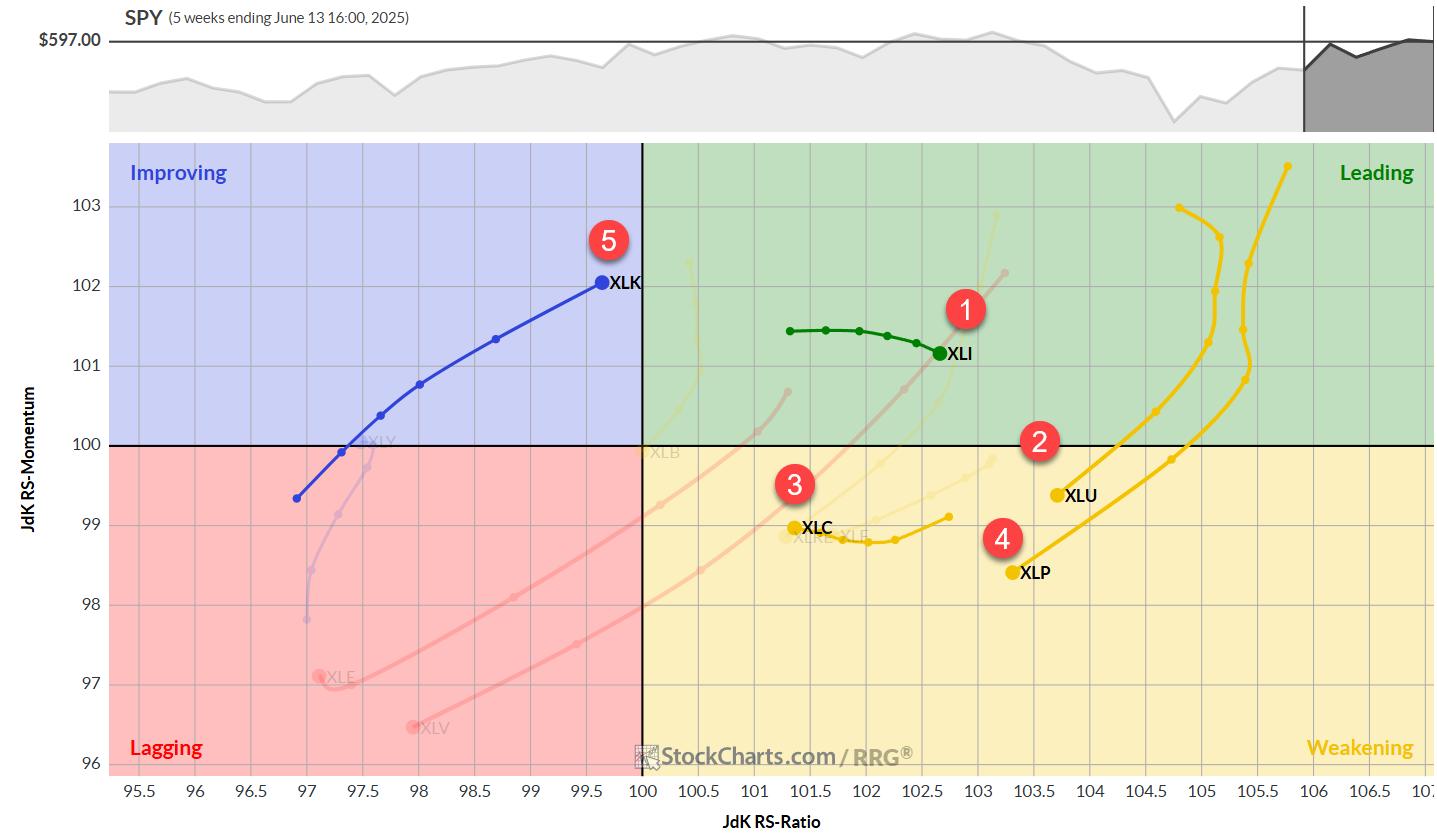
The past week has been relatively stable in terms of sector rankings, with no new entrants or exits from the top five. However, we're seeing some interesting shifts within the rankings that warrant closer examination. Let's dive into the details and see what the Relative Rotation...
READ MORE
MEMBERS ONLY

Should You Buy Roblox Stock Now? Key Levels to Watch

by Karl Montevirgen,
The StockCharts Insider
Roblox Corporation (RBLX), the company behind the immersive online gaming universe, has been on a strong run since April. This isn't the first time the stock demonstrated sustained technical strength: RBLX has maintained a StockCharts Technical Rank(SCTR) above 90, aside from a few dips, since last November....
READ MORE
MEMBERS ONLY

MACD Crossovers: Why Most Traders Get It Wrong

by Joe Rabil,
President, Rabil Stock Research
Joe presents a deep dive into MACD crossovers, demonstrating how to use them effectively across multiple timeframes, establish directional bias, and improve trade timing. He explains why price action should confirm indicator signals, sharing how to identify "pinch plays" and zero-line reversals for higher-quality setups. Joe then analyzes...
READ MORE
MEMBERS ONLY

Market Signals Align - Is a Bigger Move Ahead?

by Frank Cappelleri,
Founder & President, CappThesis, LLC
This week, Frank analyzes recent technical signals from the S&P 500, including overbought RSI levels, key price target completions, and the breakout potential of long-term bullish patterns. He examines past market breakouts and trend shifts, showing how overbought conditions historically play out. Frank also walks through a compelling...
READ MORE
MEMBERS ONLY

The Dollar Index Just Gave a Major Sell Signal - Does That Mean It's About to Implode?

by Martin Pring,
President, Pring Research
Last month, the Dollar Index triggered a number of sell signals confirming that it is in a bear market. Chart 1, for instance, shows that the red up trendline emanating in 2011 has been decisively ruptured, thereby pushing the Index further below its moving average. The Coppock Curve, seen in...
READ MORE
MEMBERS ONLY
Top 10 July 2025 Stock Picks You Shouldn't Miss

by Grayson Roze,
Chief Strategist, StockCharts.com
Join Grayson for a solo show as he reveals his top 10 stock charts to watch this month. From breakout strategies to moving average setups, he walks through technical analysis techniques using relative strength, momentum, and trend-following indicators. As a viewer, you'll also gain insight into key market...
READ MORE
MEMBERS ONLY

Tech Stocks Lead the Charge: What's Driving the Momentum?
by Jayanthi Gopalakrishnan,
Director of Site Content, StockCharts.com
The last day of trading for the first half of 2025 ended with a bang. The S&P 500 ($SPX) and Nasdaq Composite ($COMPQ) closed at record highs - an impressive finish, given the year has seen significant swings.
We saw signs of investors rotating into technology stocks last...
READ MORE
MEMBERS ONLY

Pullbacks & Reversals: Stocks Setting Up for Big Moves!

by Mary Ellen McGonagle,
President, MEM Investment Research
In this video, Mary Ellen spotlights key pullback opportunities and reversal setups in the wake of a strong market week, one which saw all-time highs in the S&P 500 and Nasdaq. She breaks down the semiconductor surge and explores the bullish momentum in economically-sensitive sectors, including software, regional...
READ MORE
MEMBERS ONLY

The Best Five Sectors, #25
by Julius de Kempenaer,
Senior Technical Analyst, StockCharts.com
A Greek Odyssey
First of all, I apologize for any potential delays or inconsistencies this week. I'm currently writing this from a hotel room in Greece, surrounded by what I can only describe as the usual Greek chaos. Our flight back home was first delayed, then canceled, then...
READ MORE
MEMBERS ONLY

3 Stock Setups for the Second Half of 2025

by Jay Woods,
Chief Global Strategist, Freedom Capital Markets
As we head into the second half of 2025, here are three stocks that present strong technical setups with favorable risk/reward profiles. One is the largest market cap stock we're familiar with, which bodes well for the market in general. The second is an old tech giant...
READ MORE
MEMBERS ONLY
Fibonacci Retracements: The Key to Identifying True Breakouts

by David Keller,
President and Chief Strategist, Sierra Alpha Research
If you've looked at enough charts over time, you start to recognize classic patterns that often appear. From head-and-shoulders tops to cup-and-handle patterns, they almost jump off the page when you bring up the chart. I would definitely include Fibonacci Retracements on that list, because before I ever...
READ MORE
MEMBERS ONLY
How to Improve your Trading Odds and Increase Opportunities

by Arthur Hill,
Chief Technical Strategist, TrendInvestorPro.com
Chartists can improve their odds and increase the number of opportunities by trading short-term bullish setups within bigger uptrends. The first order of business is to identify the long-term trend using a trend-following indicator. Second, chartist can turn to more granular analysis to find short-term bullish setups. Today's...
READ MORE
MEMBERS ONLY

NEW! 5 Significant Additions to Our Professionally-Curated Market Summary Dashboard
by Grayson Roze,
Chief Strategist, StockCharts.com
Take a tour of the FIVE latest updates and additions to our fan-favorite, professionally-curated Market Summary dashboard with Grayson!
In this video, Grayson walks viewers through the new charts and indexes that have been added to multiple panels on the page. These include mini-charts for the S&P sectors,...
READ MORE
MEMBERS ONLY

SMCI Stock Surges: How to Invest Wisely Now
by Jayanthi Gopalakrishnan,
Director of Site Content, StockCharts.com
Over a month ago, Super Micro Computer, Inc. (SMCI) appeared on our StockCharts Technical Rank(SCTR) Top 10 list. SCTRs are an exclusive StockCharts tool that can help you quickly find stocks showing strong technical strength relative to other stocks in a similar category.
Now, the stock market is dynamic,...
READ MORE
MEMBERS ONLY
From Drift to Lift: Spotting Breakouts Before Momentum Hits
by Joe Rabil,
President, Rabil Stock Research
MACD, ADX and S&P 500 action frame Joe Rabil's latest show, where a drifting index push him toward single-stock breakouts. Joe spotlights the daily and weekly charts of American Express, Fortinet, Parker-Hannifin, Pentair, and ServiceNow as showing strong ADX/MACD characteristics. He outlines how the patterns...
READ MORE
MEMBERS ONLY

Breakdown of NVDA's Stock Price and S&P 500: Actionable Technical Insights
by Frank Cappelleri,
Founder & President, CappThesis, LLC
The S&P 500 ($SPX) just logged its second consecutive 1% gain on Tuesday. That's three solid 1% advances so far in June. And with a few trading days remaining in the month, the index has recorded only one 1% decline so far.
A lot can still...
READ MORE
MEMBERS ONLY
How to Use Fibonacci Retracements to Spot Key Levels
by David Keller,
President and Chief Strategist, Sierra Alpha Research
Join Dave as he shares how he uses the power of Fibonacci retracements to anticipate potential turning points. He takes viewers through the process of determining what price levels to use to set up a Fibonacci framework, and, from there, explains what Fibonacci retracements are telling him about the charts...
READ MORE
MEMBERS ONLY

Never Easy to Predict, the Price of Crude Just Got Harder
by Martin Pring,
President, Pring Research
Earlier in the month, I wrote an article pointing out that gold and copper typically move ahead of oil. It's true, the leads and lags between these three entities differ from cycle to cycle. However, since gold momentum turned up in early 2023 and copper in early 2022,...
READ MORE
MEMBERS ONLY

Offense vs. Defense: How Geopolitical Tensions Shape Market Trends
by Karl Montevirgen,
The StockCharts Insider
As the cycle of uncertainty continues to yield confusion than clarity, investors are again caught having to decide between taking an offensive and defensive posture in the market. The tough part in today's market environment is how fast situations can shift. With headlines driving the action, sentiment can...
READ MORE
MEMBERS ONLY

This Week's Earnings Watch: Turnarounds and Momentum Plays
by Jay Woods,
Chief Global Strategist, Freedom Capital Markets
This week, we're keeping an eye on three major stocks that are reporting earnings. Two of them have been beaten down and are looking to turn things around, while the third has had a tremendous run and is looking to keep its extraordinary momentum going. Let's...
READ MORE
MEMBERS ONLY
The Best Five Sectors, #24
by Julius de Kempenaer,
Senior Technical Analyst, StockCharts.com
Some Sector Reshuffling, But No New Entries/Exits
Despite a backdrop of significant geopolitical events over the weekend, the market's reaction appears muted -- at least, in European trading. As we assess the RRG best five sectors model based on last Friday's close, we're...
READ MORE
MEMBERS ONLY

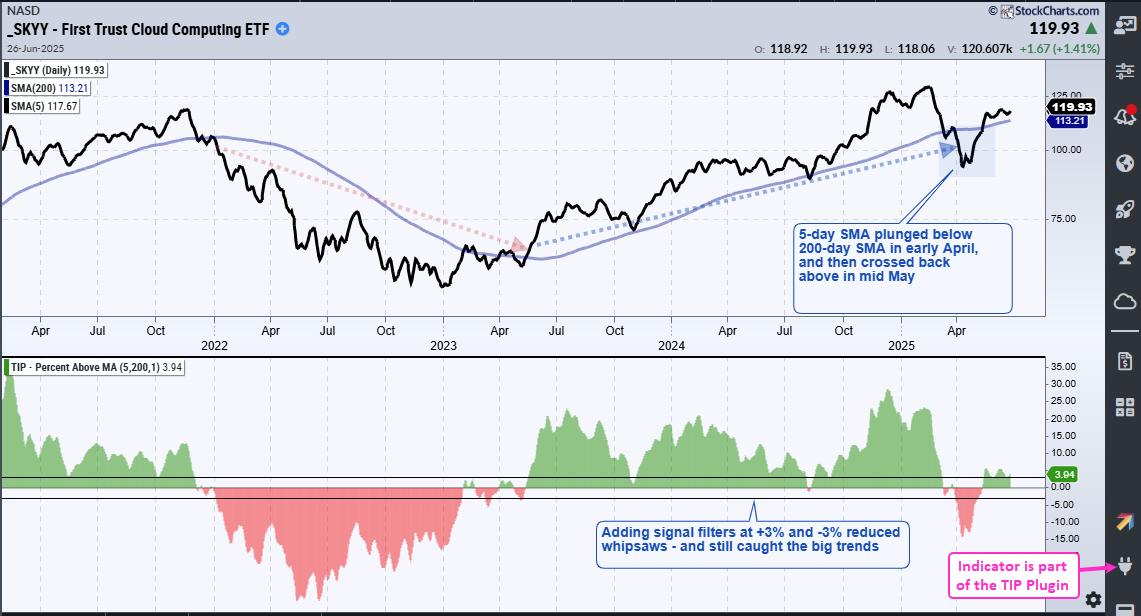
Lagging Mid-cap ETF Hits Moment of Truth
by Arthur Hill,
Chief Technical Strategist, TrendInvestorPro.com
The S&P MidCap 400 SPDR (MDY) is trading at a moment of truth as its 5-day SMA returns to the 200-day SMA. A bearish trend signal triggered in early March. Despite a strong bounce from early April to mid May, this signal remains in force because it has...
READ MORE
MEMBERS ONLY

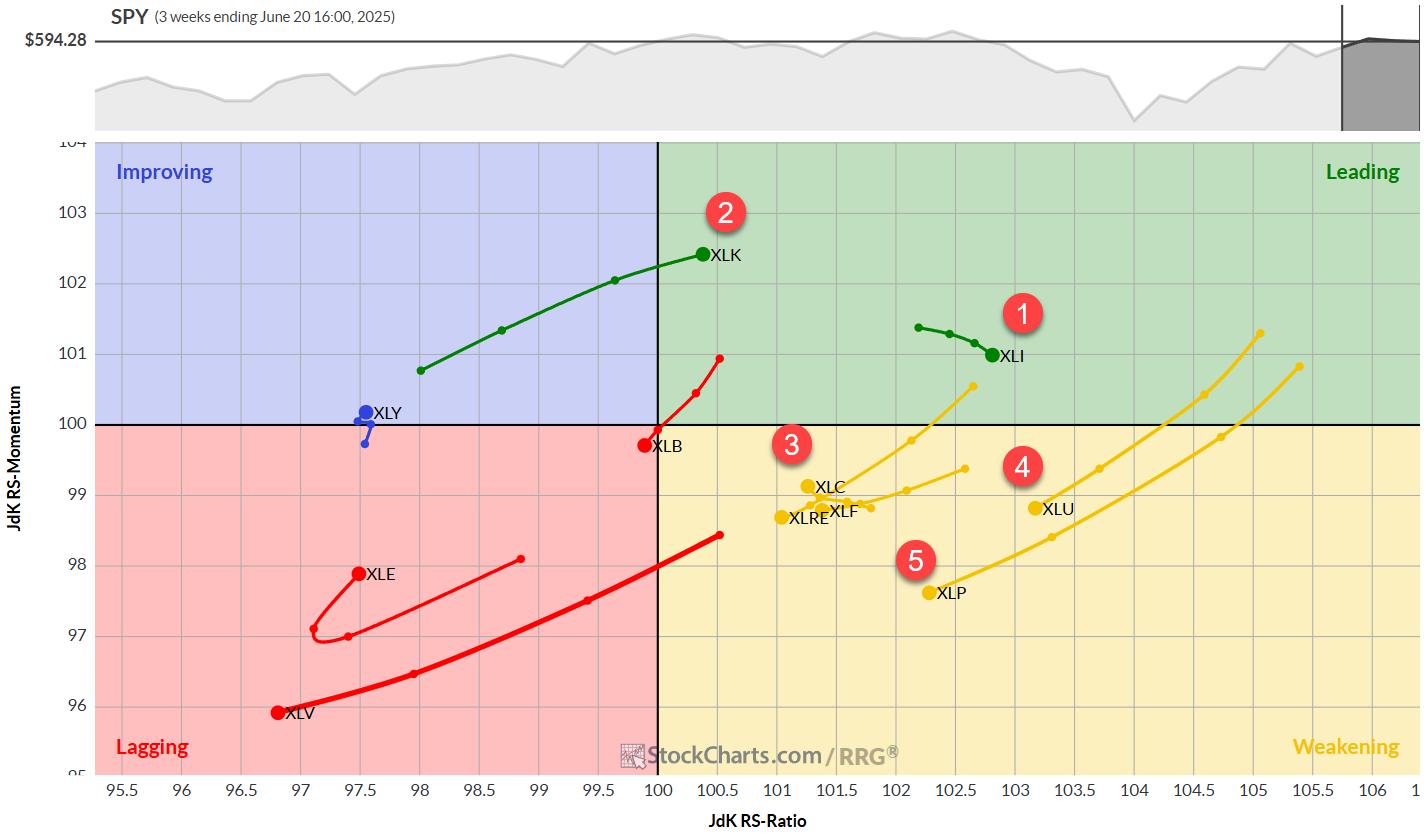
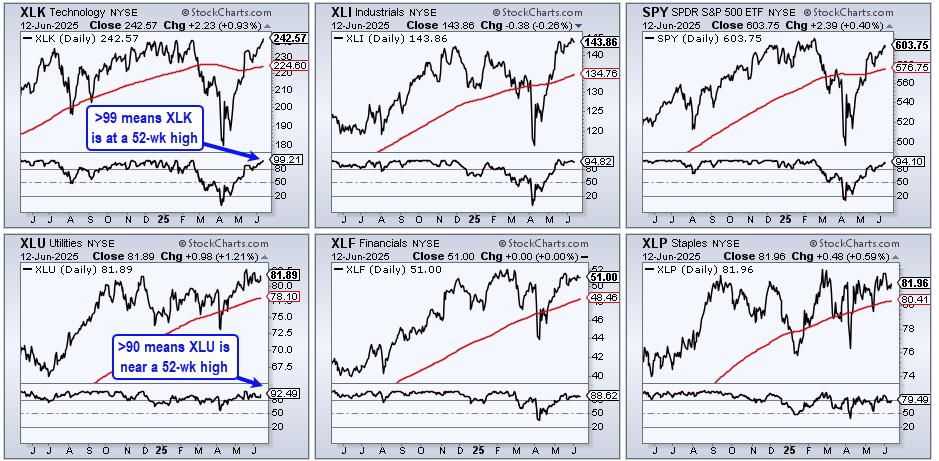
RRG Alert Tech Vaults to ‘Leading'—Is XLK Signaling a New Rally?
by Julius de Kempenaer,
Senior Technical Analyst, StockCharts.com
This week, Julius breaks down the current sector rotation using his signature Relative Rotation Graphs, with XLK vaulting into the leading quadrant while utilities and staples fade. He spotlights strength in the technology sector, led by semiconductors and electronic groups that are outpacing the S&P 500. Microchip heavyweights...
READ MORE
MEMBERS ONLY

Feeling Unsure About the Stock Market's Next Move? These Charts Can Help
by Jayanthi Gopalakrishnan,
Director of Site Content, StockCharts.com
When the stock market seems to be drifting sideways without displaying a clear bullish or bearish bias, it's normal for investors to get anxious. It's like being at a crossroads, wondering whether to go left, right, or stay put.
The truth is nobody has a crystal...
READ MORE
MEMBERS ONLY
Joe Rabil's Undercut & Rally Pattern: From DROP to POP
by Joe Rabil,
President, Rabil Stock Research
Joe presents his game-changing "undercut and rally" trading pattern, which can be found in high volatility conditions and observed via RSI, MACD and ADX signals. Joe uses the S&P 500 ETF as a live case study, with its fast shake-out below support followed by an equally...
READ MORE
MEMBERS ONLY
3 S&P 500 Charts That Point to the Next Big Move
by Frank Cappelleri,
Founder & President, CappThesis, LLC
Follow along with Frank as he presents the outlook for the S&P 500, using three key charts to spot bullish breakouts, pullback zones, and MACD signals. Frank compares bearish and bullish setups using his pattern grid, analyzing which of the two is on top, and explains why he&...
READ MORE
MEMBERS ONLY

G7 Meeting in Canada Could Be Opportune Time for Accumulating Canadian Dollar and Canadian Equities
by Martin Pring,
President, Pring Research
The Canadian dollar peaked in 2007 and 2011 at around $1.05, and it has been zig-zagging downwards ever since. Now at a lowly 73 cents USD, the currency looks as if it may be in the process of bottoming, or at the very least entering a multi-year trading range....
READ MORE
MEMBERS ONLY

Navigate the Stock Market with Confidence
by Jayanthi Gopalakrishnan,
Director of Site Content, StockCharts.com
When you see headlines about geopolitical tensions and how the stock market sold off on the news, it can feel unsettling, especially when it comes to your hard-earned savings. But what you might not hear about in the news is what the charts are indicating.
Look at what happened in...
READ MORE
MEMBERS ONLY
The Best Five Sectors, #23
by Julius de Kempenaer,
Senior Technical Analyst, StockCharts.com
This Time Technology Beats Financials
After a week of no changes, we're back with renewed sector movements, and it's another round of leapfrogging.
This week, technology has muscled its way back into the top five sectors at the expense of financials, highlighting the ongoing volatility in...
READ MORE
MEMBERS ONLY

Bearish Divergence Suggests Caution For S&P 500
by David Keller,
President and Chief Strategist, Sierra Alpha Research
With Friday's pullback after a relatively strong week, the S&P 500 chart appears to be flashing a rare but powerful signal that is quite common at major market tops. The signal in question is a bearish momentum divergence, formed by a pattern of higher highs in...
READ MORE
MEMBERS ONLY

Is a Bold Rotation Brewing in Healthcare and Biotech? Here's What to Watch Now
by Karl Montevirgen,
The StockCharts Insider
Catching a sector early as it rotates out of a slump is one of the more reliable ways to get ahead of an emerging trend. You just have to make sure the rotation has enough strength to follow through.
On Thursday morning, as the markets maintained a cautiously bullish tone,...
READ MORE
MEMBERS ONLY
Three Sectors Stand Out and One Sports a Bullish Breakout
by Arthur Hill,
Chief Technical Strategist, TrendInvestorPro.com
Three sectors stand out, with one sporting a recent breakout that argues for higher prices. Today's report will highlight three criteria to define a leading uptrend. First, price should be above the rising 200-day SMA. Second, the price-relative should be above its rising 200-day SMA. And finally, leaders...
READ MORE
MEMBERS ONLY

RRG Update: Is Tech Ready to Break Out?
by Julius de Kempenaer,
Senior Technical Analyst, StockCharts.com
This week, Julius shows how the Technology sector is edging toward leadership, alongside Industrials and soon-to-follow Communication Services. He highlights breakout lines for SPY, XLK, and XLC, noting that conviction climbs when daily and weekly RRG tails align to point northeast together. Bitcoin is sprinting into the leading quadrant next...
READ MORE
MEMBERS ONLY

What the S&P 500, VIX, and ARKK are Telling Us Now
by Frank Cappelleri,
Founder & President, CappThesis, LLC
While the S&P 500 ($SPX) logged a negative reversal on Wednesday, the Cboe Volatility Index ($VIX), Wall Street's fear gauge, logged a positive reversal. This is pretty typical: when the S&P 500 falls, the VIX rises.
Here's what makes it interesting: the...
READ MORE
MEMBERS ONLY

10‑Year Yield Warning! ADX + RSI Point to a Major Shift
by Joe Rabil,
President, Rabil Stock Research
Joe kicks off this week's video with a multi‑timeframe deep dive into the 10‑year U.S. Treasury yield (TNX), explaining why a sideways coil just below the 5% level could be "downright scary" for equities. From there, he demonstrates precise entry/exit timingwith a...
READ MORE
MEMBERS ONLY

Unlocking Stock Market Insights: Identify Global Opportunities with StockCharts' Market Summary
by Jayanthi Gopalakrishnan,
Director of Site Content, StockCharts.com
The U.S. stock market has been painting a subtle picture recently. While the broader indexes, such as the S&P 500 ($SPX), Nasdaq Composite ($COMPQ), and Dow Jones Industrial Average ($INDU), are indeed grinding higher, the daily movements have been relatively subdued. This is a noticeable shift from...
READ MORE
MEMBERS ONLY
Is the S&P 500 Flashing a Bearish Divergence?
by David Keller,
President and Chief Strategist, Sierra Alpha Research
Unlock the power of divergence analysis! Join Dave as he breaks down what a bearish momentum divergence is and why it matters. Throughout this video, Dave illustrates how to confirm (or invalidate) the signal on the S&P500, Nasdaq100, equal‑weighted indexes, semiconductors, and even defensive names like AT&...
READ MORE
MEMBERS ONLY

Micron's Coiled for An Explosive Move (Up or Down): Here's What You Need to Know Now
by Karl Montevirgen,
The StockCharts Insider
Micron Technology, Inc. (MU) appears poised for an explosive breakout, both technically and fundamentally. While it remains to be seen whether this materializes by its Q3 earnings report on June 25, the setup suggests a high-probability move is about to happen, and soon.
The fundamental case for a breakout is...
READ MORE
MEMBERS ONLY

A Few Charts Worth Watching This Week
by Jay Woods,
Chief Global Strategist, Freedom Capital Markets
There are a few very different setups unfolding this week that are worth a closer look: two software-related names that are struggling to reclaim their winning ways, plus one lovable and reliable stock wagging its tail in the spotlight.
Let's break it down.
Adobe (ADBE): Mind the Gaps...
READ MORE