MEMBERS ONLY
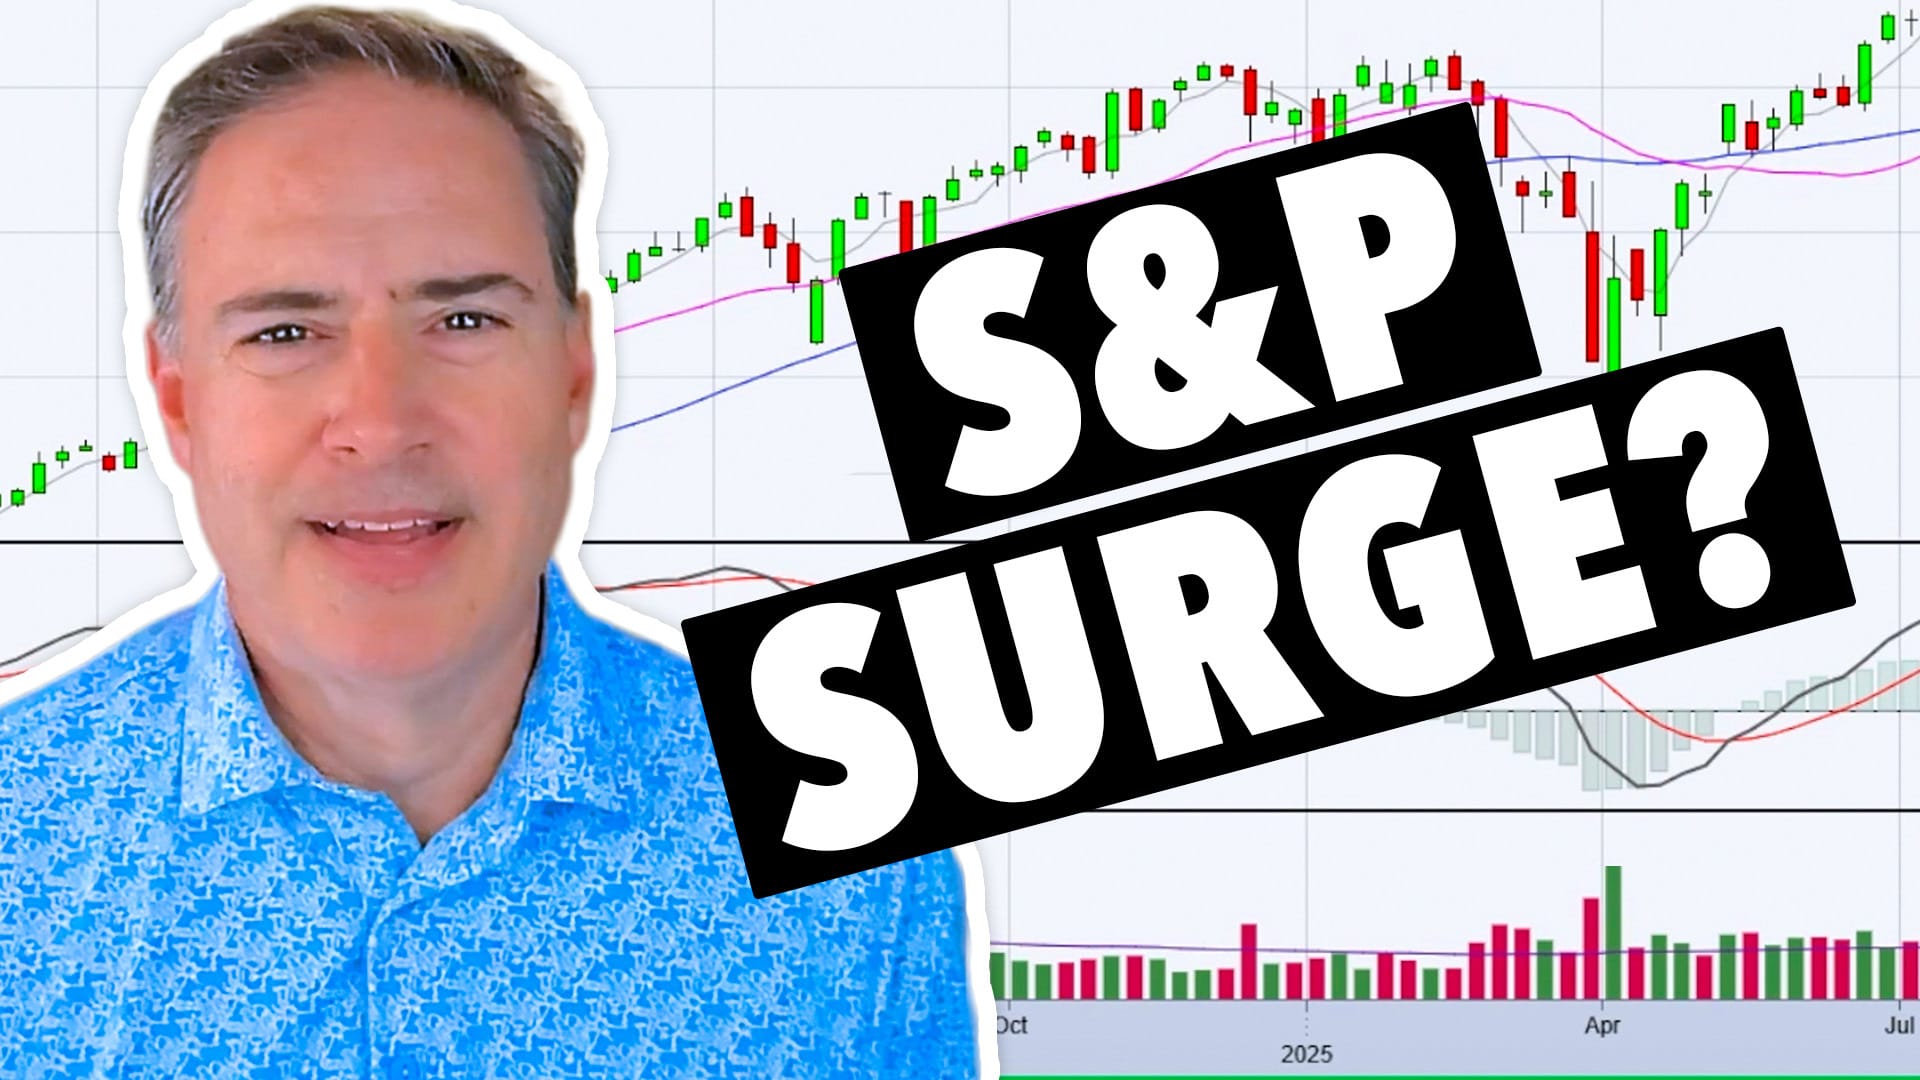
Is the S&P 500 About to Surge?

by Joe Rabil,
President, Rabil Stock Research
Joe analyzes the S&P 500’s current sequential wave pattern and, from there, explains how to spot a shift into a surging market phase. He breaks down key support and resistance levels on the SPY daily chart, evaluates the QQQ and IWM for signs of market strength, and...
READ MORE
MEMBERS ONLY

What to Make of the Small-Cap Rally: A Closer Look at IJR and IWM
Small-cap stocks are showing signs of strength. Investors should keep an eye on the performance of IWM and IJR, two small-cap ETFs, to determine if the small-cap rally has legs....
READ MORE
MEMBERS ONLY

This Week’s Stock Market Winners — And What’s Driving Them

by Mary Ellen McGonagle,
President, MEM Investment Research
Join Mary Ellen as she breaks down the latest market trends! The highlight of the show is a deep dive into the consumer discretionary sector, where Mary Ellen analyzes leading industry groups like homebuilders, apparel, and specialty retail, and explains why this sector continues to show relative strength. She shares...
READ MORE
MEMBERS ONLY

US Dollar at a Crossroads, Gold Primed for Action: Macro Moves to Watch
With high-impact US data and geopolitical risks on tap this week, traders must assess the US dollar. Here are some outcomes that could surface in the dollar and gold....
READ MORE
MEMBERS ONLY
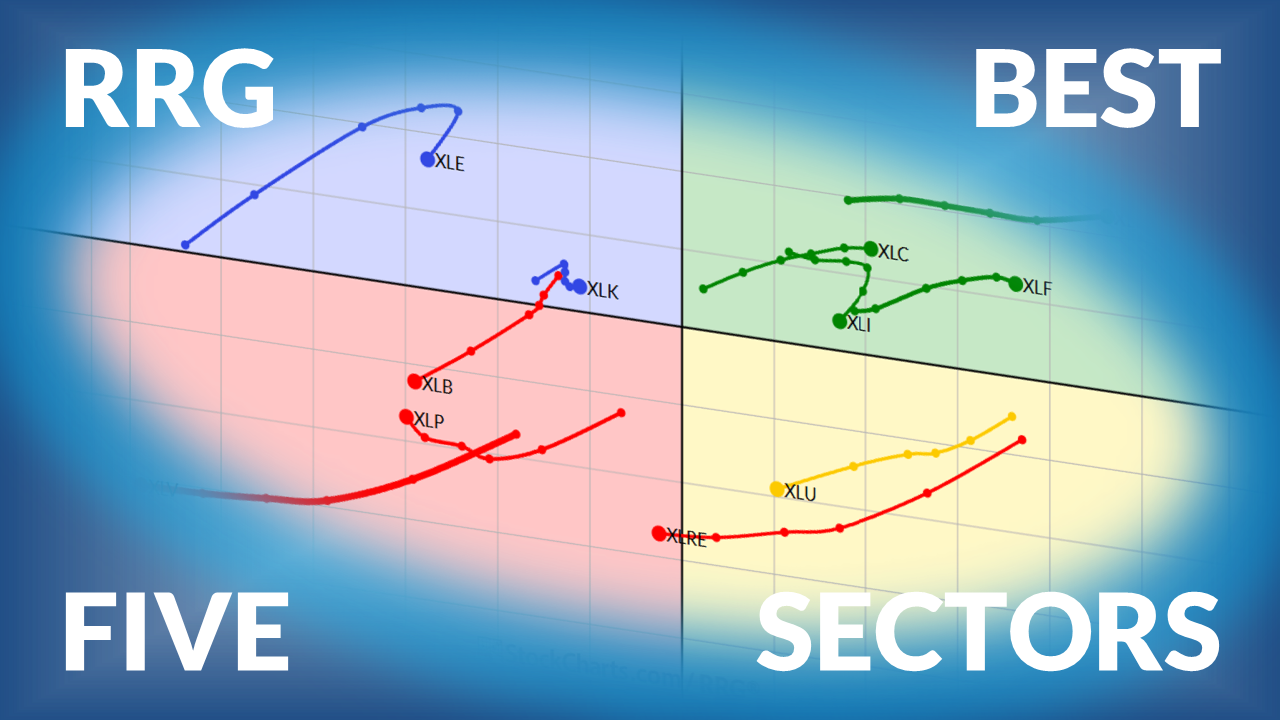
The Best Five Sectors, #31

by Julius de Kempenaer,
Senior Technical Analyst, StockCharts.com
Julius presents his weekly update on US sector rotation based on Relative Rotation Graphs....
READ MORE
MEMBERS ONLY

Week Ahead: Keeping Head Above This Level Crucial for Nifty To Avoid Slipping Into Prolonged Weakness

by Milan Vaishnav,
Founder and Technical Analyst, EquityResearch.asia and ChartWizard.ae
Nifty logs its sixth week of losses, hovering below key resistance. Traders remain cautious amid potential downside risks. ...
READ MORE
MEMBERS ONLY

Three Key Macro Charts I’m Watching on Vacation

by David Keller,
President and Chief Strategist, Sierra Alpha Research
Here are the key levels to watch in the S&P 500 as well as META, MSFT, and AAPL. As long as the index and stocks hold above key support levels, the uptrend in stocks is in good shape. ...
READ MORE
MEMBERS ONLY

Friday Chart Fix: 2024 vs. 2025, Commodities with a Dash of Crypto, Moment of Truth for IWM, The Tesla Squeeze

by Arthur Hill,
Chief Technical Strategist, TrendInvestorPro.com
Here's a deep dive into the differences between the 2024 bull market and 2025 bull run, small-cap performance, the price action in Bitcoin and gold, and the Bollinger Band squeeze in Tesla's stock price....
READ MORE
MEMBERS ONLY

Apple's Strongest 2-Day ROC Since April: Breakout or Bull Trap?
Apple (AAPL) jumps on tariff relief headlines. See the ROC thrust, 200-day moving average test, gap levels at $213/$203, and targets to $237-$250....
READ MORE
MEMBERS ONLY

Smart Investors are Watching These Chart Signals: Here's Why

by Frank Cappelleri,
Founder & President, CappThesis, LLC
Discover what Bollinger Bands and RSI are signaling for the S&P 500. Learn how low volatility and key momentum indicators could point to the next market breakout....
READ MORE
MEMBERS ONLY
How We Beat the S&P 500 by 20% This Quarter!

by Tom Bowley,
Chief Market Strategist, EarningsBeats.com
Tom breaks down how his model portfolios have consistently outperformed the S&P 500 — including a 24.5% return for the aggressive portfolio over the past quarter, against the S&P 500’s 5%. He covers market signals following the Fed’s recent rate decision, explains why Wall...
READ MORE
MEMBERS ONLY

The Good, the Bad, and the Sideways
by David Keller,
President and Chief Strategist, Sierra Alpha Research
As U.S. equity indexes hit new highs, not all stocks are keeping pace. Explore these three stocks that are at key technical junctures with charts that highlight trend shifts, risk levels, and actionable signals....
READ MORE
MEMBERS ONLY
Top 10 Charts to Watch August 2025!

by Grayson Roze,
Chief Strategist, StockCharts.com
Join Grayson Roze as he reveals his top 10 stock charts to watch this month including SFM, BSX, AFRM and SYF. From breakout strategies to moving average setups, he walks through technical analysis techniques using relative strength, momentum, and trend-following indicators. Viewers will also gain insight into key market trends...
READ MORE
MEMBERS ONLY
Top 10 Stock Charts for August 2025 You Need to Watch Now
by David Keller,
President and Chief Strategist, Sierra Alpha Research
Join Dave as he shares ten actionable stock charts for August 2025 that he’s watching closely. From breakout setups to key reversals, David highlights tickers like Tesla, Meta, Caterpillar, Motorola, and Newmont Mining that show compelling technical patterns. He also walks through how to manage the full trading process...
READ MORE
MEMBERS ONLY
Markets Drop! But These Stocks Are Still Leading
by Mary Ellen McGonagle,
President, MEM Investment Research
Mary Ellen McGonagle breaks down this week’s market volatility and what it means for investors. She explains how inflation and employment data triggered technical breakdowns in key indexes, and discusses why volatility, relative strength, and leadership stocks (including MPWR, TER, and Cadence Design) should remain on your radar. Mary...
READ MORE
MEMBERS ONLY

Last Week’s Market Action Showed Signs of Exhaustion, Especially In This One Key Stock

by Martin Pring,
President, Pring Research
Explore how recent bearish weekly patterns in the S&P 500, Nasdaq, and Microsoft could signal an intermediate-term trend reversal. Learn why confirmation is key in technical analysis....
READ MORE
MEMBERS ONLY

Warning Signs in the Charts: How to Survive a Late-Summer Shakeout
by Tom Bowley,
Chief Market Strategist, EarningsBeats.com
The stock market rally may be hitting a wall as volatility spikes and bearish signals emerge. Discover key technical warnings, seasonal trends, and how traders and investors should prepare for a choppy August–September....
READ MORE
MEMBERS ONLY

Week Ahead: Nifty Tests Key Support Levels—May Weaken If Levels Violated
by Milan Vaishnav,
Founder and Technical Analyst, EquityResearch.asia and ChartWizard.ae
The Nifty closed the week lower, trading within a narrow range. Volatility also rose. Monitor short-term support levels as we head into next week. Discover which sectors are leading and which are lagging....
READ MORE
MEMBERS ONLY

Thursday's Stock Market Dive: Noise or a Warning? Let the Charts Decide

by Jayanthi Gopalakrishnan,
Director of Site Content, StockCharts.com
Was Thursday's market dip a warning sign or just noise? Explore market trends, sentiment, and sector rotation, and learn how the StockCharts Market Summary page can help you stay one step ahead....
READ MORE
MEMBERS ONLY

Meta, Microsoft Blow Past Earnings — Are These Stock Next?
by Tom Bowley,
Chief Market Strategist, EarningsBeats.com
Tom recaps a pivotal week for the markets, as the Fed holds rates steady despite signs of softening economic growth. Tom breaks down the rare dissent among Fed governors, the market’s sharp reaction during Jerome Powell’s press conference, and the technical fallout across major indexes, especially small caps...
READ MORE
MEMBERS ONLY

3 Types of Breakouts To Upgrade Your Portfolio
by David Keller,
President and Chief Strategist, Sierra Alpha Research
Use this StockCharts scan to identify three categories of stocks and ETFs that are making new three-month highs....
READ MORE
MEMBERS ONLY
Avoid This Common RSI Mistake (And What to Do Instead)
by Joe Rabil,
President, Rabil Stock Research
Master RSI strategies with Joe! Follow along as Joe shares his refined method using dual timeframes and a two-RSI approach; see how he uses RSI-20 as a trend filter and RSI-5 as an entry signal to avoid common mistakes and enhance trading precision. Joe breaks down real chart examples on...
READ MORE
MEMBERS ONLY
Catch Big Moves Early With This Breakout Scan!
by David Keller,
President and Chief Strategist, Sierra Alpha Research
Follow along as Dave shares the one stock scan he runs every week to uncover potential breakout candidates. He explains the three types of chart setups that frequently appear, each with their own trading implications, and walks through how he structures trades according to type. He also illustrates how to...
READ MORE
MEMBERS ONLY

Is It Time to Take Another Look at China?
by Martin Pring,
President, Pring Research
Here's an analysis of the recent bullish developments in the Shanghai Stock Exchange Composite Index and liquid Chinese ETFs. ...
READ MORE
MEMBERS ONLY

Before You Cast Away, Hook the Market's Key Trends on StockCharts
by Jayanthi Gopalakrishnan,
Director of Site Content, StockCharts.com
Check these must-see StockCharts signals before you cast off for the summer and see whether August's market currents say "stay the course" or "make adjustments."...
READ MORE
MEMBERS ONLY
These Breakout Stocks Are Leading the Market Right Now
by Mary Ellen McGonagle,
President, MEM Investment Research
Markets hit another all-time high as rotation accelerates into biotech, software, and alt-energy names. Follow along as Mary Ellen breaks down the top-performing sectors and ETFs, including key breakouts in Bloom Energy, DoorDash, and Deckers. She also highlights meme stocks' action, examines what international leadership in countries like Spain...
READ MORE
MEMBERS ONLY

Is the Charging Bull Getting Tired?

by Bruce Fraser,
Industry-leading "Wyckoffian"
Optimism surrounds the stock market indexes with lofty price targets. Could the fulfillment of Point & Figure targets mean the end of a bull market? Find out here. ...
READ MORE
MEMBERS ONLY

The Week Ahead: NIFTY Will Have a Lot Of Reactions To Offer; Stares At Important Supports
by Milan Vaishnav,
Founder and Technical Analyst, EquityResearch.asia and ChartWizard.ae
Nifty ended the week slightly lower after trading within a narrow range. With key levels in focus and technical indicators showing mixed signals, markets may remain sideways for a while....
READ MORE
MEMBERS ONLY

Using Relative Rotation Graphs to Visualize Sector Rotation
by Julius de Kempenaer,
Senior Technical Analyst, StockCharts.com
Relative Rotation Graphs or RRGs will help investors to keep an eye on relative trends that unfold within a universe. Among other things this will help to visualize sector rotation...
READ MORE
MEMBERS ONLY

Chart Mania - 23 ATR Move in QQQ - Metals Lead 2025 - XLV Oversold - XLU Breakout - ITB Moment of Truth
by Arthur Hill,
Chief Technical Strategist, TrendInvestorPro.com
Tech stocks are heating up, utilities break out, metals lead, and homebuilders hit a moment of truth....
READ MORE
MEMBERS ONLY

S&P 500 Breaking Out Again: What This Means for Your Portfolio
by Frank Cappelleri,
Founder & President, CappThesis, LLC
The S&P 500 ($SPX) just logged its fifth straight trading box breakout, which means that, of the five trading ranges the index has experienced since the April lows, all have been resolved to the upside.
How much longer can this last? That's been the biggest question...
READ MORE
MEMBERS ONLY

Momentum Leaders Are Rotating — Here's How to Find Them
by Tom Bowley,
Chief Market Strategist, EarningsBeats.com
Is the market's next surge already underway? Find out with Tom Bowley's breakdown of where the money is flowing now and how you can get in front of it.
In this video, Tom covers key moves in the major indexes, revealing strength in transports, small caps,...
READ MORE
MEMBERS ONLY

Emerging Markets May Be on the Cusp of a Major Breakout
by Martin Pring,
President, Pring Research
Emerging markets, in the form of the iShares MSCI Emerging Markets ETF (EEM), have been underperforming the DJ World Index since 2010 -- but that may be about to change.
After all, Chart 1 shows that the RS line has crossed above a three-year down trendline and experienced a long-term...
READ MORE
MEMBERS ONLY
A Wild Ride For the History Books: 2025 Mid-Year Recap
by Grayson Roze,
Chief Strategist, StockCharts.com
by David Keller,
President and Chief Strategist, Sierra Alpha Research
Markets don't usually hit record highs, then risk falling into bearish territory, and spring back to new highs within six months. But that's what happened in 2025.
In this special mid-year recap, Grayson Roze sits down with David Keller, CMT, to show how disciplined routines, price-based...
READ MORE
MEMBERS ONLY

Tech Taps the Brakes, Homebuilders Hit the Gas: See the Rotation on StockCharts Today
by Jayanthi Gopalakrishnan,
Director of Site Content, StockCharts.com
Technology stocks cool before earnings, but the Nasdaq holds above a key moving average. See rotation, support, and key charts on StockCharts to stay ready....
READ MORE
MEMBERS ONLY

The Best Five Sectors, #28
by Julius de Kempenaer,
Senior Technical Analyst, StockCharts.com
The Technology sector continues to dominate, while Industrials are rotating out of the leading quadrant....
READ MORE
MEMBERS ONLY

Week Ahead: NIFTY Violates Short-Term Supports; Still Tentatively Devoid of Any Major Triggers
by Milan Vaishnav,
Founder and Technical Analyst, EquityResearch.asia and ChartWizard.ae
The Nifty traded in a broadly sideways and range-bound manner throughout the week, ending it with a modest decline. The Index oscillated within a narrow 276-point range, between 25144.60 on the higher end and 24918.65 on the lower end, before settling mildly lower. The India VIX declined by...
READ MORE
MEMBERS ONLY

The Real Drivers of This Market: AI, Semis & Robotics
by Mary Ellen McGonagle,
President, MEM Investment Research
In this video, Mary Ellen spotlights the areas driving market momentum following Taiwan Semiconductor's record-breaking earnings report. She analyzes continued strength in semiconductors, utilities, industrials, and AI-driven sectors, plus highlights new leadership in robotics and innovation-focused ETFs like ARK. From there, Mary Ellen breaks down weakness in health...
READ MORE
MEMBERS ONLY

July Strength, Late-Summer Caution: 3 Charts to Watch
by Jayanthi Gopalakrishnan,
Director of Site Content, StockCharts.com
July seasonality is lifting the S&P 500 as breadth and bullish sentiment hold up. Discover which charts to watch before the choppier August to October stretch. ...
READ MORE
MEMBERS ONLY

This Market Sector is Starting to Emerge as a Leader; Can it Complete the Job?
by Martin Pring,
President, Pring Research
Many years ago, I developed a couple of indexes that were designed to give me a sense of whether industry groups benefiting from inflationary conditions were outperforming those who performed better under deflationary ones. It was my way of recognizing the fact that, in a broad sense, the business cycle...
READ MORE
