The Best Five Sectors This Week #66
Key Takeaways
- Technology remains the strongest sector, dominating both weekly and daily RRG charts, with potential for a correction without harming its uptrend.
- Energy shows signs of recovery, maintaining its top position despite being in the weakening quadrant on RRG charts.
- Materials, Industrials, and Real Estate are in the weakening quadrant and require improved relative strength to sustain their rankings.
- Portfolio performance lags the S&P 500 due to heavy reliance on technology, which drives overall sector dynamics.
Technology Leads, Energy Holds Steady
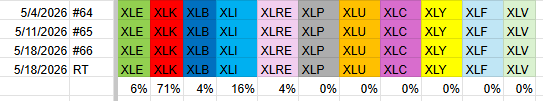
After a week in which the S&P 500 edged marginally higher, the sector rankings remained unchanged, leaving us with the same ranking as last week.
- (1) Energy - XLE [6%]
- (2) Technology - XLK [71%]
- (3) Materials - XLB [4%]
- (4) Industrials - XLI [16%]
- (5) Real Estate - XLRE [4%]
- (6) Consumer Staples - XLP
- (7) Utilities - XLU
- (8) Communication Services - XLC
- (9) Consumer Discretionary - XLY
- (10) Financials - XLF
- (11) Health Care - XLV
Weekly RRG
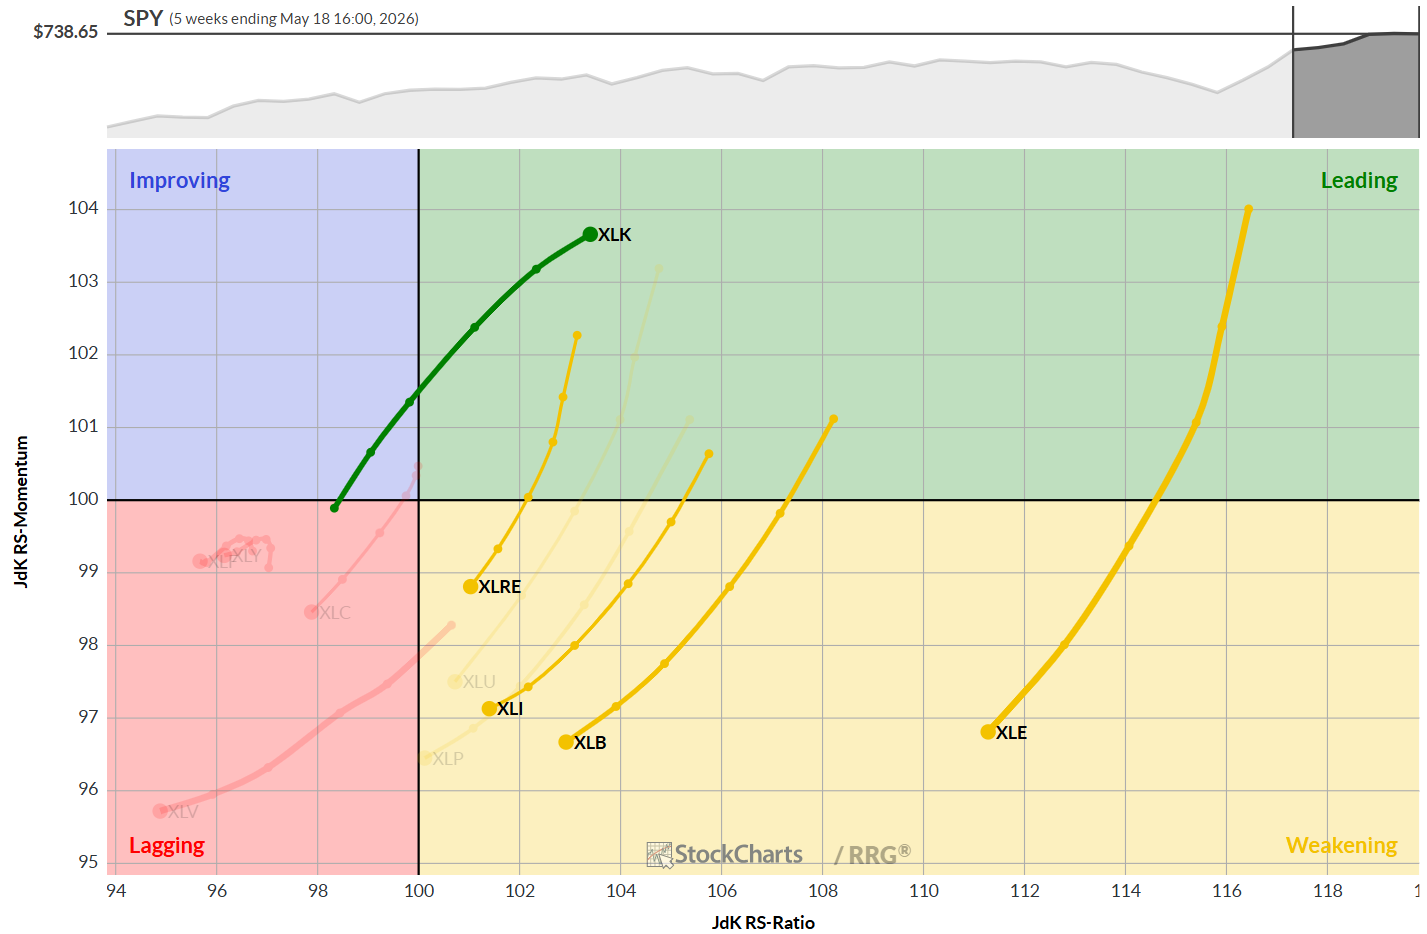
The weekly Relative Rotation Graph (RRG) is increasingly dominated by the Technology sector (XLK), which is now the only sector inside the leading quadrant and the only one moving at a positive RRG heading. The other top five sectors—Energy, Materials, Industrials, and Real Estate—are all inside the weakening quadrant, traveling at a negative RRG heading. Despite this, they remain stronger than the other sectors, which are mostly located in the lagging quadrant on the weekly RRG.
Daily RRG
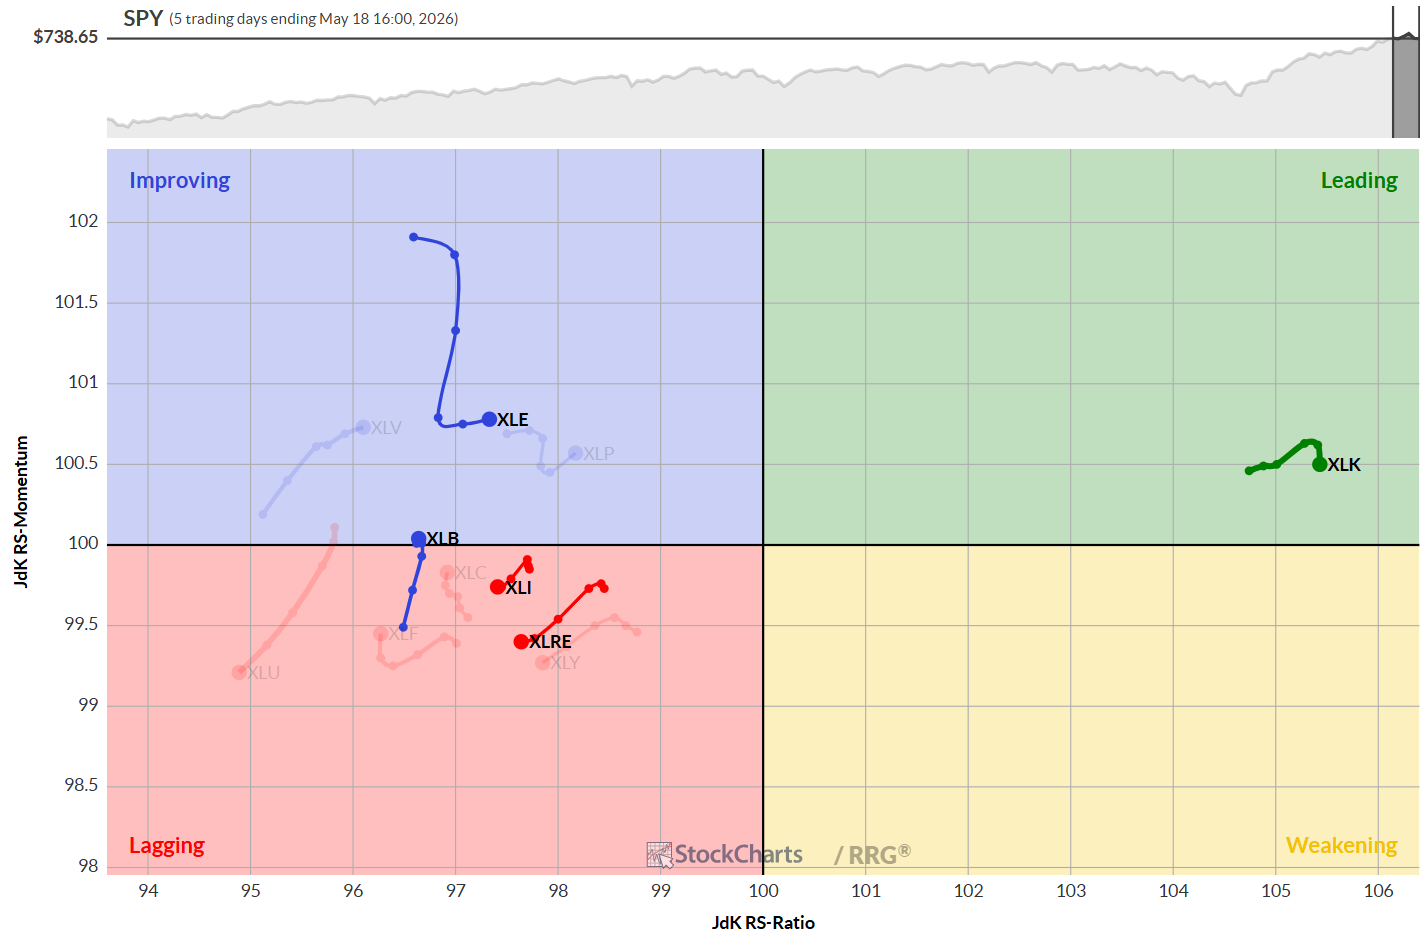
The daily RRG shows an even more divided picture. Technology (XLK) is the only sector inside the leading quadrant and, in fact, the only sector on the right-hand side of the graph. All other sectors are on the left, with energy inside the improving quadrant and just starting to move higher on the RS-ratio scale. Materials are almost moving vertically, crossing over into the improving quadrant.
Industrials and Real Estate remain inside the lagging quadrant, traveling at a negative RRG heading. The only reason these sectors are in the top five is due to the combination of their weekly and daily ratings.
Sector Highlights
Energy
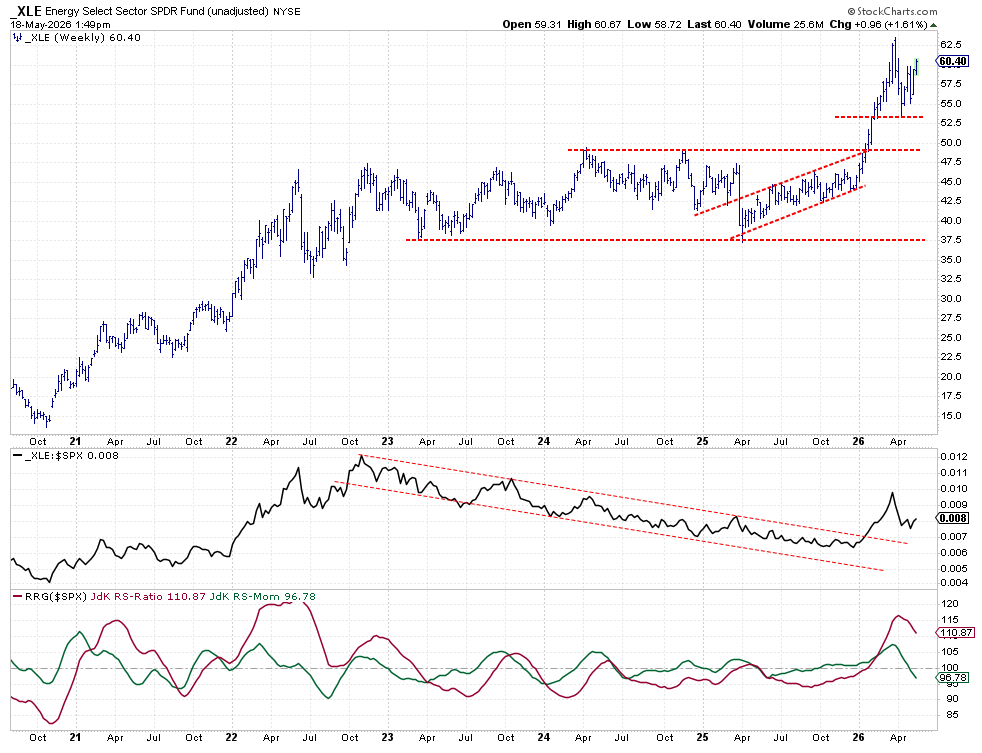
The Energy sector is now taking out its previous high, which is a positive sign on the price chart. The raw relative strength line shows some improvement. The RRG lines may need more time to digest the recent price move, but it appears the worst is over and the sector can continue to hold its position at the top.
Technology
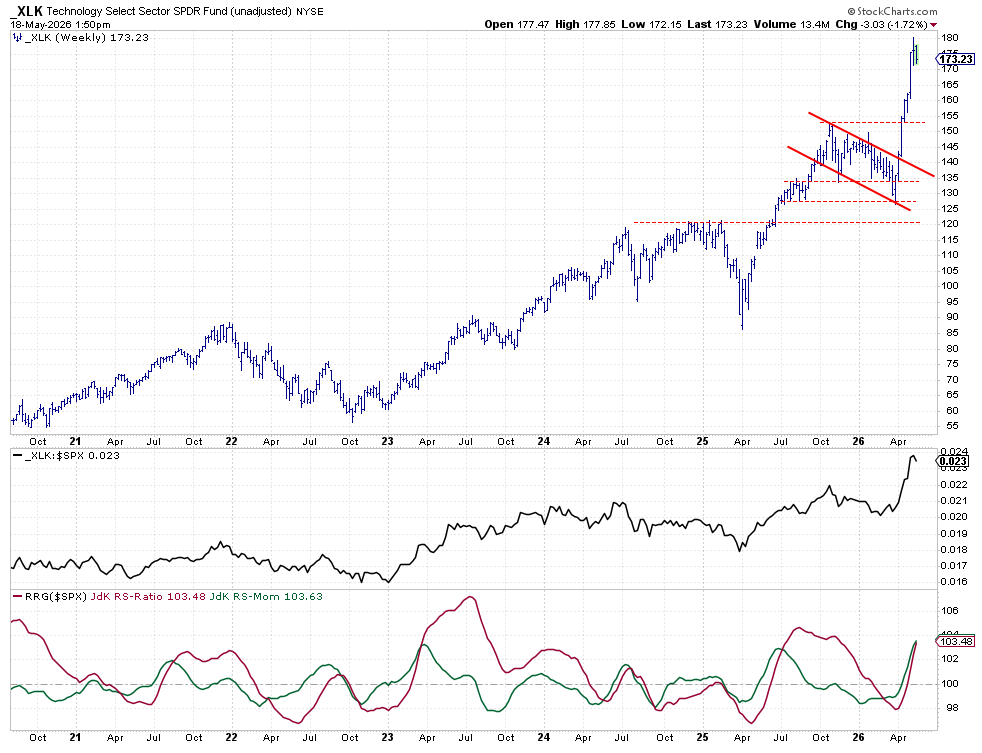
Clearly, the strongest sector at the moment, Technology, is holding up well after breaking out of a consolidation pattern. The only risk is that after a nearly vertical rally over the past five or six weeks, a more meaningful correction could occur. However, even if that happens, it is unlikely to cause the sector’s position to deteriorate rapidly.
The price chart shows room for a correction toward 152.5 without harming the uptrend, and the raw relative strength line also allows for consolidation. The RRG lines are still moving higher in tandem, and a setback is possible, but it would take time for it to impact the current uptrends.
Materials
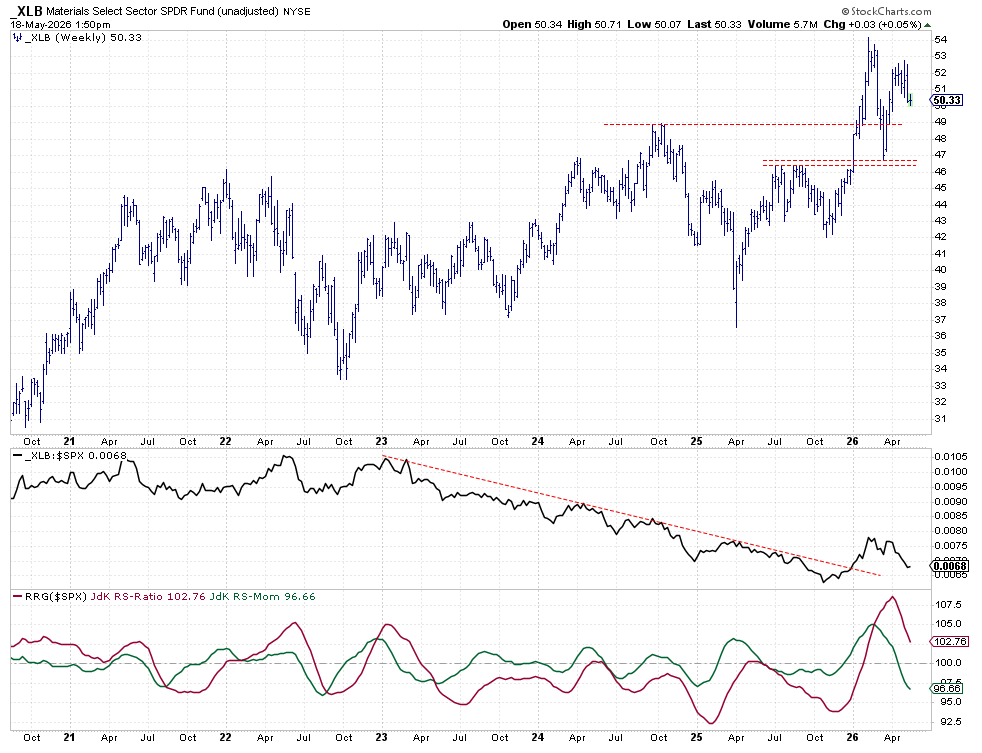
The Materials sector is slowly declining on both the price chart and the raw relative strength chart, affecting the RRG lines. With the RS ratio line still above 100 and RS momentum well below 100, the sector is positioned inside the weakening quadrant. There is a little room left for rotation, but relative strength needs to improve soon for that to happen.
Industrials
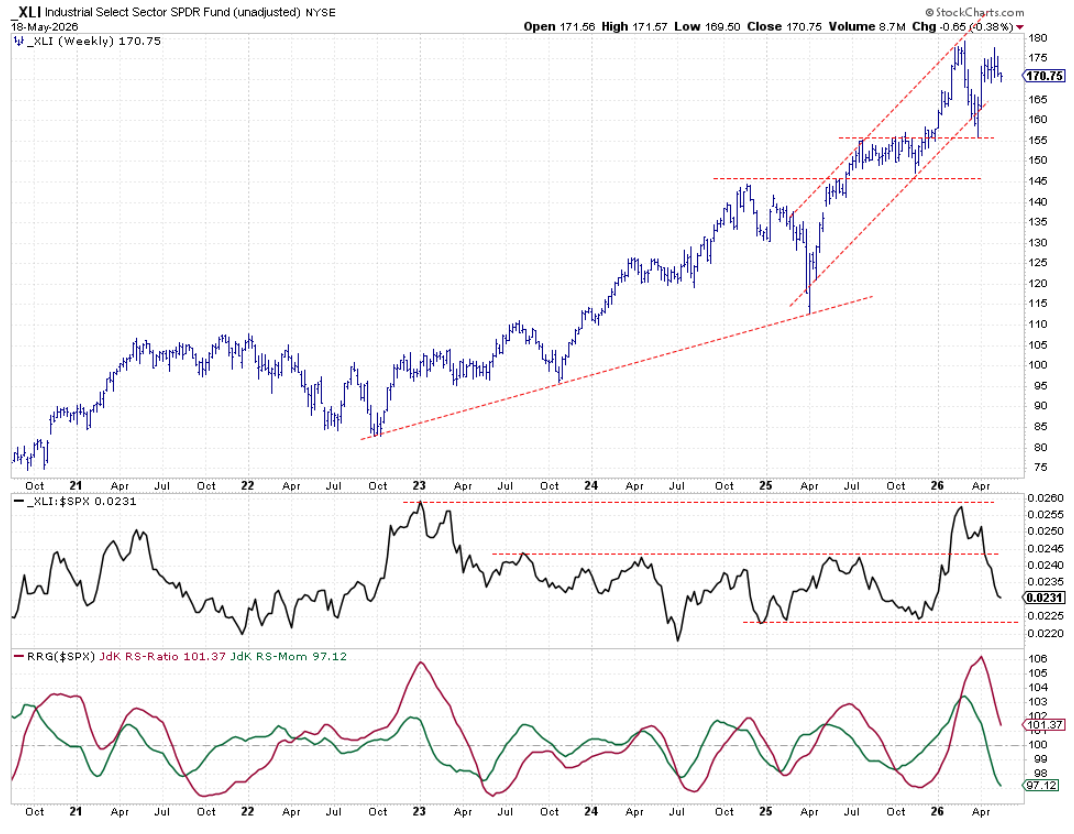
The Industrial sector is holding up within its rising channel but has been consolidating over the last six weeks. The raw RS line has dropped rapidly and is heading toward a test of horizontal support. The RS-ratio line is above 100 while RS-momentum is below 100, positioning the sector inside the weakening quadrant and traveling at a negative RRG heading. To maintain its position in the top five, the sector needs to pick up relative strength soon.
Real Estate
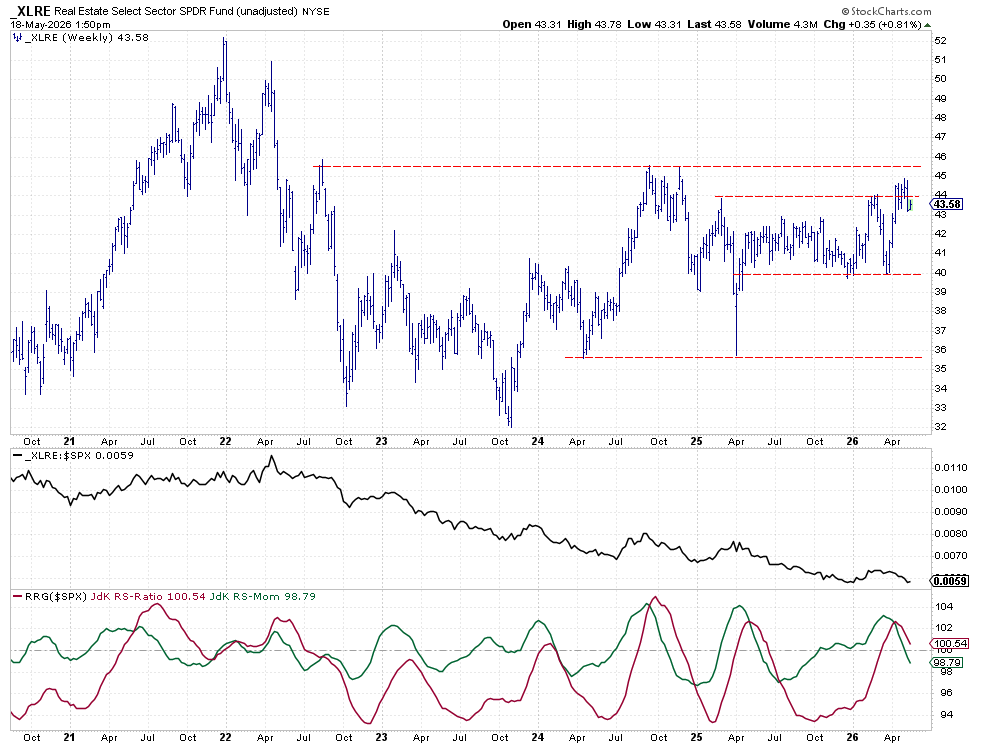
Ranked fifth, Real Estate is playing around with horizontal resistance at 44. After dropping below it last week, the sector started to crawl up again, but it’s not a decisive break. The raw RS line is holding at the previous low set at the beginning of the year; more time is needed to digest the relative strength negativity for the RRG lines to turn back up.
This sector is also inside the weakening quadrant and traveling at a negative RRG heading, needing improvement in raw relative strength.
Portfolio Performance
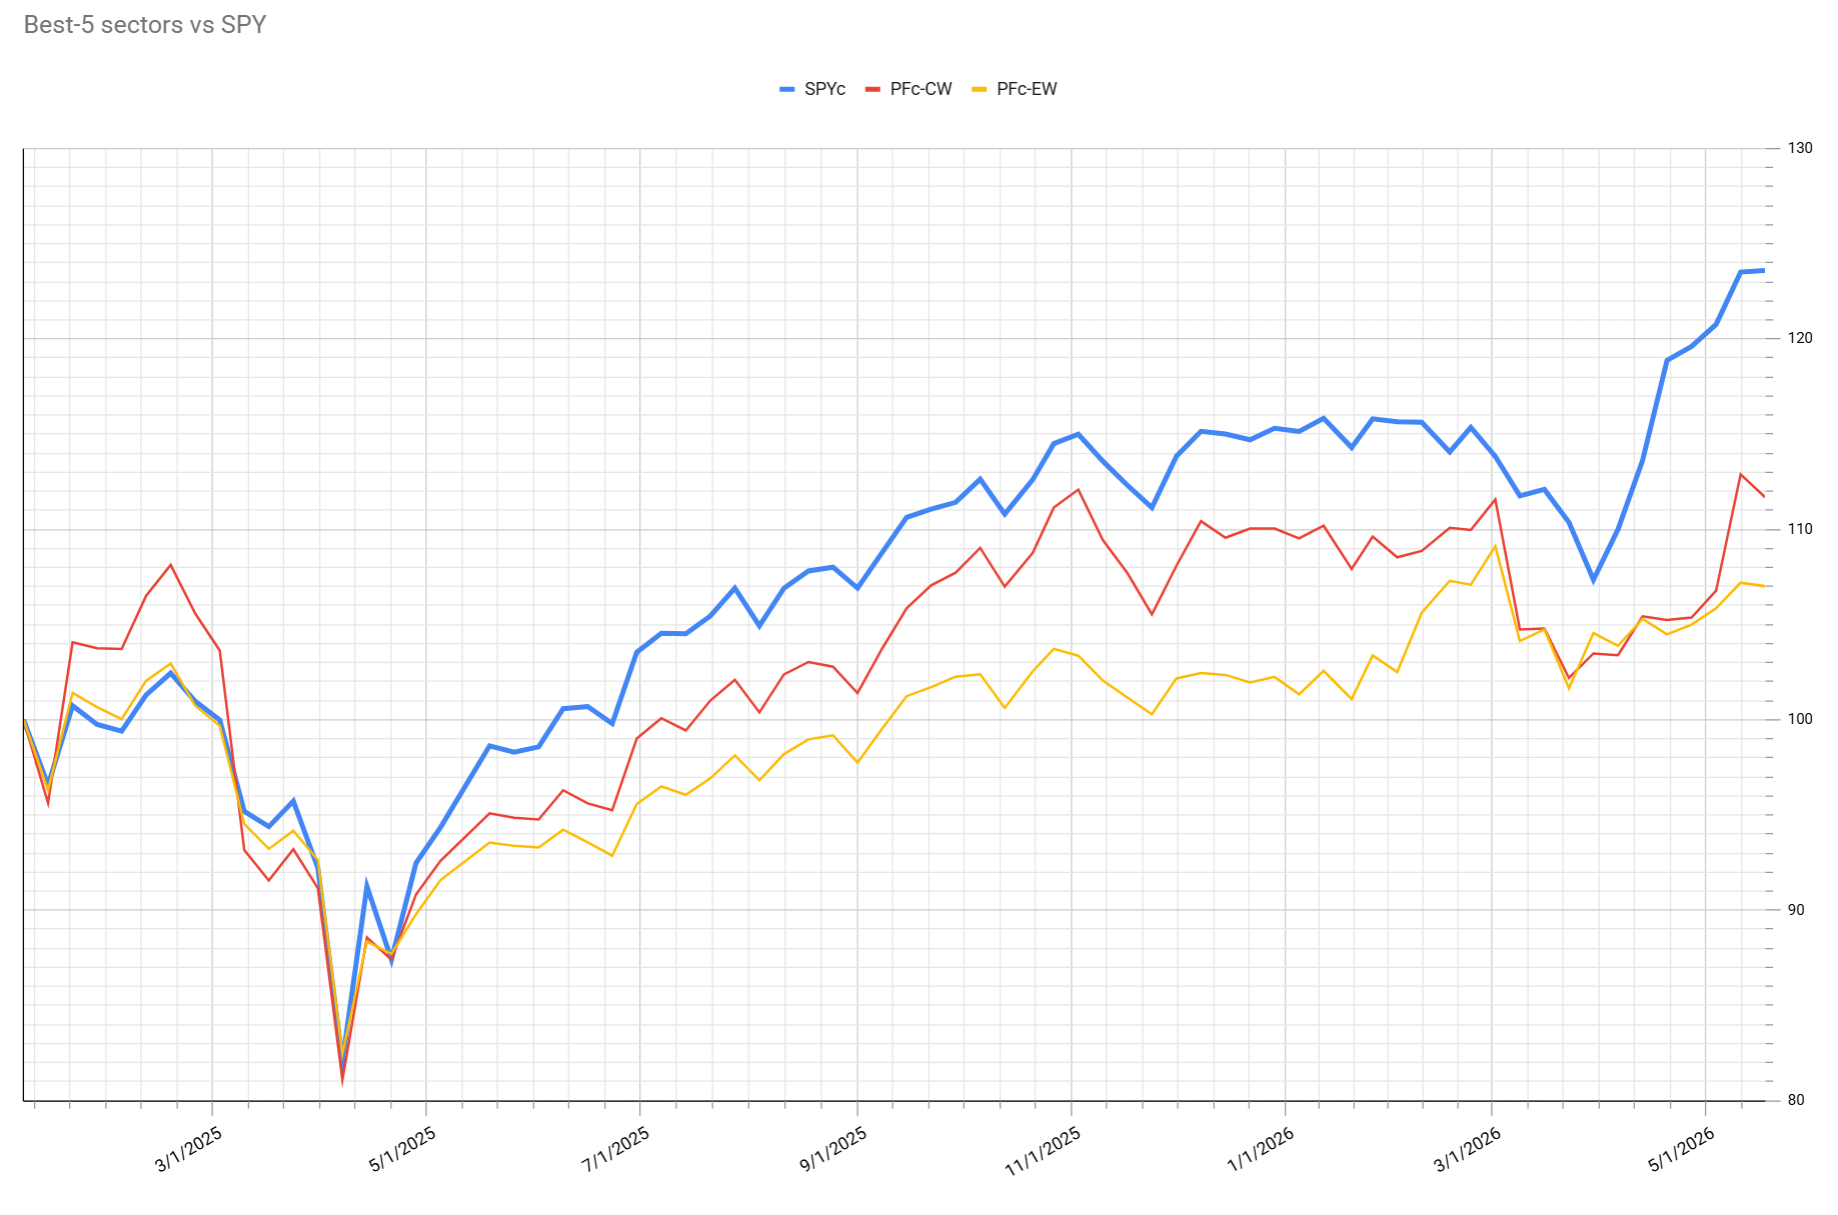
This week, the portfolio saw a slight setback of about 1%, putting it back above a 10% lag behind the S&P 500. This is largely due to the heavy weighting of the technology sector, which is around 70% based on cap-weighted allocations. The composition of the top five sectors is being closely monitored, and a meaningful rally in outperforming sectors is awaited.
Currently, technology is the only sector outperforming, so when it has a slow week, the portfolio loses value versus the S&P 500.
#StayAlert, -Julius