Stocks Shrugged Off Oil. Why They May Not Ignore Bonds

Key Takeaways
- Intermarket analysis is back in vogue as global fixed income markets dictate equity price action.
- Commodities print cycle highs, with oil stubbornly above $100 on WTI and Brent.
- One key technical level on the 30-year yield is in the bond vigilante’s crosshairs.
First bonds, then stocks, then commodities. That’s how traditional intermarket analysis is taught. This year hasn't quite followed the textbook script, with oil initially casting an ominous cloud over other asset classes.
But equities were resilient, lifting despite triple digits on the prompt months of both WTI and Brent. Today, the bond bugaboo spooks stocks. The 2022 analog is on the bears’ minds.
The Land of the Rising Rates
All eyes were on the Japanese long bond to begin this week. It scaled 4.00% on May 15, then snuck a peek at 4.20% before pulling back on Monday, a 28-year high. U.S. equity futures indeed took their cue from the unraveling of one of the world's most crucial funding markets.
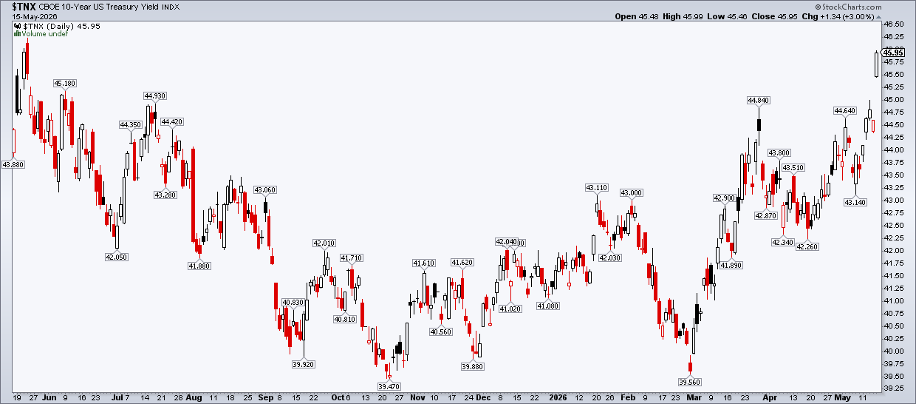
With the unofficial kickoff to summer on the doorstep, it's helpful to step back and gauge the U.S. 10-year rate ($TNX). Intermarket aficionados know that $TNX could hold the key to mid-year price action across asset classes and within equity sectors.
From AI Slowdown Fears to an Oil Shock
It was less than three months ago when the benchmark Treasury yield was below 4%. Fears of an AI-induced labor market slowdown and worries regarding corporate profitability had investors on edge and the sellside crafting largely domestic-focused notes. That all changed on the weekend of February 28, when the U.S. and Israel launched strikes on Iran. Bonds sold off as oil scaled $70, $80, $90, then $100 per barrel.
Fast-forward to today, and the 10-year rate is up 65 basis points, driven higher by the conflict in the Middle East and fiscal policy in key developed economies, such as Japan. But shall this too pass?
Ironically, U.S. yields are essentially unchanged from 12 months ago, when bond vigilantes were voicing their displeasure with the One Big Beautiful Bill and global rates were thrusting higher. In short, the past 90 days have been brutal for bonds but, over the past year, it’s not much to write home about.
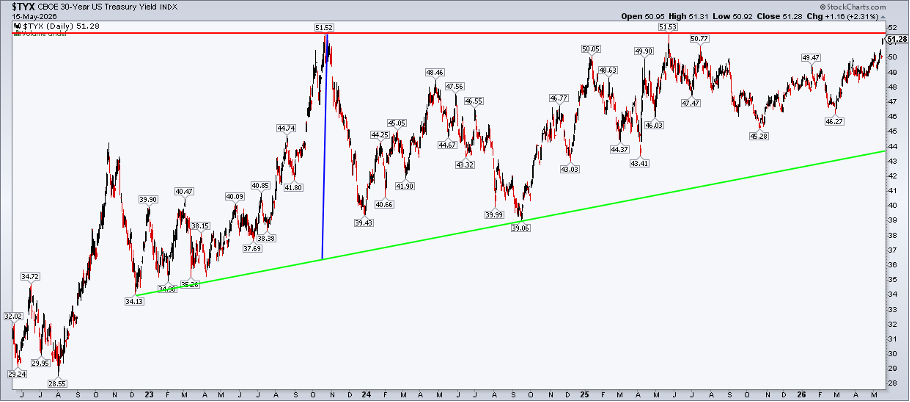
The Chart That Could Change Everything
Here's the real risk. The 30-year Treasury yield ($TYX) might finally be waking up from a years-long slumber. Since mid-2023, $TYX has established a series of higher lows, with resistance emerging between 5.1% and 5.2%. Though it hasn’t been a perfect ascending triangle, the rate could be primed to break out.
Of course, its downtrend from 1981 ended coming out of the pandemic, whether we use a log- or arithmetic-scale chart. The upside measured move price objective, based on the triangle pattern and a presumed breakout, is 6.40%.
For investors, the price loss on something like the iShares Core US Aggregate Bond ETF (AGG) wouldn’t be that dramatic. Its modified duration (a measure of a bond's price change for a 1% change in interest rates) is 5.9 years.
An immediate 1% rise in rates would result in a 5.9% price loss. Over one year, holders receive coupons, and the total return would be about a 1% loss. It's a far cry from the steep fixed-income drawdowns beginning in August 2020, back when duration was higher and starting yields were much lower.
Why Stocks Might Finally Care About the Bond Market
Technically, however, quarter-century highs in the 10-year rate, and likely all-time highs in some other sovereign markets, would have major intermarket implications. While it’s true that the S&P 500 was gangbusters during the 1990s, when $TNX averaged in the mid-6s, traders know that it’s the level, direction, and pace of yield changes that matter. Quickly rising borrowing rates would be very different from the steadily falling yields amid the dot-com boom.
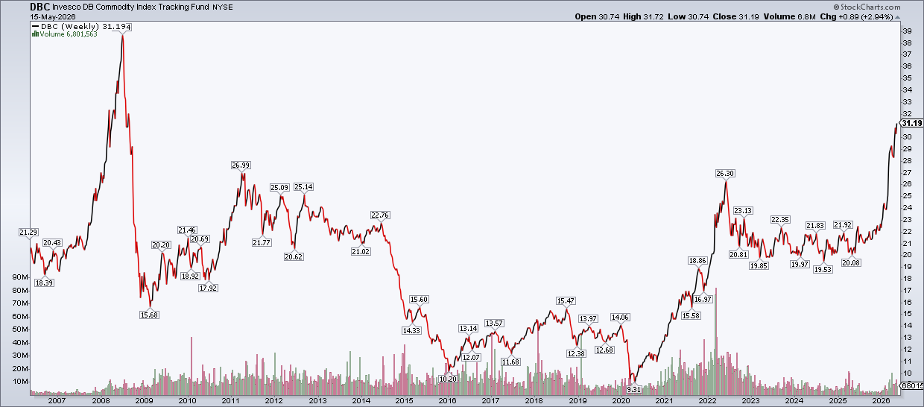
Commodities, meanwhile, would keep catching a bid if traditional inflationary intermarket relationships hold. The past few years have reminded traders that 'commodities' is not a monolith. Precious metals ripped in 2025 but have ceded alpha to oil this year. For a time in 2022, agricultural commodities were in the bullish spotlight.
Today, there are ETFs to play so many corners of the resource trade. Still, sometimes simplicity wins out. The Invesco DB Commodity Tracking Fund (DBC) closed last week at its best level since 2008.
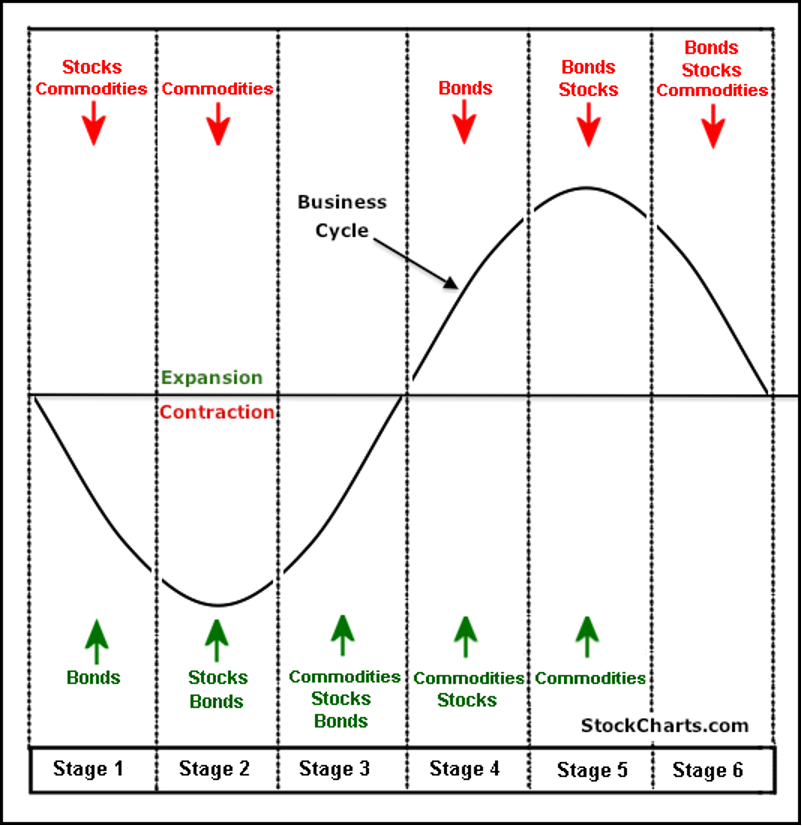
The Economic Cycle Warning
We can’t detail intermarket analysis without relating cross-asset relationships to the business cycle. As Kevin Warsh succeeds Jerome Powell as Fed Chair this week, his first major test is at hand.
According to the intermarket chart below, there’s a real threat of the U.S. economy being in the least favorable Stage 5, or at least in the later innings of Stage 4. Commodities have been on the boil, bonds have been sold, and equities are back to focusing on the Treasury market.
The intermarket scenario is not rosy. What has worked, however, is the AI trade. And traders will return to that narrative Wednesday night when NVIDIA (NVDA) reports Q1 results. Walmart (WMT) and other retailers will then offer a consumer update, which may not be as inspiring as Jensen Huang’s comments.
The Bottom Line
Investors will be well-served by boning up on intermarket analysis 101 this summer. Bonds have taken it on the chin since late February; stocks took a spill from last Thursday’s S&P 500 record level; and commodities keep printing cycle highs. Interest rates globally are lifting, too. Kevin Warsh has his first exam, while traders are tested by an ominous intermarket backdrop. For now, watch that 30-year.
Disclaimer: This blog is for educational purposes only and should not be construed as financial advice. The ideas and strategies should never be used without first assessing your own personal and financial situation, or without consulting a financial professional.