Inflation Momentum Points to a New Up Leg in Yields

A couple of weeks ago, I noted that the gold/bond ratio was starting to look fatigued. That matters, because downside reversals in this relationship have historically aligned with intermediate‑to‑primary trend buying opportunities for bonds. Even if such a signal had materialized, I was only expecting a modest rally, since it would have represented a counter‑secular move, typically weaker and shorter‑lived by nature.
As it stands, no reversal signal has been triggered. Instead, other indicators now strongly suggest that bond yields are poised to break above their multi-year trading range, making the final two weeks of May crucial for the market's direction.
Bond Yields and the CPI
The dominant force shaping interest rates is, without question, inflation or the absence of it. Inflation erodes the purchasing power of fixed coupon payments, forcing the prices of outstanding bonds lower. Because yields move inversely to prices, rising inflation pushes rates higher as investors demand compensation for that loss of purchasing power. The more intense and persistent the inflation pressure, the greater the damage to bond prices, and vice versa.
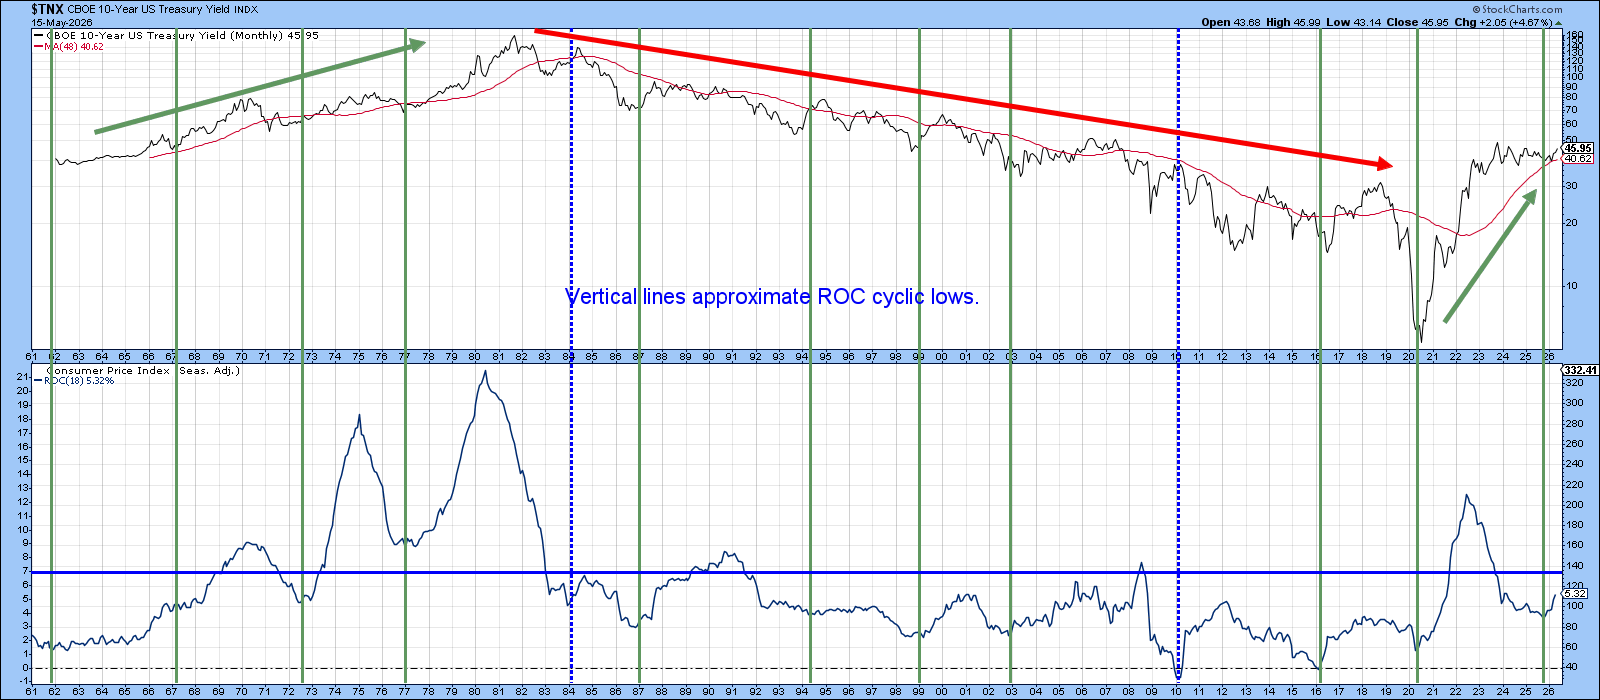
Chart 1 compares the 18‑month ROC of the CPI with the yield on 30‑year Treasuries. The CPI scale appears on the left axis. Using hindsight, the vertical lines mark approximate cyclical lows in CPI momentum. When these lows are aligned with the yield itself, it becomes clear that, in most cases, yields rise.
The red and green arrows denote the prevailing secular trend. Note that “bullish” CPI signals produce far stronger yield advances during a secular bull market than during a secular bear. In fact, the only false positives in the past 65 years occurred during secular bear phases, highlighted with dashed blue lines.
The technical evidence now argues that a secular bull market in yields is underway. With the ROC appearing to have bottomed and the yield itself rebounding from its 48‑month MA, the CPI backdrop strongly supports the case for a new and important up‑leg in interest rates.
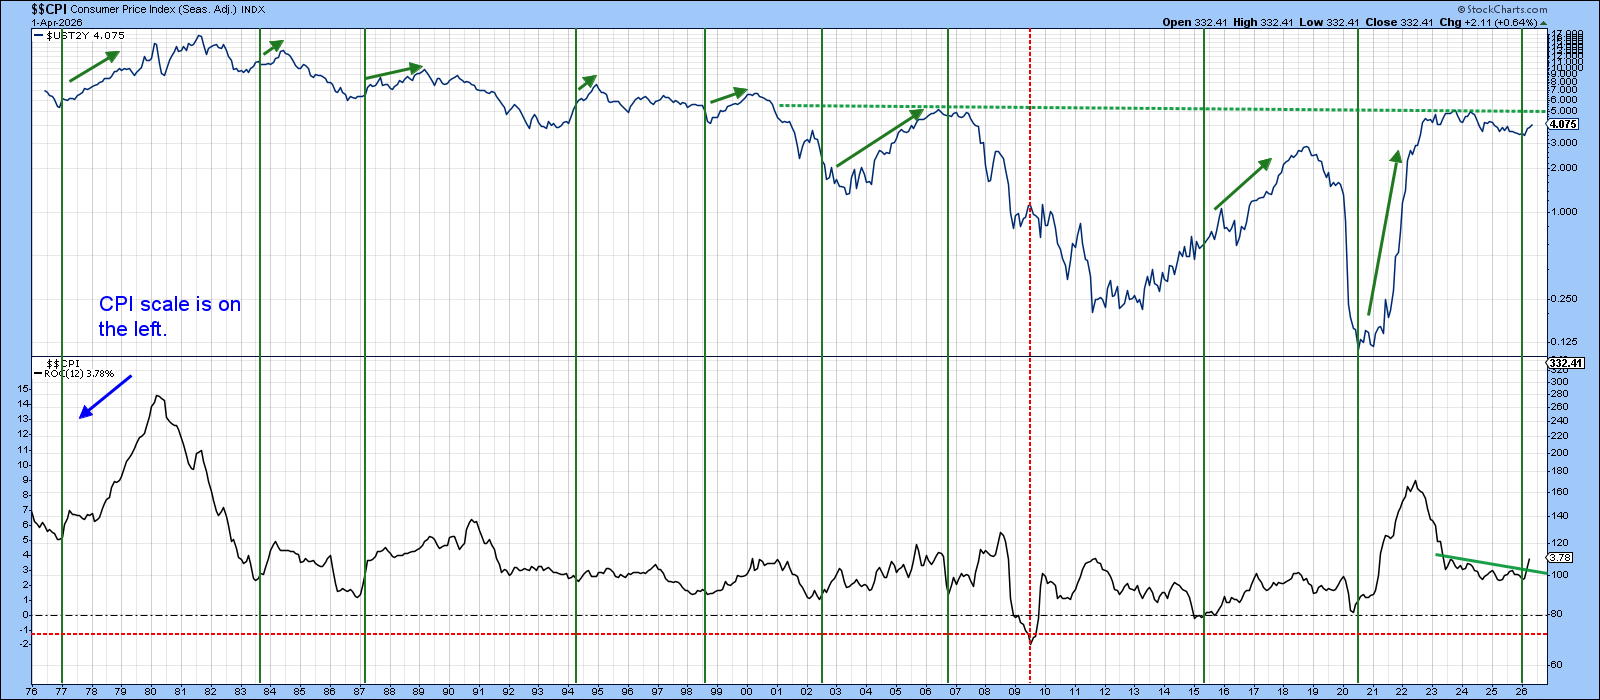
A similar comparison between the 2‑year yield and the 12‑month ROC of the CPI is shown in Chart 2. As before, the vertical lines mark CPI momentum lows identified with the benefit of hindsight. Over the past couple of years, CPI momentum has been locked in a trading range. However, April’s data produced an upside breakout, strongly implying that this series has now completed its cyclical bottom.
We cannot yet know how long CPI momentum will advance or how far it will carry. What we do know is that the 2‑year yield, being market‑driven, consistently leads the committee‑set Fed Funds rate. With CPI momentum turning up and the 2‑year already responding, the message is clear: the next policy move is far more likely to be up than down.
Rates are Rising on a Global Basis
Chart 3 widens the aperture to include international yields. The 10‑year benchmarks for the U.K., Germany, and Japan have all broken out to new cyclical highs and are now leading the U.S. 10‑year, which is currently pressing against a three‑year resistance trendline. Given the clear upside resolutions abroad, it is difficult to imagine the U.S. market bucking what has become a broadly synchronized global trend.
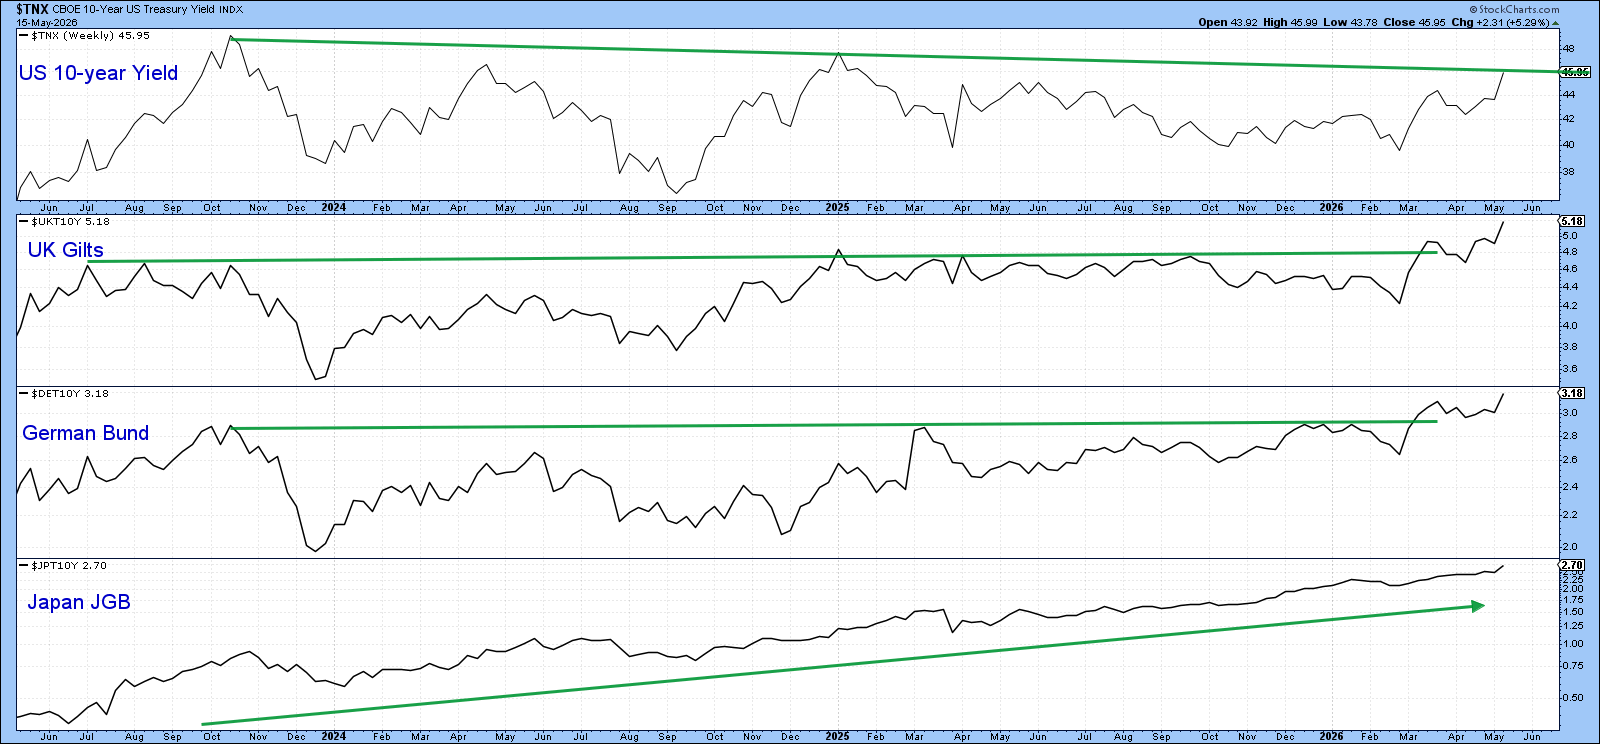
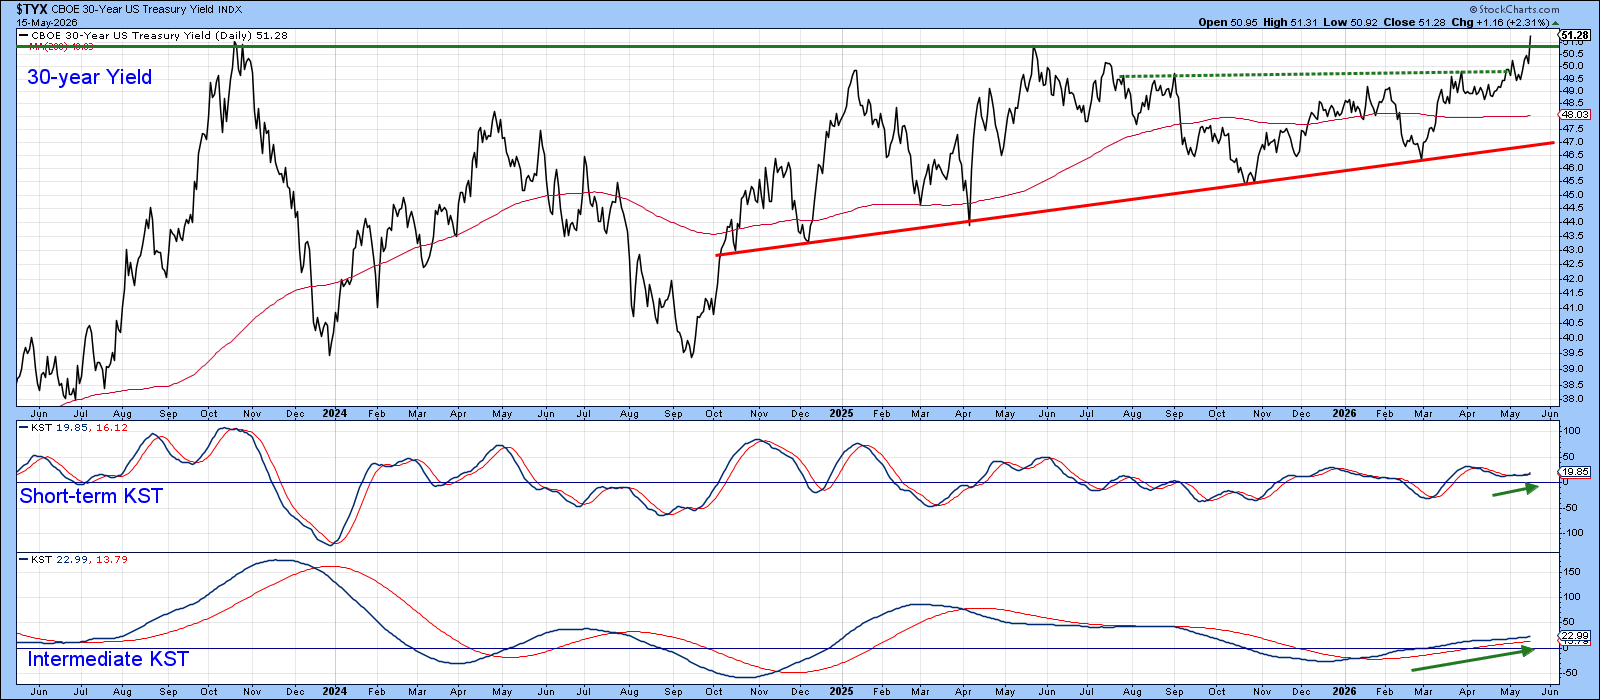
Chart 4 shows that the 30‑year yield closed last Friday at a marginal new cyclical high. It is obviously important for that breakout to hold, which is why next week’s action carries considerable weight. The yield has already pushed above the dashed green trendline, marking the neckline of an inverse head‑and‑shoulders pattern, and both momentum series remain mildly positive. Taken together, these factors argue that a meaningful extension of the secular bull market in yields, and the corresponding bear market in bond prices, appears increasingly likely.
Good luck and good charting,
Martin J. Pring
The views expressed in this article are those of the author and do not necessarily reflect the position or opinion of Pring Turner Capital Group of Walnut Creek or its affiliates. The Six Stages of the Business Cycle are followed each month in Martin Pring’s Intermarket Review.