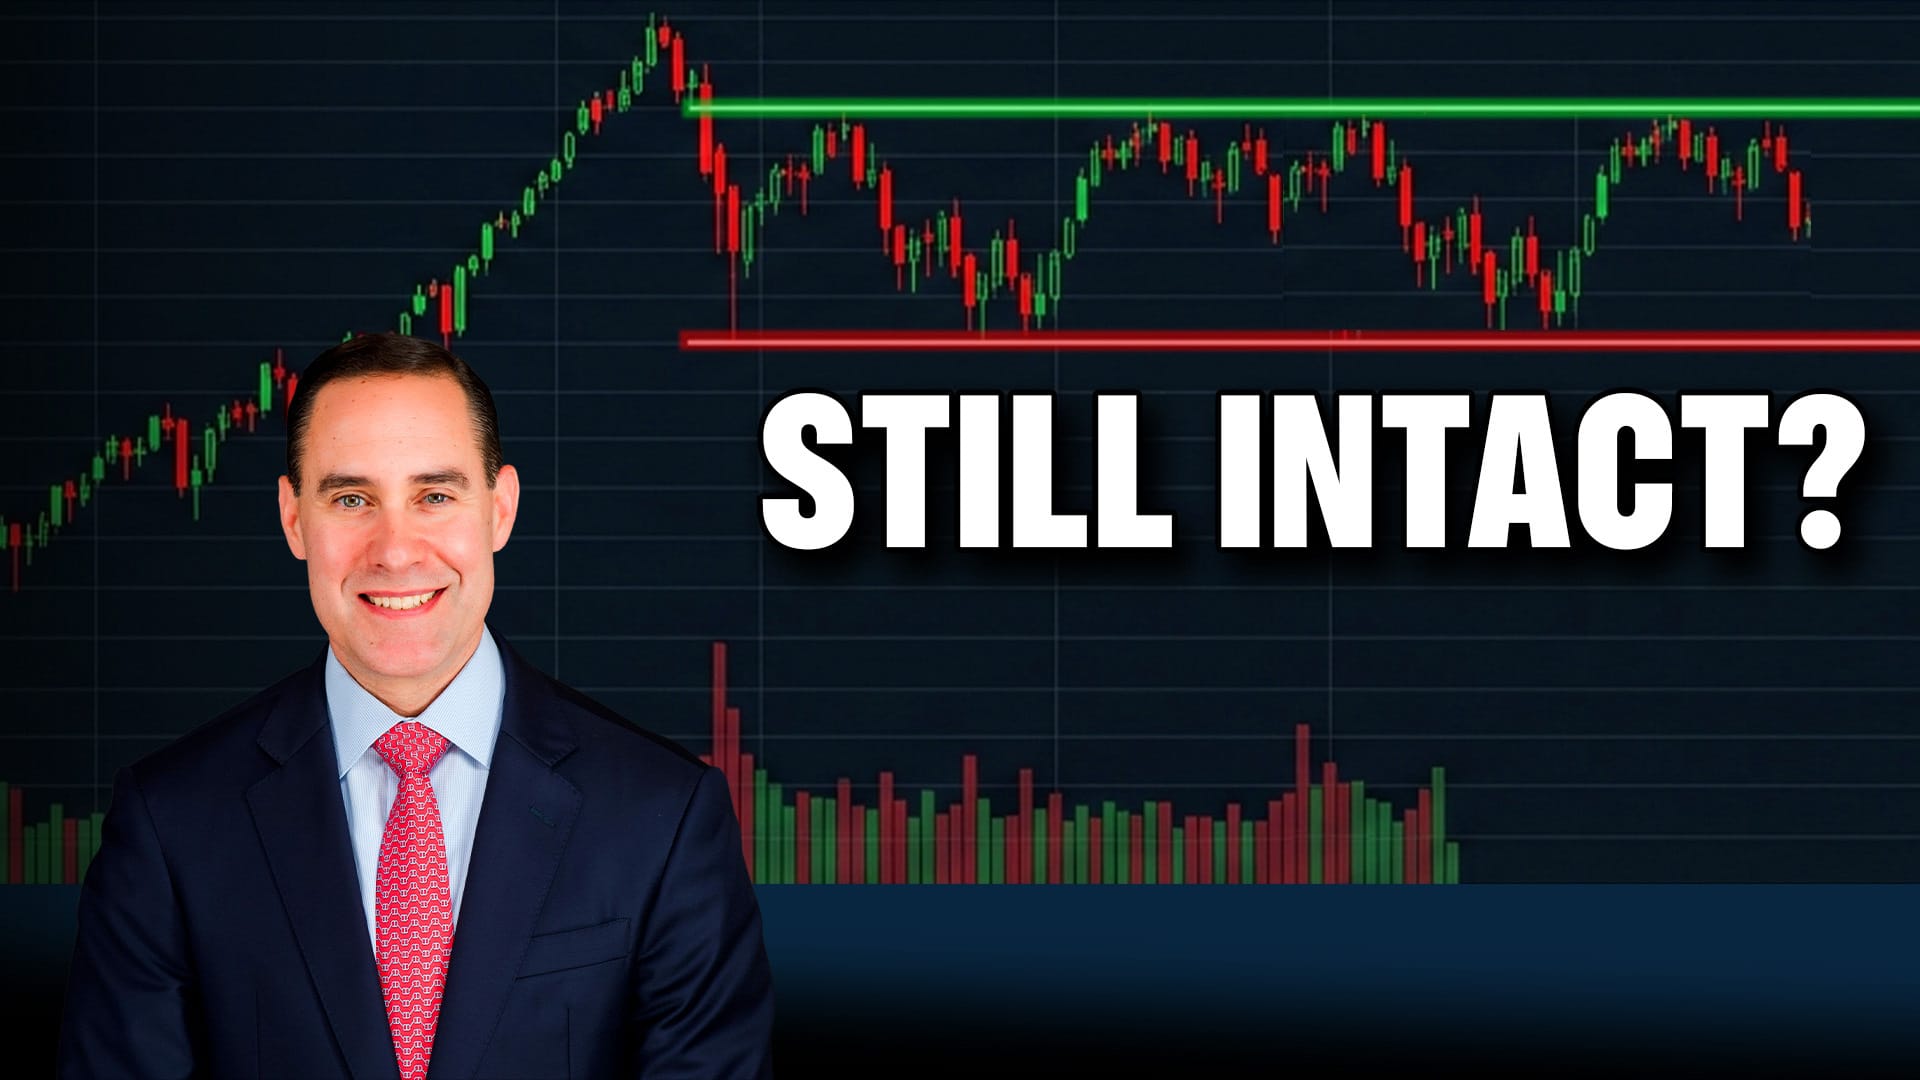
Beyond the Headlines: Two Charts That Could Matter More than New Highs

Key Takeaways
- The S&P 500 and Nasdaq may be at new highs, but not every part of the stock market is participating.
- Transports took a big hit, raising questions about economic strength.
- Real Estate pulled back, but the trend may not be broken yet.
The S&P 500 ($SPX) and Nasdaq Composite ($COMPQ) closed at new highs. Tesla (TSLA) surged after earnings, semiconductors keep on rising, and Bitcoin broke through a key resistance level. On the surface, it looked like a bullish day in the stock market. If you look under the hood, however, a different narrative starts to emerge.
Not Every Group Joined the Party
The Dow Transports ($TRAN), which had a strong run higher, fell 8.40% on Wednesday. Most of that move came from the price action in Avis Budget Group (CAR), which plunged almost 38% after its sharp runup.
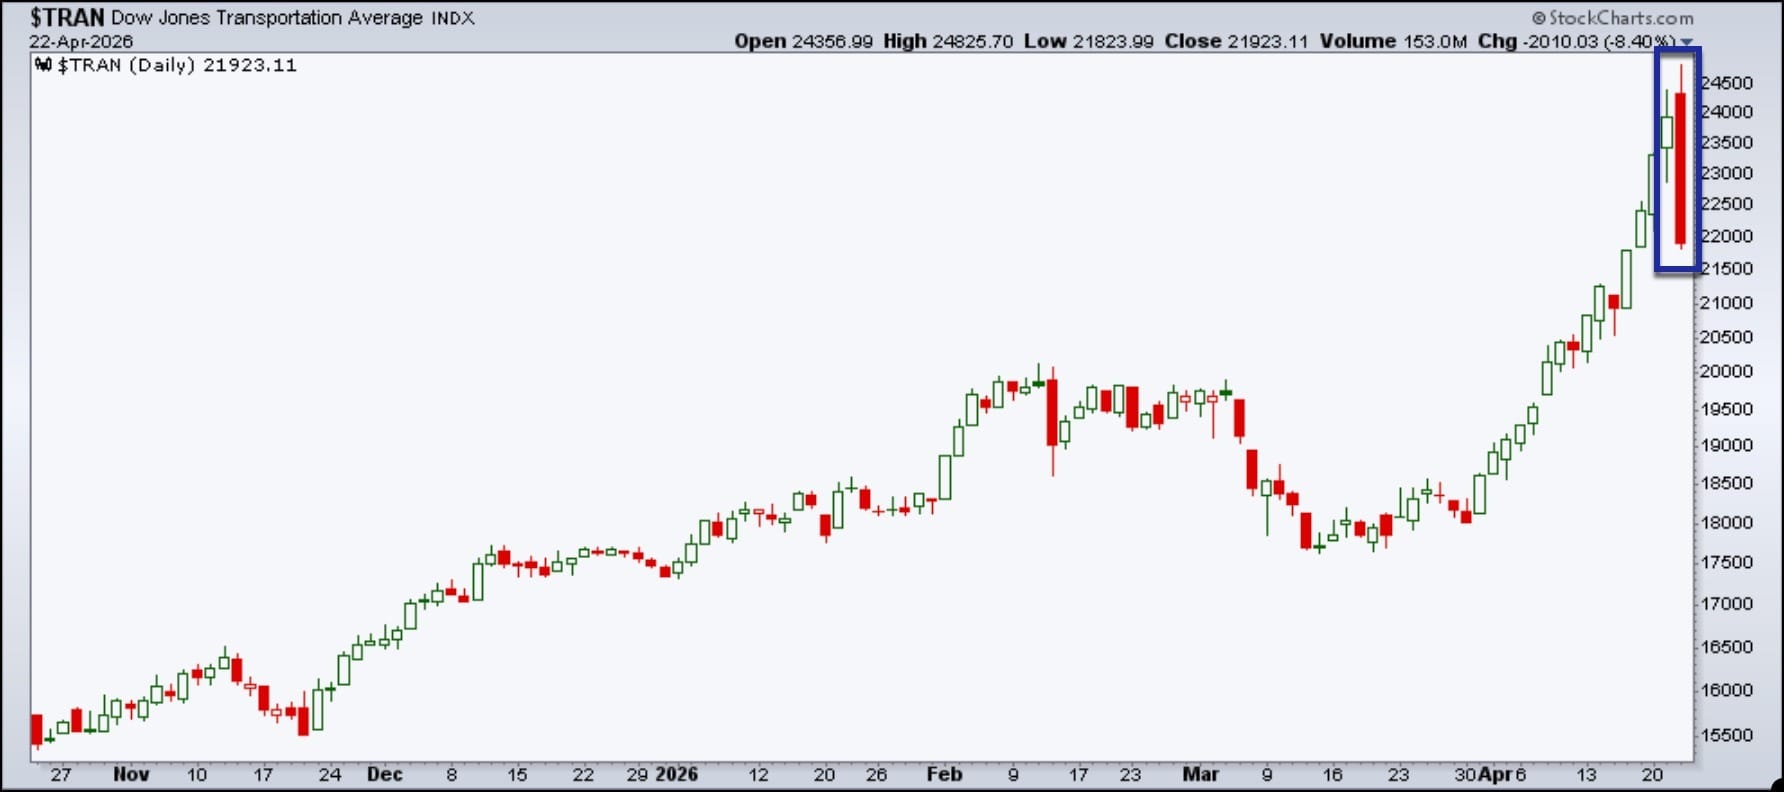
That’s quite the bearish engulfing pattern, a signal that, at least in the short-term, sellers gained control.
It wasn’t just CAR that brought the Dow Transports down. A look at the Dow Transports MarketCarpet shows weakness across other transportation names.
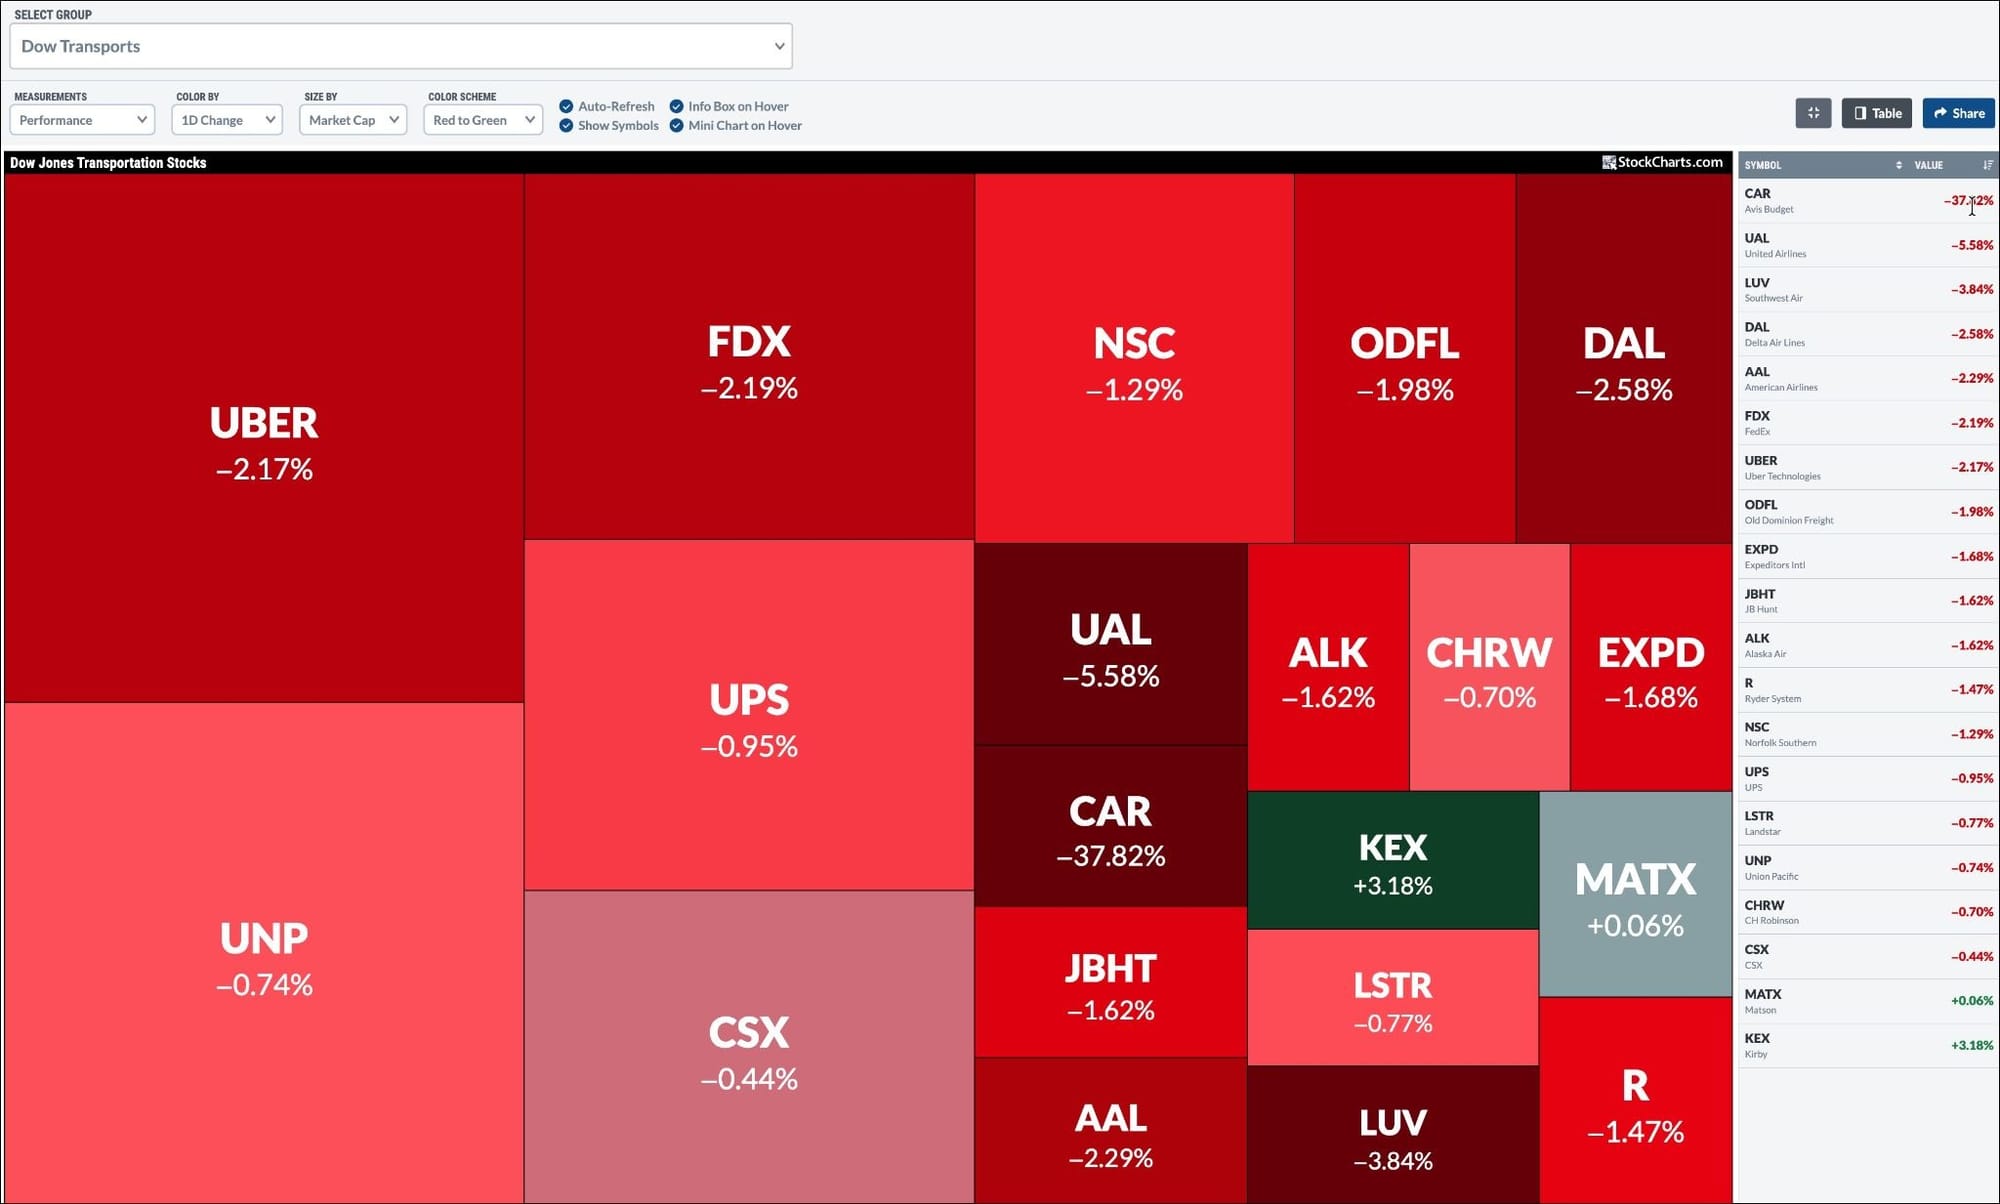
Airlines, delivery services, and other transport stocks were under pressure. Companies in the transportation industry group are sensitive to rising fuel costs. It’s also possible that the easing of the short squeeze in CAR may have set off a domino effect in a group that was starting to look overbought.
One day’s price action doesn’t mean the bull run is over, but it's worth keeping on your radar.
Another hard-hit asset group was Real Estate. The decline was nowhere near as dramatic as what we saw in Transports, but it’s worth noting. Real Estate was the worst-performing sector on Wednesday.
The Real Estate Select Sector SPDR ETF (XLRE) was moving sideways for most of the past year. In April, the sector began to show signs of strength and pushed above its early March highs. Over the last two trading days, the ETF fell by more than 2.50%.
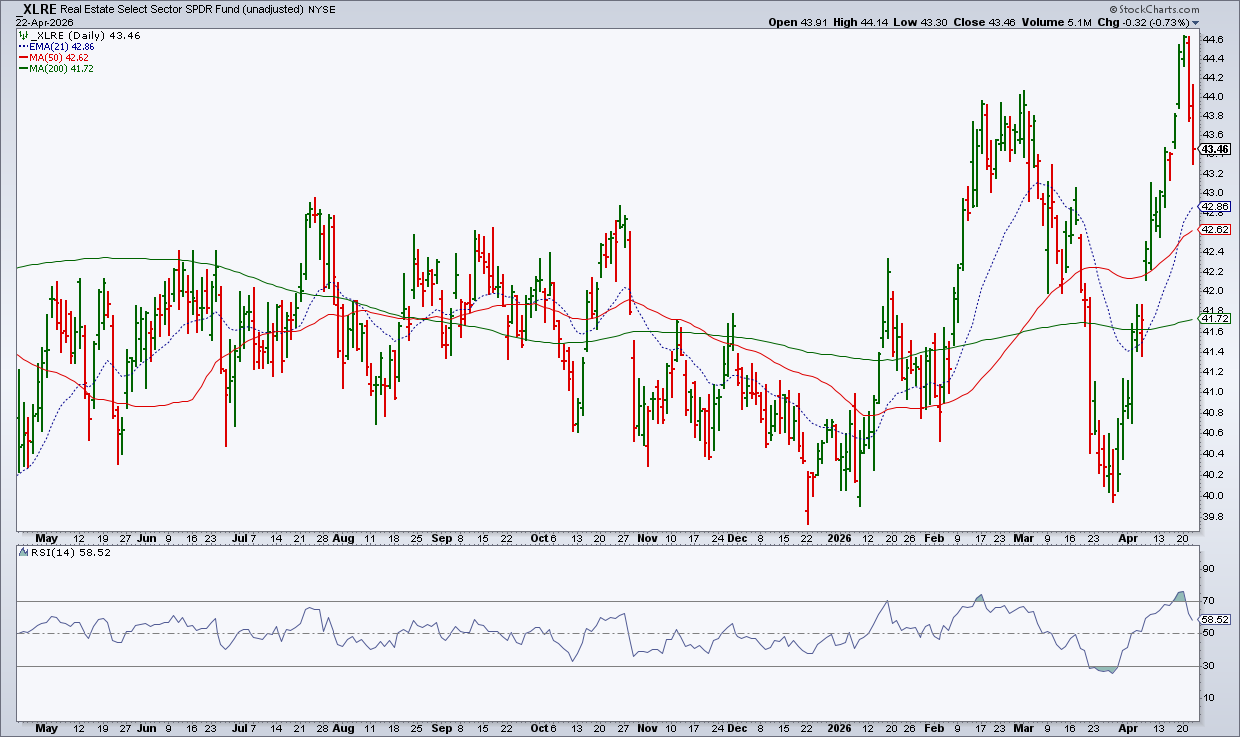
Despite the selloff in the last two days, the chart hasn’t broken down. XLRE is trading above its 21-day exponential moving average (EMA). Its Relative Strength Index (RSI) has fallen below overbought levels, but it’s still above 50, an indication that it still has some momentum behind it.
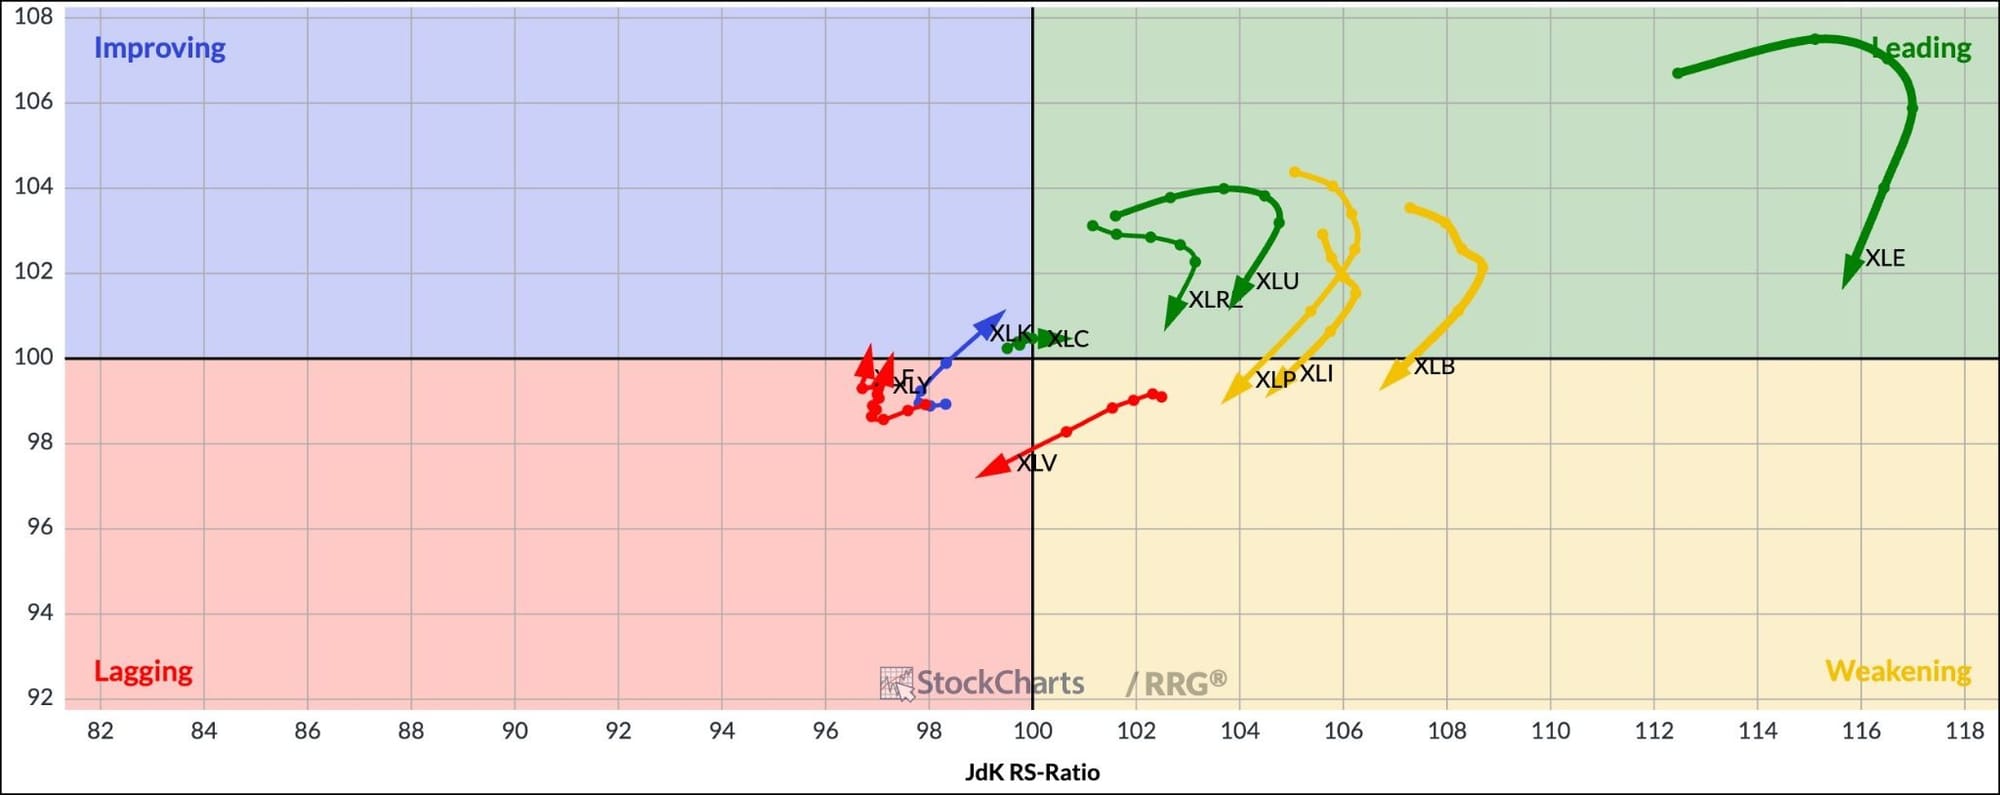
XLRE, which made its way to the top five sectors last week, is, from a weekly perspective, still in the Leading quadrant of the RRG chart. On the daily chart, it has probably slipped into the Lagging quadrant. It’s worth following the sector’s path during the course of the week.
The Bottom Line
The biggest takeaway from what we’ve seen in the stock market’s price structure this week is that a headline can trigger sharp price swings. The Dow Transports and the Real Estate sector provide valuable clues about the health of the economy, business activity, and the consumer.
While the broader indexes may be heading higher, it’s worth keeping a close watch on the charts of asset groups that are heading in the opposite direction. Right now, they may be the Dow Transports and the Real Estate sector, but tomorrow it may be something else.
Review the Market Summary page regularly to see which asset groups are going against the grain. Then dig a little deeper and analyze the components of the asset groups. Once you see certain themes emerging from your analysis, you’ll be better able to understand the market, which, in turn, will help you make intelligent investing decisions.
Disclaimer: This blog is for educational purposes only and should not be construed as financial advice. The ideas and strategies should never be used without first assessing your own personal and financial situation, or without consulting a financial professional.