The Best Five Sectors This Week #62
Key Takeaways
- Defensive sectors underperformed as the S&P 500 surged over 4%, widening the gap versus the index.
- Energy, Materials, and Industrials lead sector rankings, while Real Estate entered the top five.
- Weekly RRG shows slowing momentum for top sectors, while Technology gains traction in the lagging quadrant.
- The S&P 500’s rapid rally challenges trend-following strategies, leaving defensive portfolios struggling to keep pace.
Defensive Sectors Lag as S&P 500 Surges
After a week where the S&P 500 soared more than 4%, the sector rankings have shifted, highlighting the challenges of a defensive portfolio in a rapidly rising market.
The defensive tilt of the top five sectors has led to significant underperformance, widening the gap versus the S&P 500. The big question now is, "Will the top five sectors shift toward a more offensive stance, or will the S&P 500 cool off and realign with the defensive leaders?"
Sector Ranking Changes
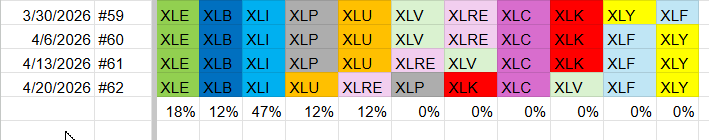
The top five sectors saw minor changes this week. Energy remains in the lead, followed by Materials and Industrials — no change in the top three. Utilities climbed from fifth to fourth, while Real Estate entered the top five, pushing Consumer Staples down to sixth.
Technology made a notable jump from ninth to seventh, pushing Health Care down to ninth. Communication Services held steady at eighth, with Financials and Consumer Discretionary rounding out the bottom at tenth and eleventh.
- (1) Energy - XLE [18%]
- (2) Materials - XLB [12%]
- (3) Industrials - XLI [47%]
- (5) Utilities - XLU [12%]*
- (6) Real Estate - XLRE [12%]*
- (4) Consumer Staples - XLP*
- (9) Technology - XLK*
- (8) Communication Services - XLC
- (7) Health Care - XLV*
- (10) Financials - XLF
- (11) Consumer Discretionary - XLY
Weekly RRG
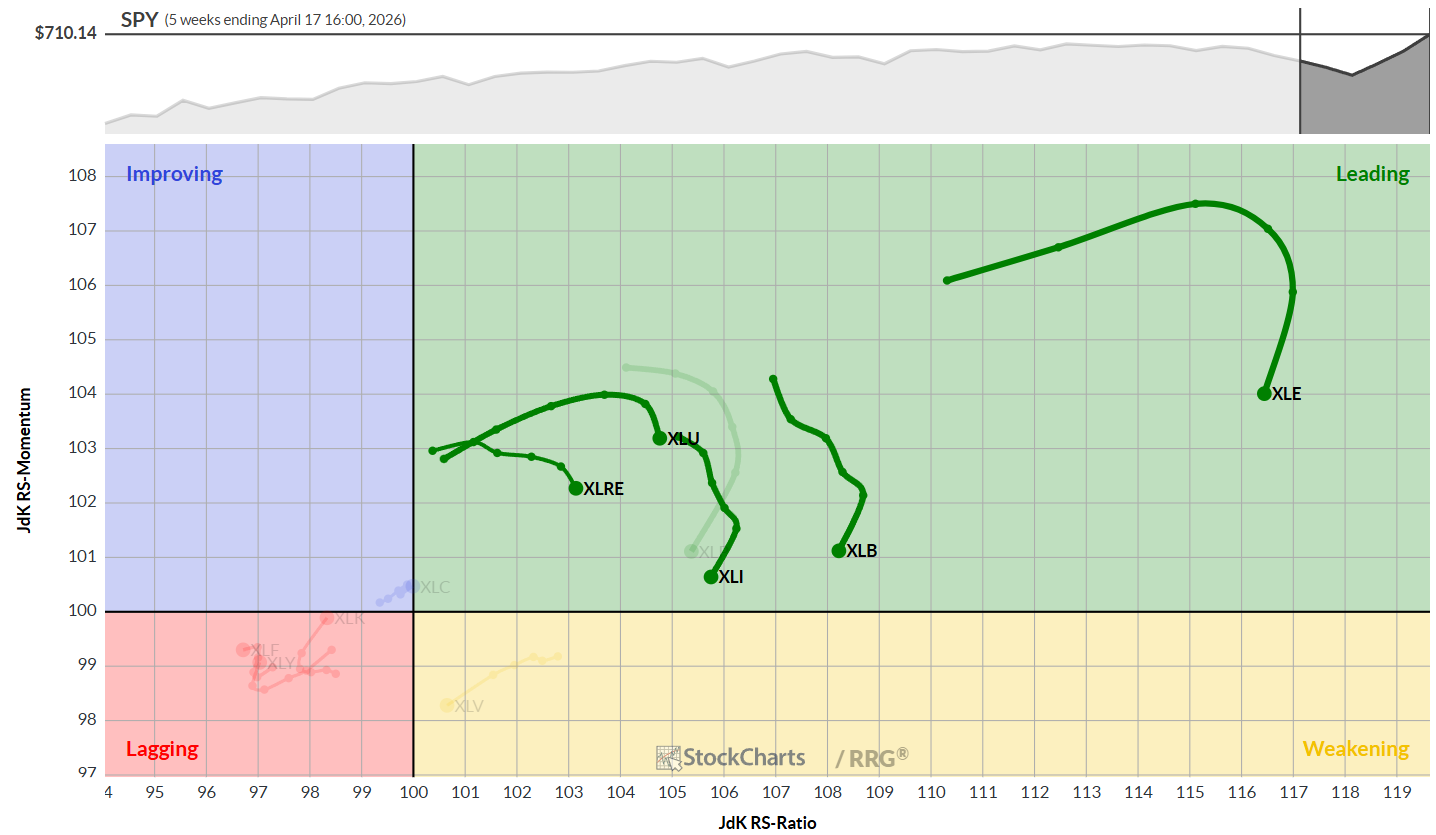
All top five sectors are positioned in the leading quadrant on the weekly Relative Rotation Graph (RRG), including Real Estate, which replaced Consumer Staples.
These sectors are rolling over, indicating a loss of relative momentum, though their RS ratio levels remain strong, suggesting the underlying trends are intact but slowing.
In the lagging quadrant, Technology is beginning to pick up momentum but still inside the lagging quadrant. Communication Services is the only sector closing in on the leading quadrant.
Daily RRG
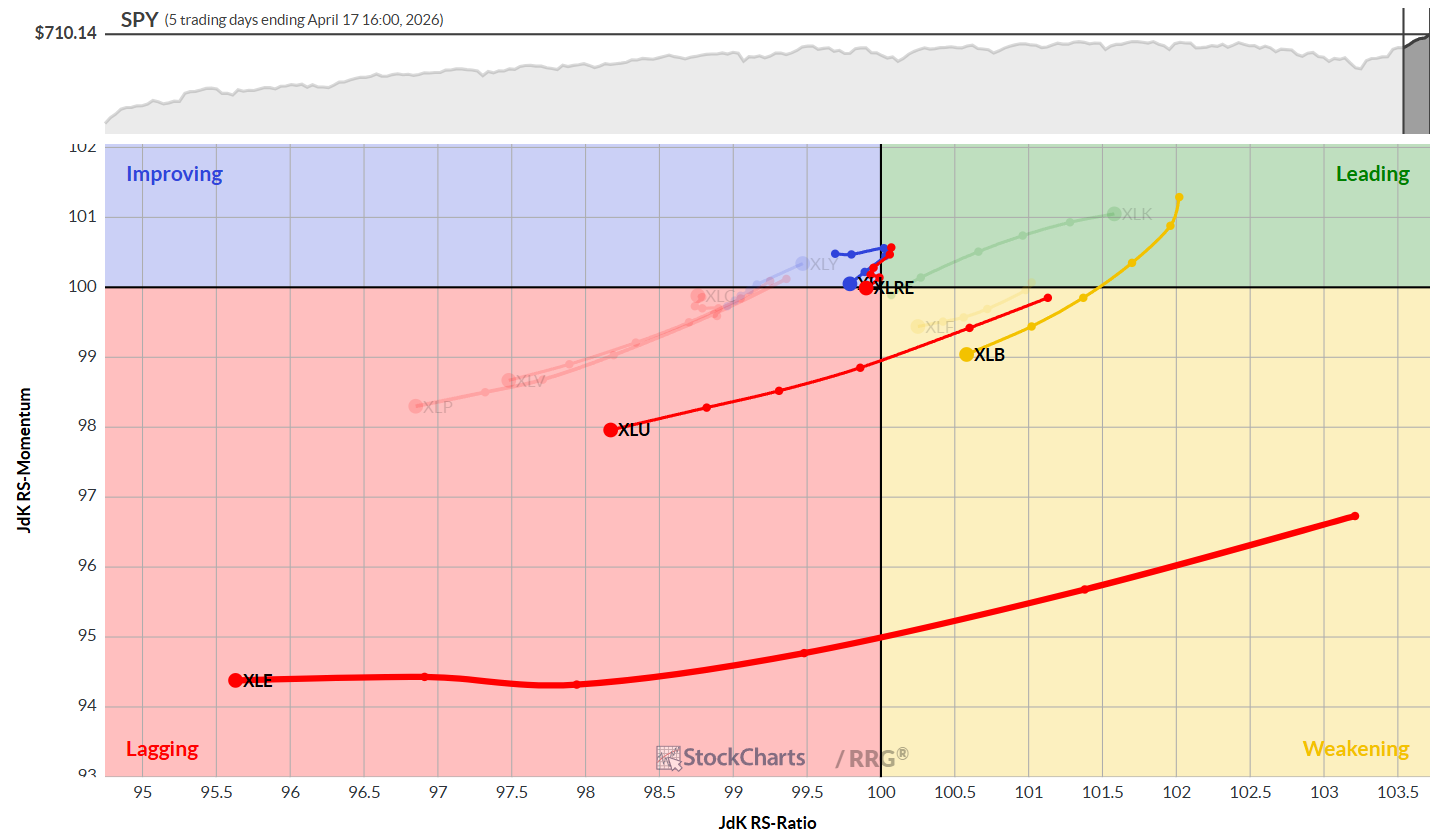
Zooming in on the daily RRG, the picture flips. All top five sectors are heading negatively and either moving toward or already inside the lagging quadrant.
Both Industrials and Real Estate are very close to the center of the chart which means that they are moving in line with the benchmark. Utilities and Energy face the biggest short-term threats.
Despite these moves, the weekly RRG still suggests this is likely a temporary setback. Utilities and Energy have plenty of room to rotate back into leadership, and the overall RRG composition still points to a defensive posture.
Sector Highlights
Energy
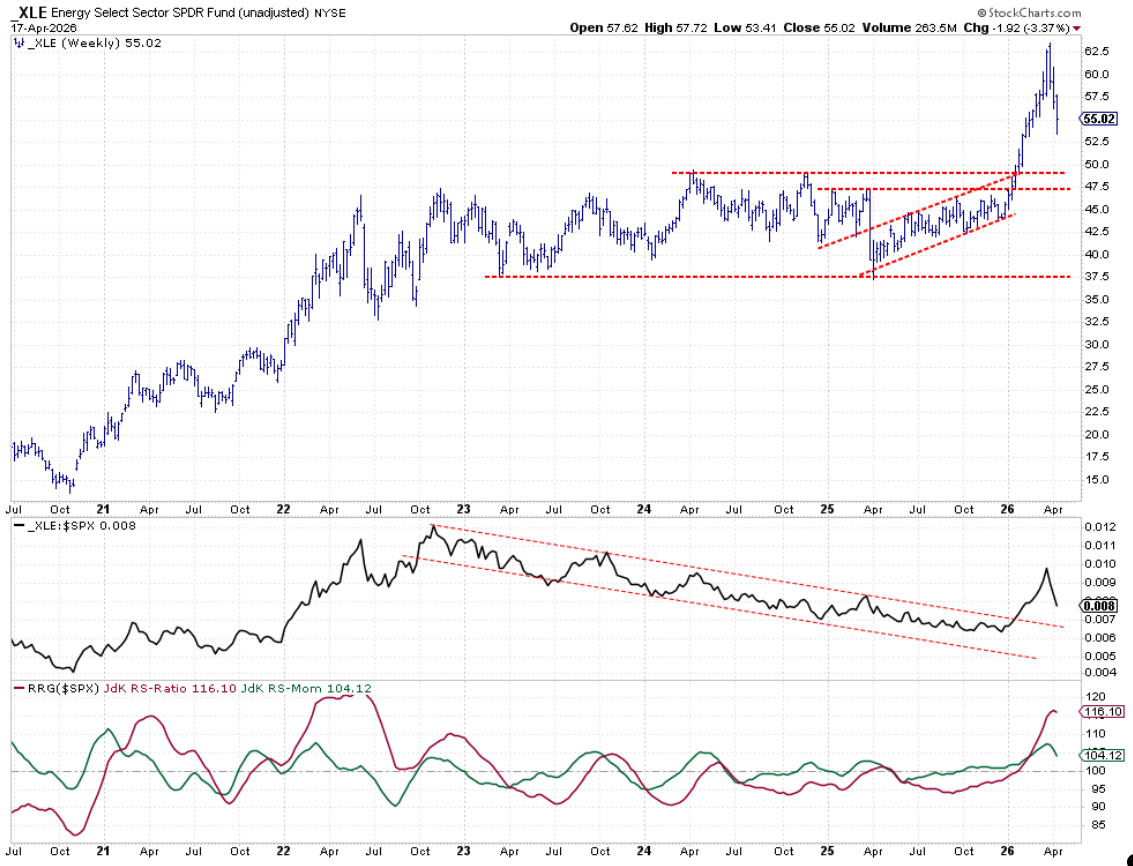
The Energy sector is declining in both price and relative strength but remains in an uptrend, having broken out of its falling trend on the relative strength chart. Both RRG lines are well above 100, keeping energy in the leading quadrant with potential for a renewed uptrend. A new low is needed on both price and relative strength charts to set the stage for the next move higher.
Materials
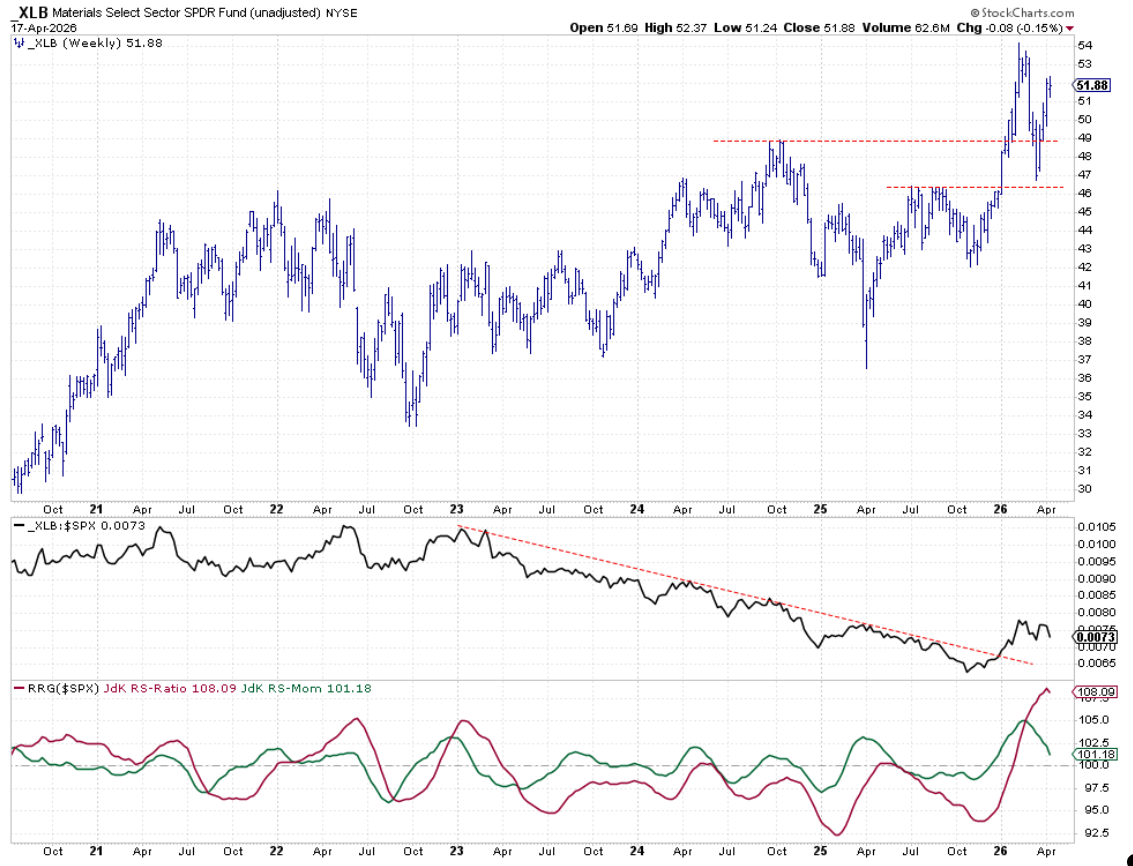
After dipping to support around 46, Materials is recovering and heading toward its previous high near 54. The relative strength line has flattened, causing some loss of momentum, but the RS-ratio remains historically high. If relative strength stabilizes and resumes its climb, Materials will stay solidly in the leading quadrant.
Industrials
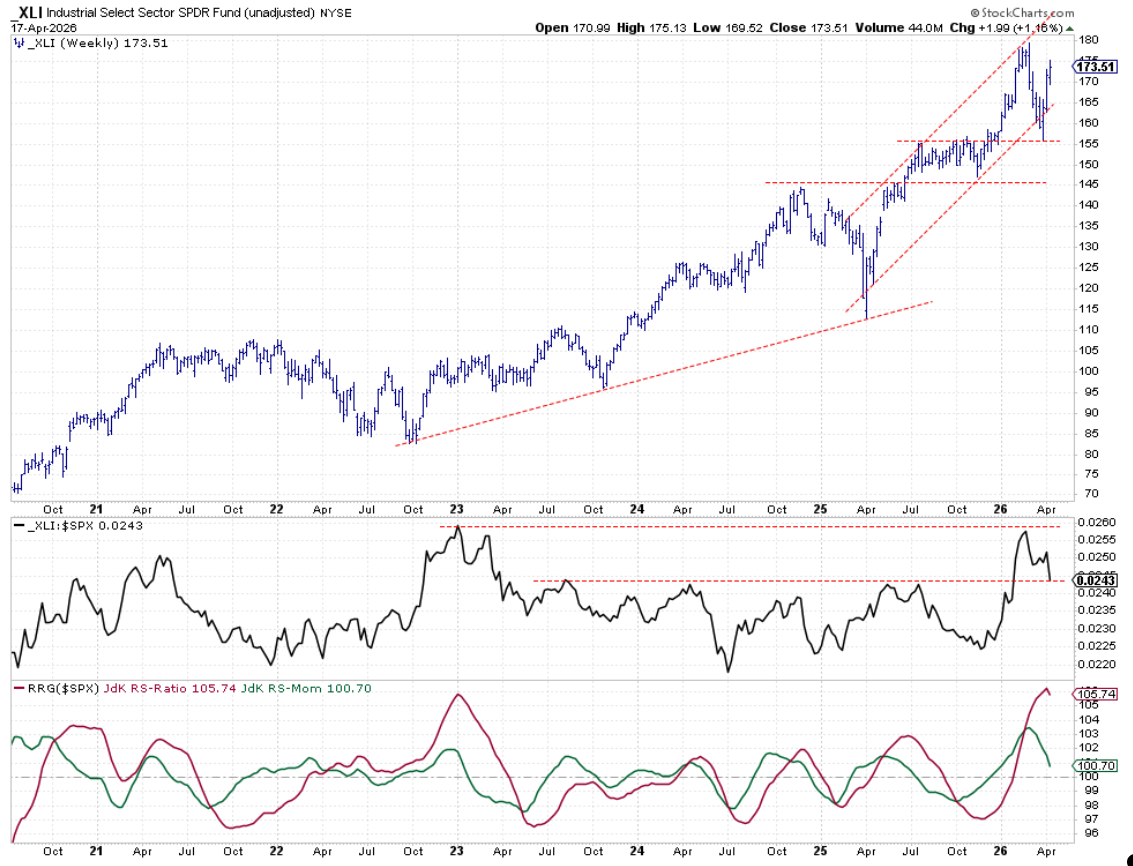
The Industrials sector has re-entered its rising channel and is approaching its previous high, just below 180. The RS line is at a key support level; holding here is crucial for maintaining positive relative strength. As a result, relative momentum is declining, but the RS-ratio is still strong, keeping the door open for a leading-weakening-leading rotation.
Utilities
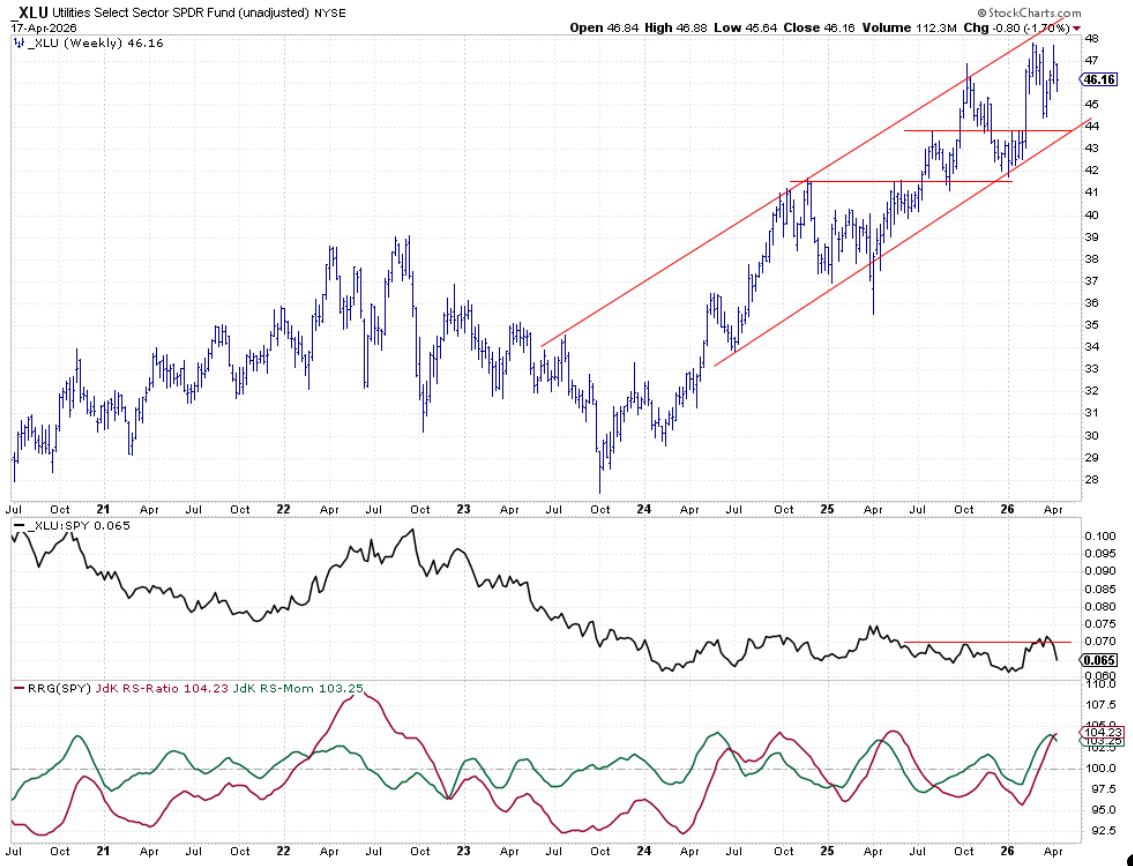
The Utilities sector continues within its rising channel, trading sideways recently. The RS line bounced off resistance, causing the RS momentum line to roll over. The RRG lines remain above 100, keeping Utilities in the leading quadrant for now.
Real Estate
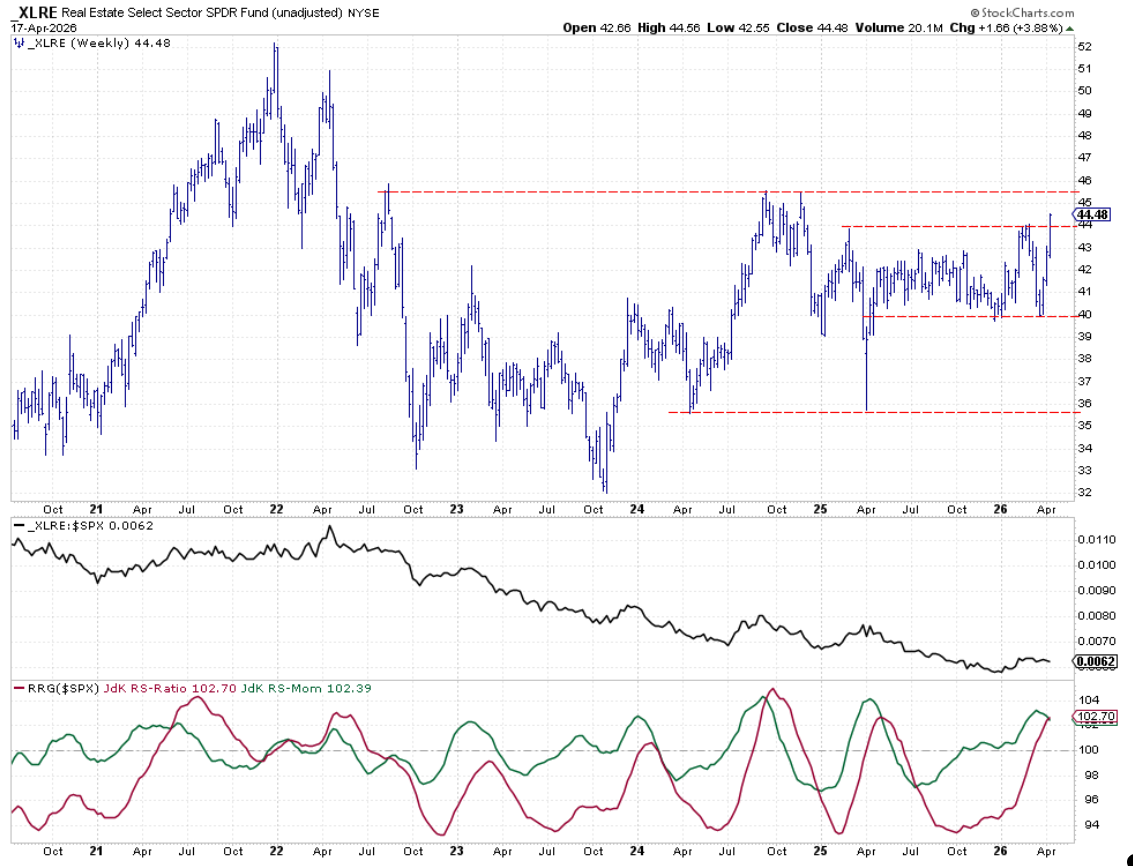
Real Estate, the new entrant in the top five, broke above resistance at 44, showing strength on the price chart. The relative strength line is recovering, and RRG lines have picked up, with the RS-ratio above 100. More confirmation is needed, but real estate’s entry into the top five is well-deserved after its bottom formation.
Portfolio Performance
The recent S&P 500 rally—over 10% in just 13 trading days—has been too swift for most trend-following strategies to capture. This has left defensive portfolios lagging, and it may take time for sector compositions to catch up with the market’s aggressive performance.
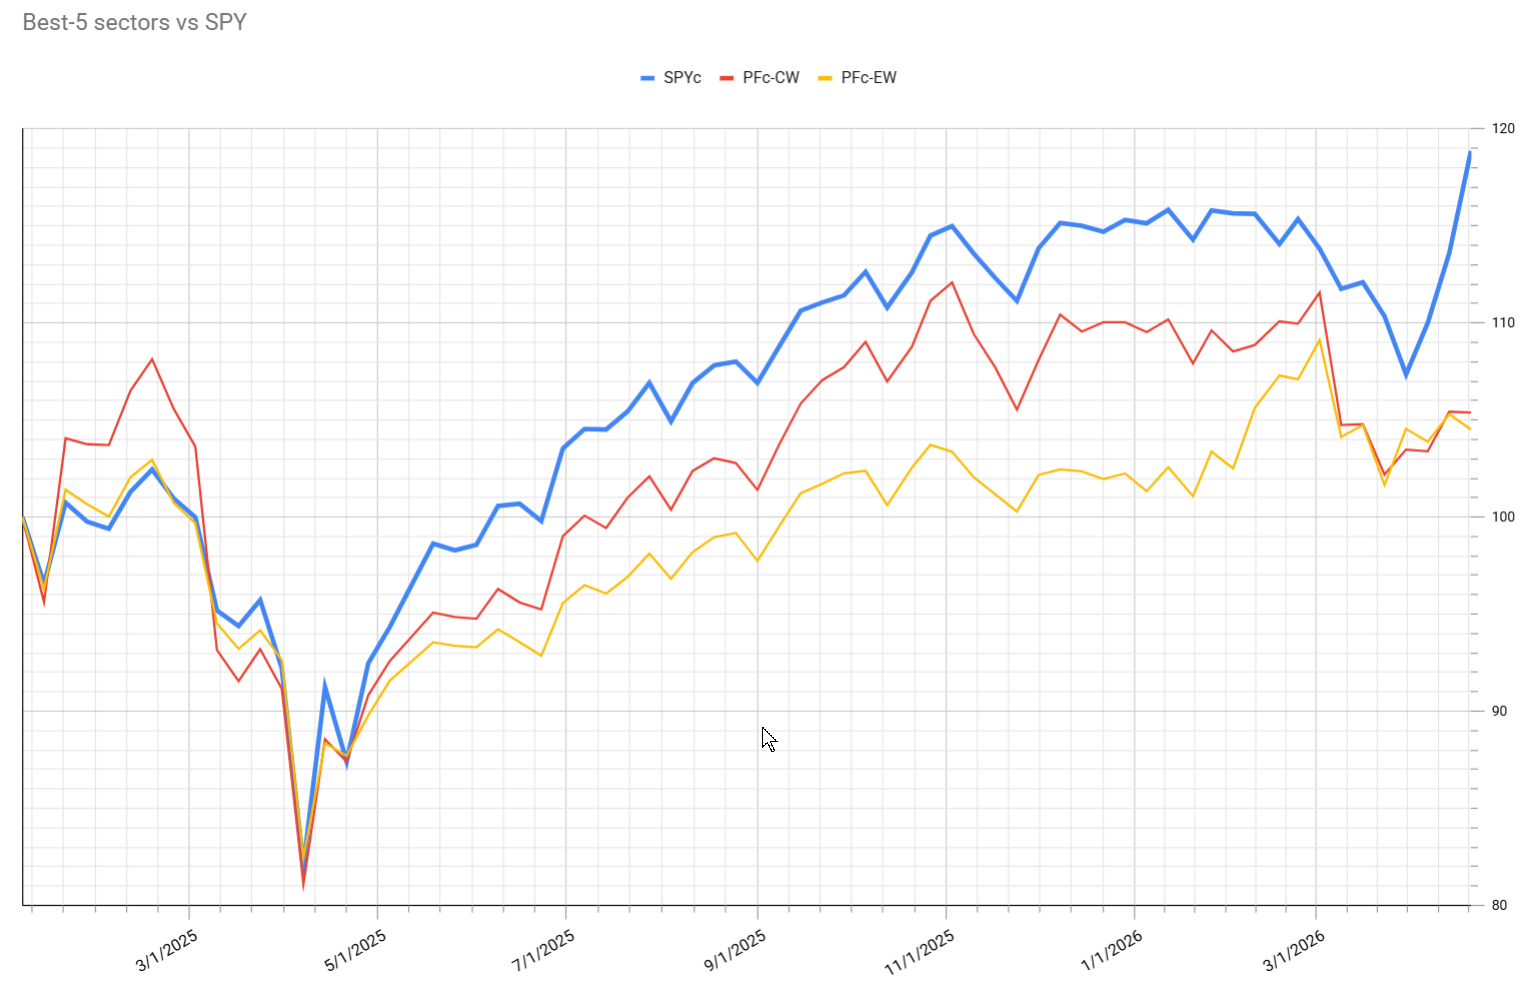
The S&P 500’s rapid rally has been tough on the top five sectors, which have stabilized but can’t keep pace with the index’s speed. The lag relative to the S&P 500 has widened to over 10% in the cap-weighted portfolio and to similar levels in the equal-weight portfolio, matching previous periods of underperformance.
Despite the frustration of lagging for over a year, the long-term tests suggest this strategy can outperform the S&P 500. It’s a challenging period, but the process continues. The goal is to evaluate whether this approach holds value or if adjustments are needed. For now, the strategy remains in place, with an eye on potential changes if warranted.
#StayAlert, -Julius