Stocks Charge Higher: What to Watch After the V-Bottom

Key Takeaways
- The S&P 500 surged nearly 12% in three weeks, pushing its RSI back above 70.
- Gaps, retracements, and earnings season set up a potential near-term pause.
- Despite risks, bullish trends and strong breadth have kept the broader uptrend intact; this article lays out key price levels to monitor.
S&P 500 futures opened lower on Sunday night amid yet another flare-up of geopolitical tensions in the Middle East. The conflict in Iran and doubts over the durability of a peace deal rattled markets, but the damage was modest by the following morning. Stepping back, we can see that a pause in the rally would make sense here.
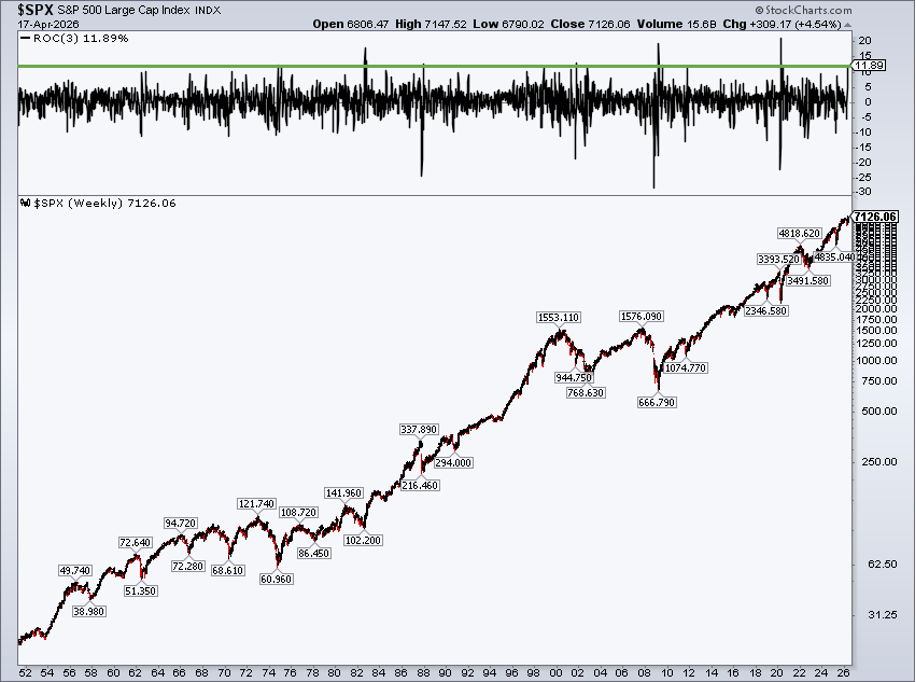
A Rally That Stands Out in History
The S&P 500 is coming off a staggering 11.9% three-week rally. The ascent is viewed in a better context on SharpCharts by applying the Rate of Change (ROC) indicator. On the weekly zoom, we find that the most recent climb to record highs is the 11th best in data going back to 1950 (h/t to Charlie Bilello at Creative Wealth Planning for sifting for that stat).
Carson Group’s Ryan Detrick called out that the SPX is on pace for its third-best April on record, and that’s with still almost two full weeks to go.
Zooming in, the S&P 500’s 12.33% spike over just 13 trading days is its best rally since April 2020, back when stocks had just collapsed during COVID.
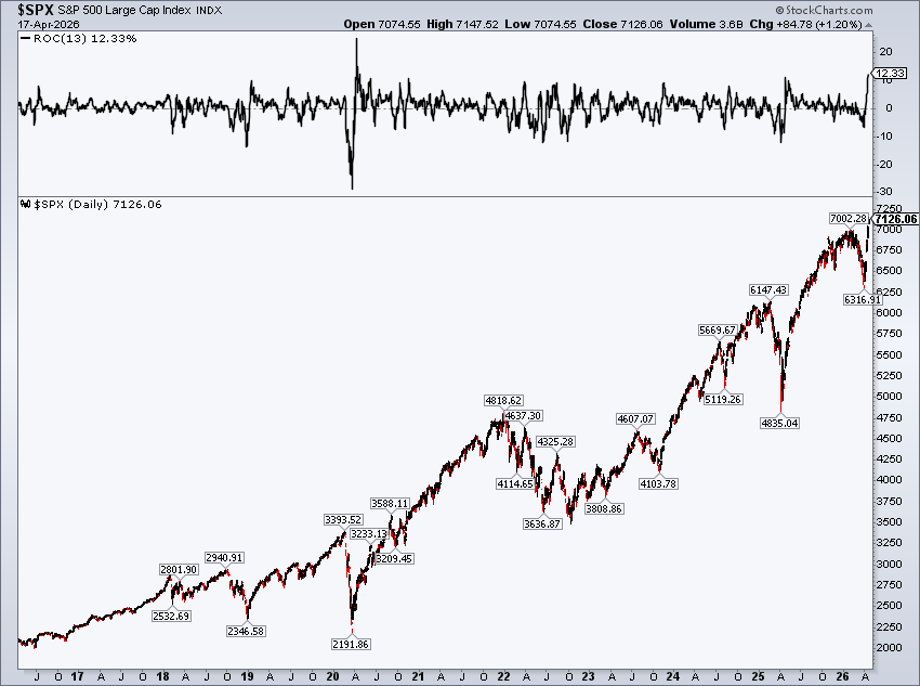
Overbought Conditions, Familiar Outcome?
Unusual this time is that the market only fell 9%, not even a garden-variety correction, before launching to new heights. In the chart below, I took the liberty of adjusting the RSI momentum oscillator from the standard 14 days to 13 and found that the S&P 500 is the most overbought since last July. While there was an early-August dip surrounding a dubious July jobs report, President Trump calling for the dismissal of the Fed’s Lisa Cook, and tariff turmoil, global equities largely kept rallying then.
But will they do the same this go-round? Let’s figure that out.
The Lingering Gap is a Tactical Risk, Not a Big Bear Thesis
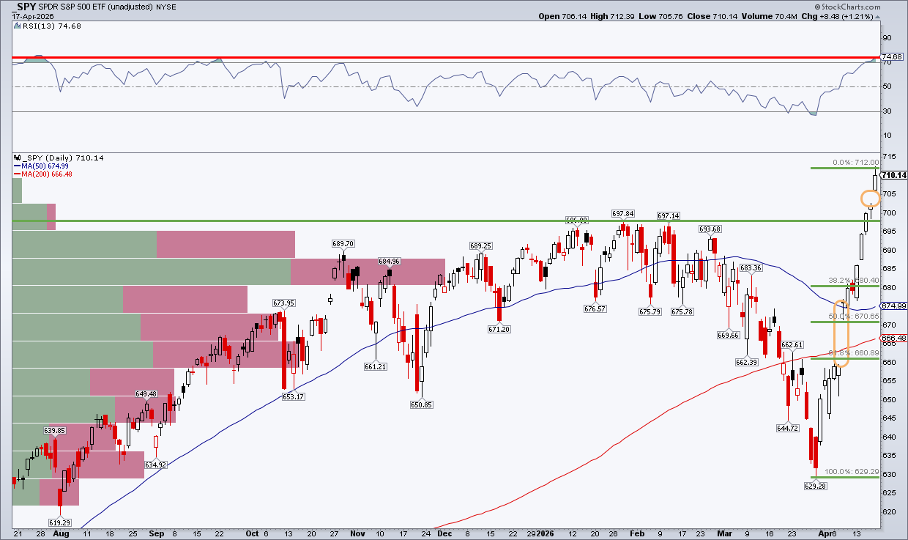
Beginning with the SPDR S&P 500 ETF’s (SPY) daily chart, what jumps out to readers is surely the April 8 gap-up from below $660 to above $676. As a reminder, gaps are measured by the period’s closing price and the subsequent period’s opening price.
The thinking is that there’s unfinished business on the chart. In Japan, they say there’s an open window that must be closed. In Western technical analysis, the presumption is that all gaps must be filled. But that’s one of those Wall Street myths that never seems to die, such as “95% of call options expire worthless.”
Retracement Levels vs. Price Reality
Yes, it’s a near-term bearish indicator, but I’d focus more on price action than banking on what would be a 61.8% retracement of the March–April rally (although it’s curiously fitting that the gap aligns almost precisely with that key retracement level).
Earnings Will Test the Narrative
Looking at the bigger picture this week, it’s now the heart of the Q1 reporting season. Earnings updates from bellwether companies across industries will shed light on what corporate America sees in this world of geopolitical unease, ongoing tariffs, and recalcitrant inflation. This rolling run of macro one-offs appears to be the new normal. At the same time, CEOs and CIOs are battle-tested, given the numerous out-of-left-field crises of late. As always, price action following the earnings event matters more than the top and bottom lines themselves.
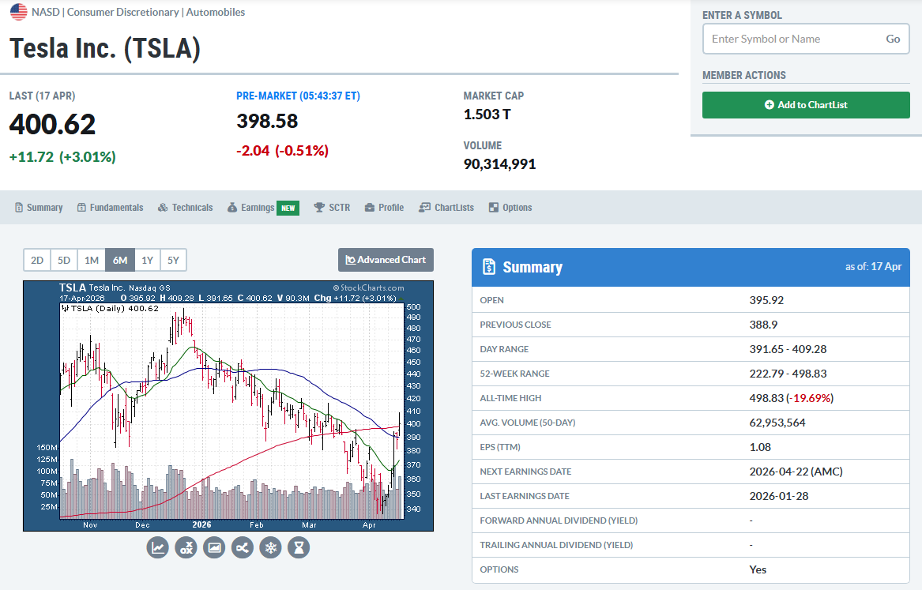
On that note, I’d encourage traders to at least be mindful of earnings release dates. They serve as major volatility catalysts, so tracking them is key to managing risk. Tesla (TSLA), for instance, posts numbers on Wednesday, April 22, AMC. Shares are up 19% from last month’s low and sit right on their 200-day moving average leading into the report. You can view more fundamental and earnings data on the Tesla symbol summary page.
The V-Bottom Still Dictates Trend
Flipping back to SPY, risk-on ignited once Q2 began. Week 2 of April featured a V-bottom confirmation. Now, with Tax Day out of the way and often-bullish trends over the second half of April, SPY’s chart has evolved in the bulls’ favor.
Notice in the earlier chart that the bearish rounded top I had harped on in the early part of the year has been negated. What’s more, former resistance in the $697–698 range is presumably new support. On the weekly chart, a bullish set of “three white soldiers” asserts that the upward march may continue.
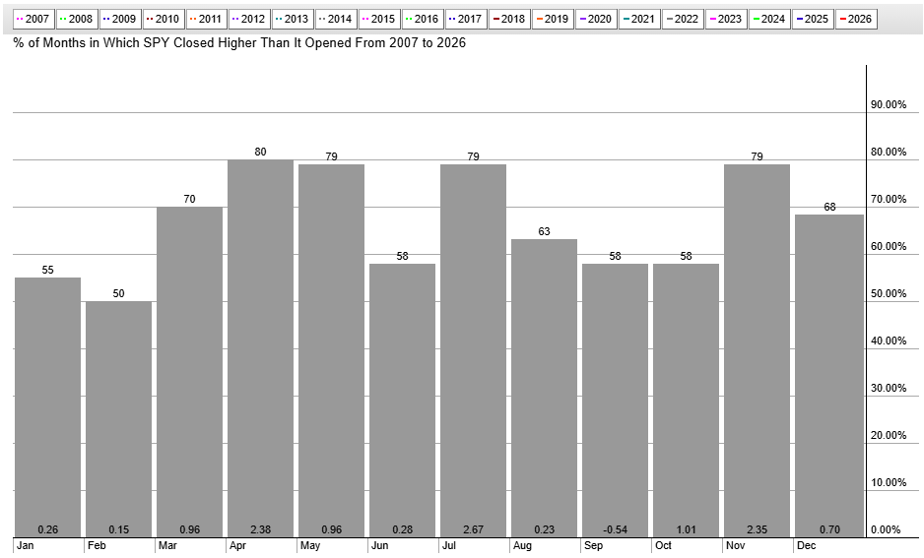
Keep in mind that the April-through-July stretch has been the market’s best period in data going back almost 20 years. Since 2007, April and May sport near-80% win rates, while July’s 2.67% average gain is best among all months. June tends to be more volatile, however.
Breadth Depends on Where You Look: Rotation Is Doing the Heavy Lifting
While there was some handwringing about weak breadth over the weekend, it’s important to note that sector rotation has played a starring role in the recent equity drama. Tech stocks have sprung back to life (Information Technology (XLK) and Real Estate (XLRE) are the only two S&P 500 sector ETFs at 52-week highs coming into this week), and they were notoriously poor performers from October through the March low.
So it makes sense that there are relatively few single-stock 52-week highs. Away from the SPX, breadth is not bad at all. Small-caps (IJR), mid-caps (MDY), and even international stocks (ACWX) settled last Friday at record weekly levels.
The Bottom Line
Traders are on back-and-fill watch this week after a torrid U.S.-led equity rally off the March 30 low. Gaps linger, Fibonacci retracement levels are in play, and earnings season always brings a degree of edginess. But the bulls control the primary trend as we progress through a bullish calendar stretch. For now, go against the V-bottom at your own peril.
Disclaimer: This blog is for educational purposes only and should not be construed as financial advice. The ideas and strategies should never be used without first assessing your own personal and financial situation, or without consulting a financial professional.