Can Earnings Keep the S&P 500 Above 7000? 5 Stocks to Watch
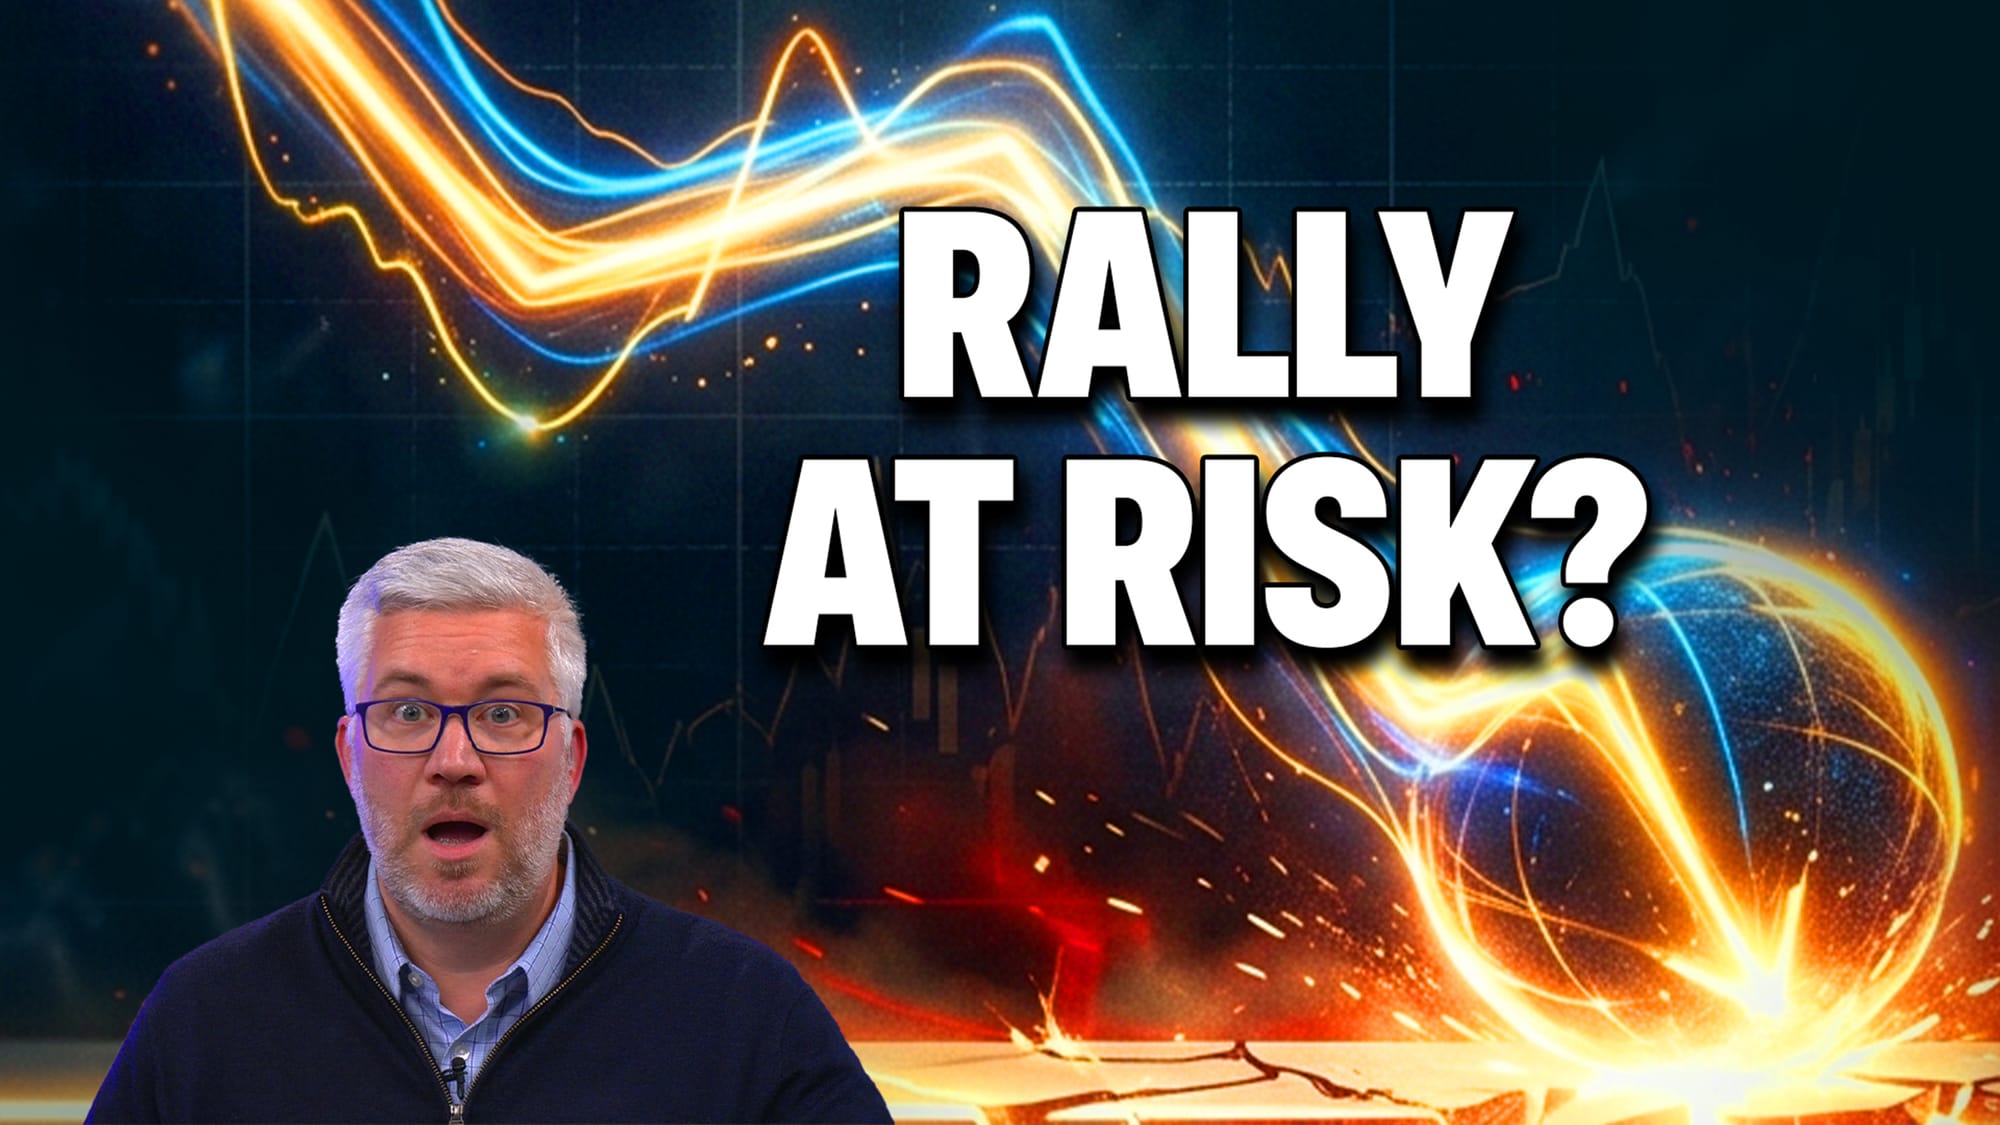
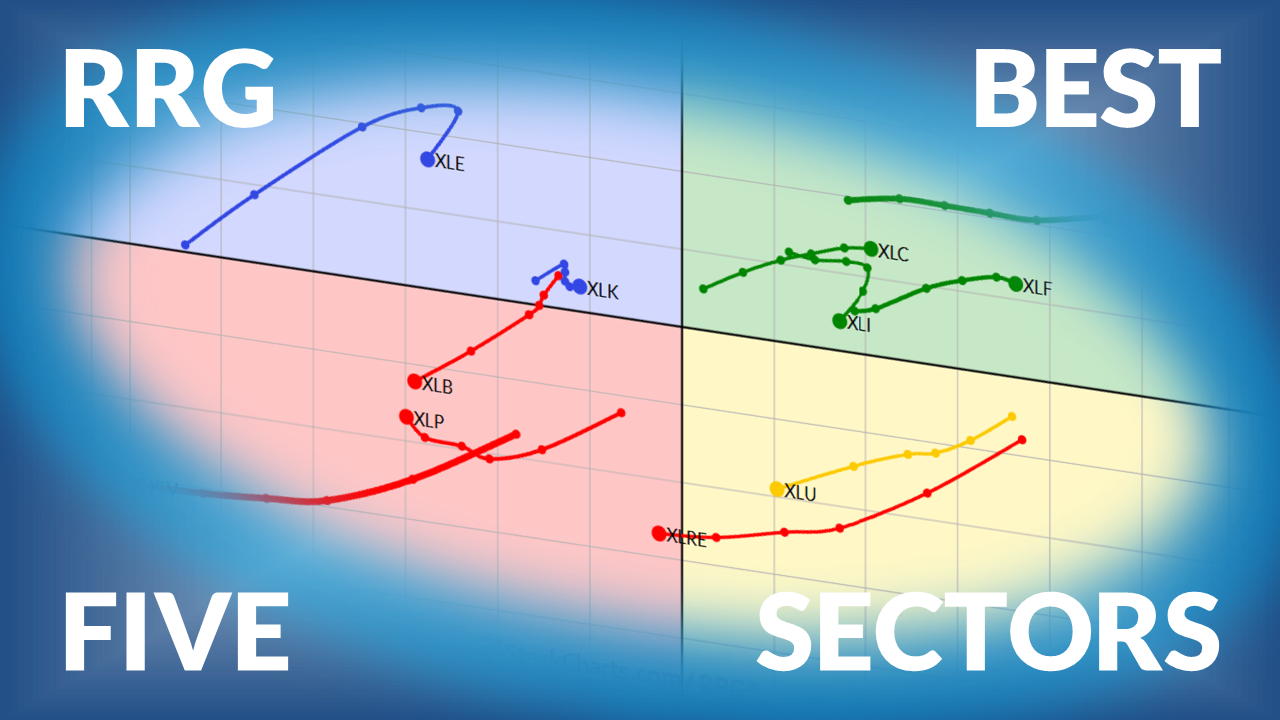
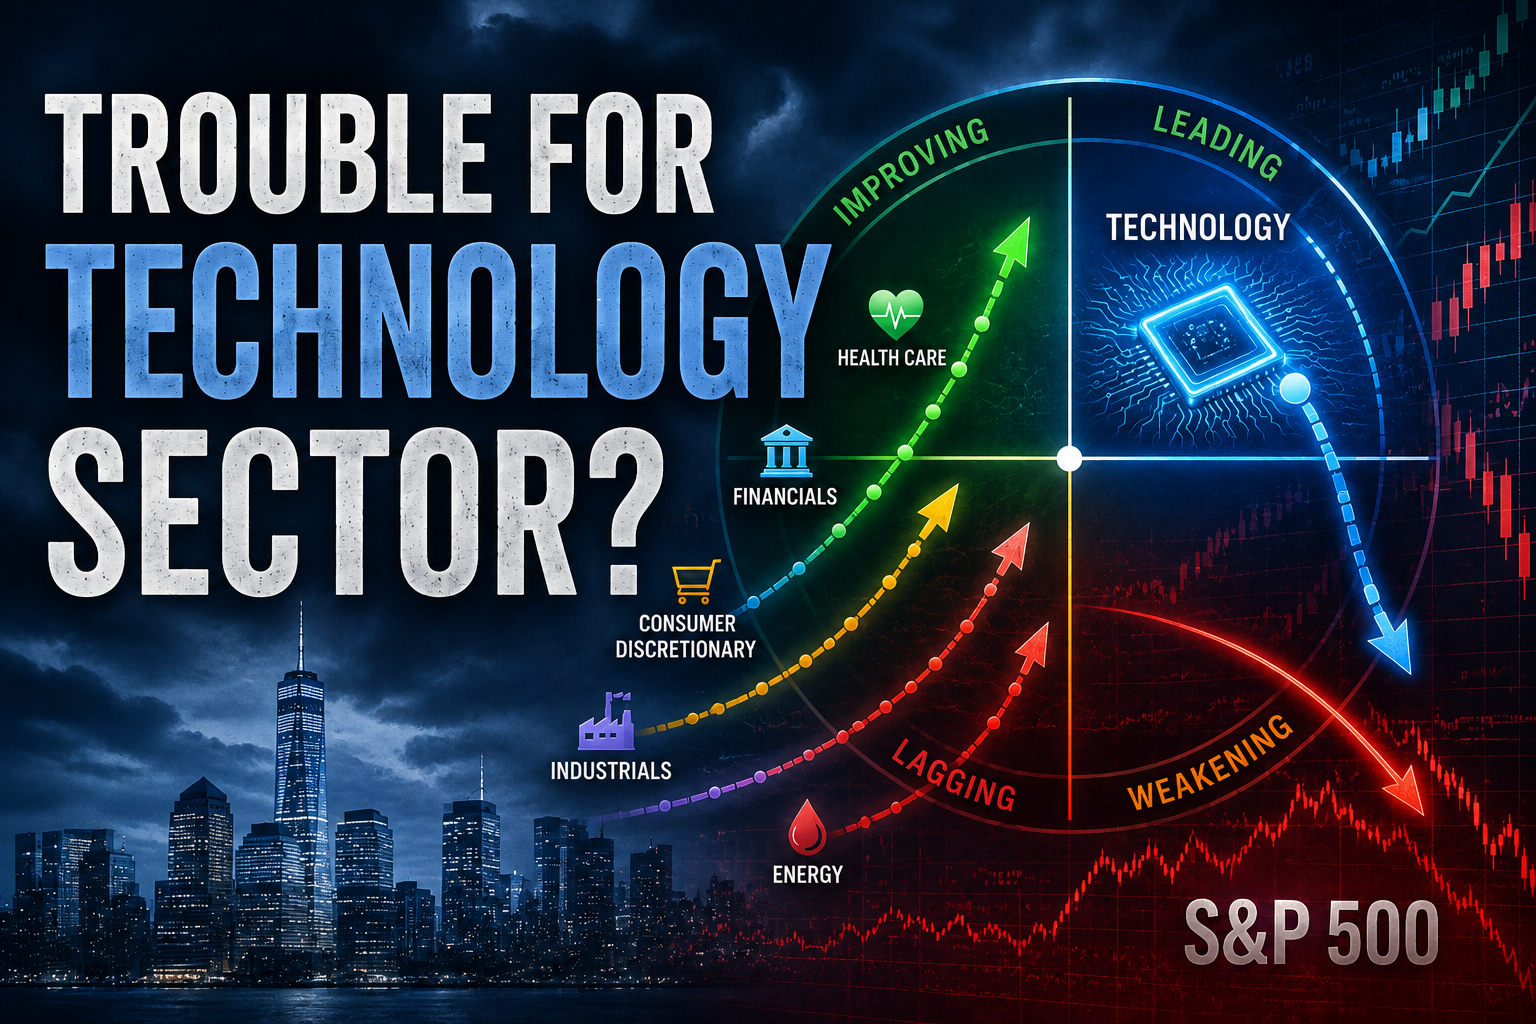
With the S&P 500 at a critical level, the big questions have shifted to how individual stocks respond to earnings and whether leadership can broaden. Dave walks through each chart to identify where trends remain intact, where weakness is emerging, and how key technical levels may act as inflection points after earnings. He also explains how to interpret price action around earnings events, including how momentum, moving averages, and prior support zones can help frame risk and opportunity. By tracking these signals, investors can better assess whether this rally has the strength to continue or is at risk of fading.
This video premiered on April 21, 2026. Watch on StockCharts' dedicated David Keller page!
Previously recorded videos from Dave are available at this link.