Bitcoin Awakens: A Powerful Crypto Setup Takes Shape as Risk-On Reigns

Key Takeaways
- Bitcoin clears key resistance with strengthening momentum, reinforcing a constructive near-term technical backdrop.
- RSI confirmation and improving relative strength suggest dip-buying may define the current regime.
- Overhead supply and a key Fibonacci level near $86K could shape the next decisive move.
Risk-on indicators are piling up, with Discretionary vs. Staples up sharply this month. Biotech vs. Health Care is on a heater. The Dow Jones Hotels Index hit a 52-week high against the Dow Jones US Utilities Index last Tuesday. And the Dow Transports? It’s on its steepest rally since 1938. It all comes after yet another S&P 500 V-bottom.
Away from equities, another spicy play garners attention: Bitcoin.
Bitcoin Steps Back Into the Spotlight
The world’s most valuable cryptocurrency scaled $78,400 for the first time since immediately after Groundhog Day. Now nearly four months removed from its last $80,000 print, Bitcoin has (almost quietly) posted a 30% return off its February 6, 2026 cycle low.
Bottoming well ahead of the S&P 500’s March 30 nadir, the flowers are blooming early for crypto bulls this April. From an asset-allocation perspective, new highs in Bitcoin, Ethereum, and the like could bode well for the S&P 500 (especially tech).
But let’s focus on Bitcoin itself, and why this week’s advance is particularly compelling. I’ll provide a fresh read on key price levels and assess calendar trends.
A Break Above Resistance Changes the Narrative
Beginning with the big picture, Bitcoin’s rally through $78,000 is notable because it’s now above the mid-March rebound high of $76,000. On the 3-year zoom, $80,600 appears as a critical price, as that was the spike low last November.
Above that, the rallying long-term 200-day moving average comes into play in the mid-$80,000s.
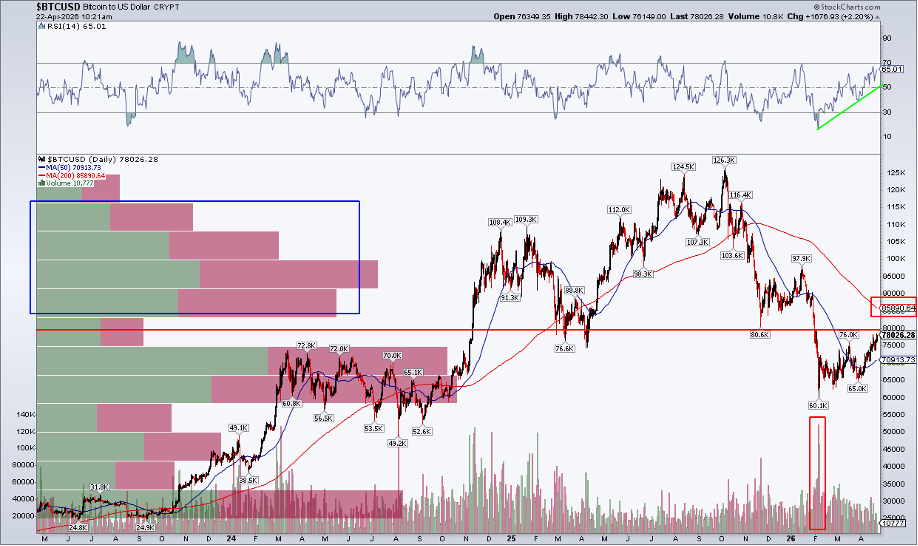
But take a look at the RSI momentum oscillator at the top of the chart. It has climbed from deeply oversold conditions near 20 in early February to within earshot of overbought conditions today.
In my view, “overbought” is not as bearish as it sounds. After all, how negative is price action if buyers scratch and claw to accumulate? Rather, a 70+ RSI signals to traders that the presumption should be to buy the dip, not sell the rips.
The upshot here is that price is confirmed by RSI momentum, which is a clear checkmark in the bulls’ favor.
Volume Reveals the Battle Beneath the Surface
Volume tells a story, too. The Feb 6 freefall occurred on a massive number of bitcoin traded, helping to cement it as a durable bottom. Still, the volume-by-price profile on the left side of the chart reveals a hefty sum of “dead bodies,” or previous buyers stuck underwater on their positions.
Volume analysis asserts that this overhead supply may make rally attempts difficult. From a behavioral finance standpoint, the “bag holders” could look to sell to get back to even. A bullish antidote to that thesis is if we see increasing volume alongside a rising token price. That remains to be seen, but a jump above the 200dma would get many market participants’ attention.
Support Levels That Must Hold
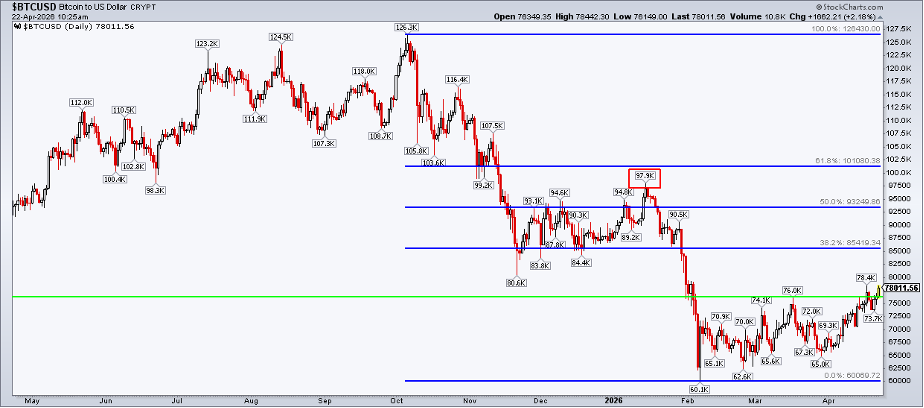
Now, in February, I called out the $58,000 Fibonacci retracement level. Bitcoin almost tagged that just days after my previous analysis. Well, we have a new set of Fibonacci levels to mind.
The first is the 38.2% retracement of the $126,300 to $60,100 plunge. It enters the scene right on the 200dma, near $86,000. As the long-term moving average descends, we will naturally lose that confluence area. For now, though, you should mark three prices: (1) the February low, (2) the 200dma, and (3) the 38.2% retracement.
Beware the Fake-Out Risk
On the downside, the March rebound high of $76,000 is critical to defend. Recall the early-January recovery to almost $98,000. Like today’s advance, it was a multi-month peak on improved momentum readings. It went on to fail spectacularly.
The bears lick their chops at another potential fake-out, and from false moves come fast moves in the opposite direction (as technicians are wont to say).
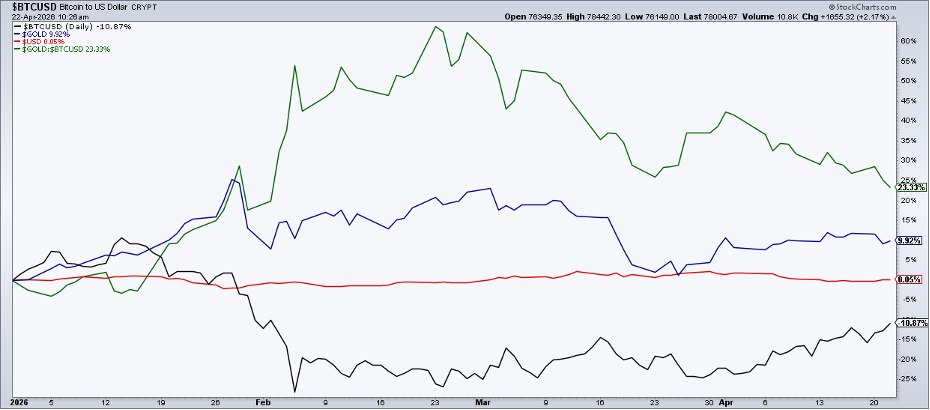
Bitcoin vs. Gold: A Shifting Leadership Dynamic
It’s always helpful to view bitcoin through an intermarket lens. For that, comparing it to gold and the dollar tells traders which is in absolute and relative favor. Bitcoin and gold have taken turns leading, and the former may have the upper hand heading into mid-year.
True, gold remains the year-to-date leader, up 10%, but the alligator jaws have been closing. The yellow metal was up more than 60 percentage points on bitcoin YTD in mid-February. Today, the gap is a mere 23 ppts. The near-term trend favors crypto, with relative strength ongoing for precisely three months.
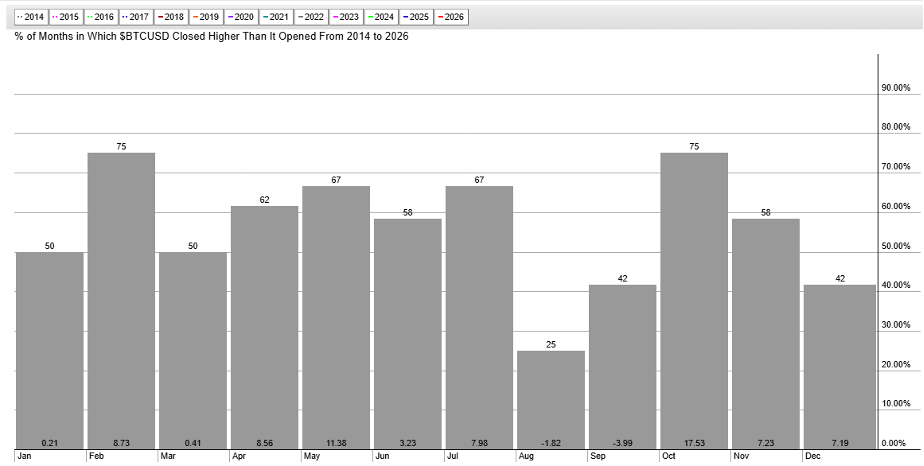
Seasonality Enters Bitcoin’s Sweet Spot
Speaking of the calendar, crypto bros (and sisters) seem to soak up April and May. Second only to October–November in terms of historical two-month average returns, Bitcoin tends to rally throughout Q2.
To be clear, a chunk of this calendar strength is due to incredible returns early in Bitcoin’s financial life, but even taking median monthly returns since 2011, we find that gains are handsome April through July (+11%, +7%, +4%, +9%, respectively). The usual technical analysis disclaimer: Seasonality is a secondary indicator to price.
The Bottom Line
Bitcoin is making moves. The world’s most valuable cryptocurrency catches some green vibes on Earth Day 2026. Crucial technical levels lie above today’s marginal three-month zenith, but a series of higher highs and higher lows in price, along with RSI confirmation, point to potential further upside.
Disclaimer: This blog is for educational purposes only and should not be construed as financial advice. The ideas and strategies should never be used without first assessing your own personal and financial situation, or without consulting a financial professional.