Breadth Continues to Improve; SPY Consolidates & Becomes Oversold
Key Takeaways
- Percentage of stocks trading above their 200-day simple moving averages in uptrends.
- New highs in the S&P 500 expand.
- SPY is oversold and consolidating, which means there's potential for bullish setups.
Even though the momentum trade took a hit in July, broad market breadth continued to improve and the weight of the evidence remains bullish. Most stocks are in long-term uptrends, new highs are expanding, and SPY is consolidating within an uptrend. There is clearly a bull market somewhere.
Percentage of Stocks in Uptrends Improves
The chart below shows the percentage of stocks above their 200-day simple moving averages (SMAs) for the S&P 500 ($SPX), Nasdaq 100 ($NDX), S&P 400 Mid Cap ($MID), and S&P 600 Small Cap ($SML). In the top window, around 70% of S&P 500 stocks are above their 200-day SMAs. Most are in uptrends, which is enough to support a bull market.
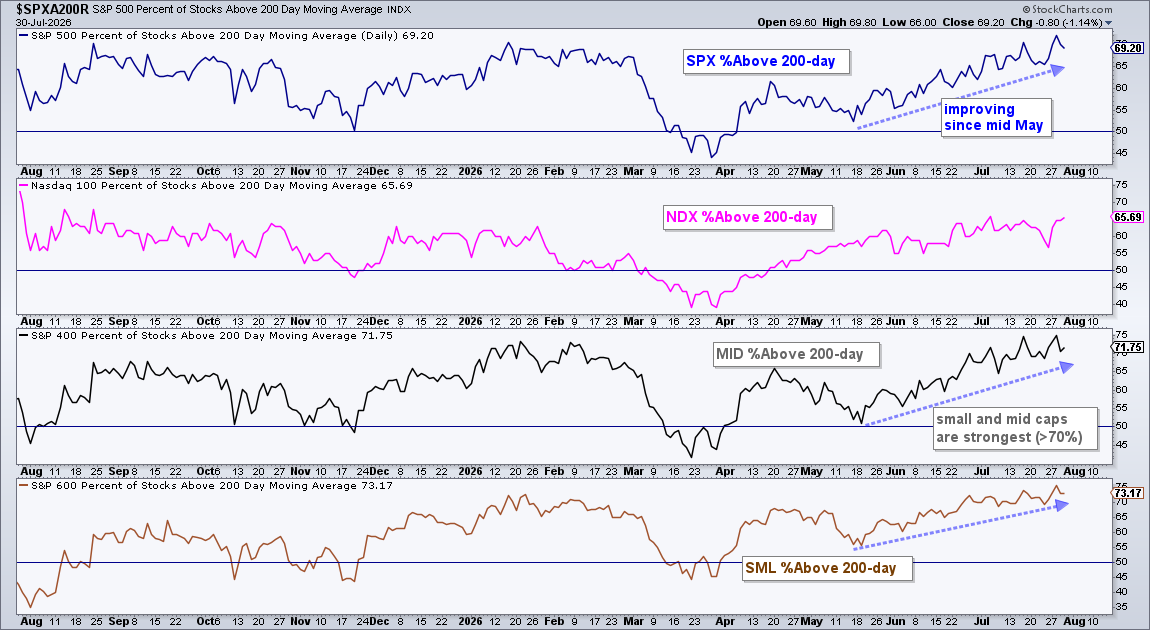
The second window shows NDX %Above 200-day SMA moving above 50% in mid-April, remaining above this key level, and hitting 65.69% on Thursday. Nasdaq 100 breadth is not as strong, but the NDX cup is clearly half-full (bullish).
The bottom two windows show small-caps and mid-caps leading. MID %Above 200-day SMA and $SML %Above 200-day SMA are both above 70%. Small-caps are leading, with some 73% of S&P SmallCap 600 stocks in long-term uptrends. This number reflects broad strength within the small-caps universe. Note that our breadth models at TrendInvestorPro have been bullish since July 2025.
New Highs Expand Within S&P 500
The next chart shows High-Low Percent for the S&P 500, Nasdaq 100, S&P 400, and S&P 600. High-Low Percent is the percentage of new highs less the percentage of new lows.
In the top window, SPX High-Low% exceeded +10% four times in July (blue shading). The indicator hit +13.20% on Wednesday, its highest level since February. Stocks making new highs are in strong uptrends and leading. This indicator shows leadership within the S&P 500 expanding.
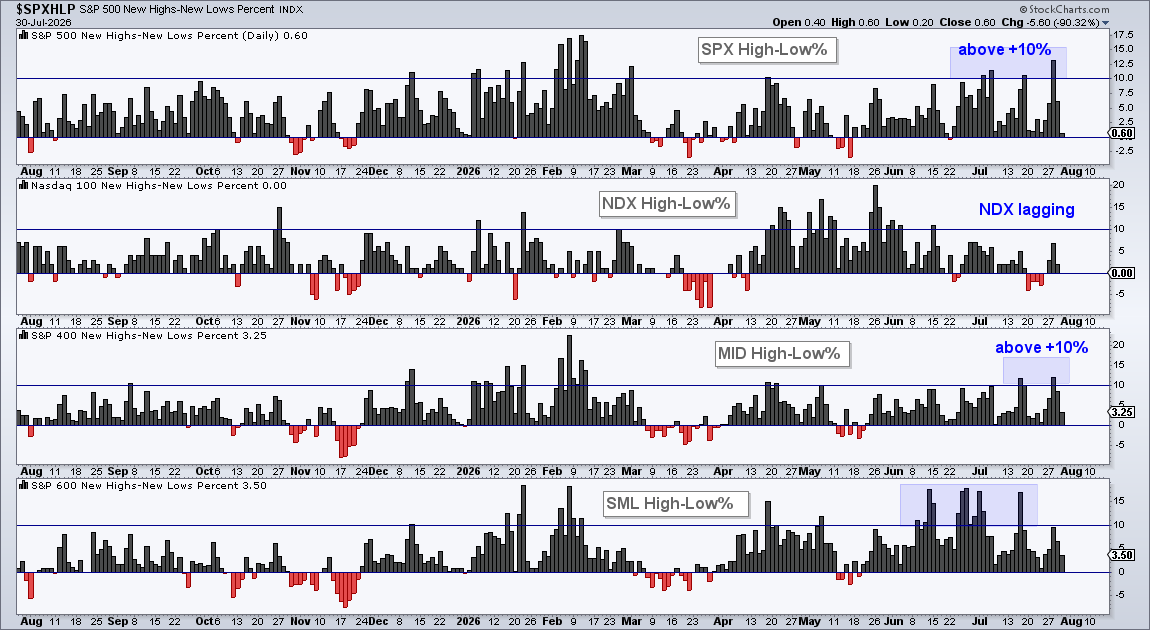
The second window shows NDX High-Low% lagging because it failed to exceed +10% in July. MID High-Low% and SML High-Low%, however, are picking up the slack because both exceeded +10% (blue shading).
In a bull market, our job is to find bullish setups and leading uptrends. The stock market experienced a rotation in July as money moved out of AI names and into software and cloud stocks. Our reports/videos this week featured setups in ETFs related to Software, Cloud Computing, Medical Devices, Copper Miners and Gold. We also covered the correction in AI ETFs, Nvidia and Broadcom, two stocks that held up relatively well in July. Click here to take a trial and gain full access.
SPY Becomes Oversold and Consolidates
In addition to bull market breadth, the SPDR S&P 500 ETF (SPY) is in a long-term uptrend, with a new high in early June and price well above the rising 200-day SMA.
After a 21% advance, SPY moved into a corrective phase as it consolidated the last two months. This 21% advance was straight up and the rate of ascent was unsustainable. SPY needed a rest to digest the gains and pave the way for the next move.
As Yogi Berra famously said: "It's tough to make predictions, especially about the future." This is certainly true regarding predicting the length and duration of a correction. SPY could pullback to the 200-day SMA for a price correction, or it could move sideways for a time correction. The current correction is sideways, which makes it a time correction.
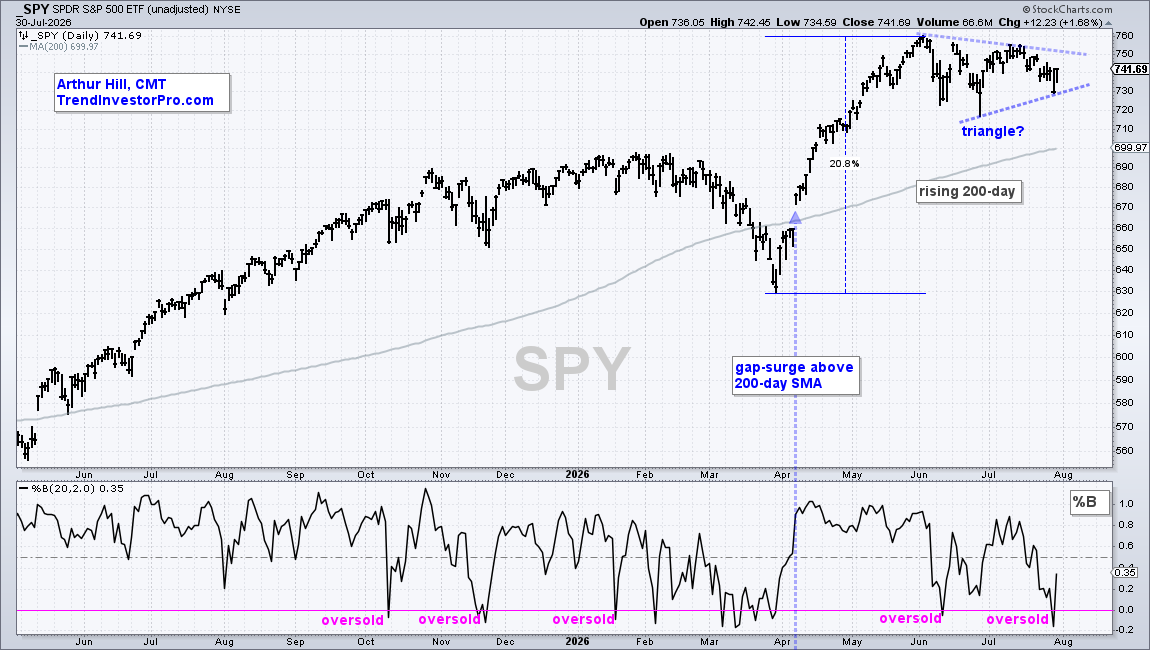
With a strong bounce on Thursday, SPY could form a higher low to complete the lower line of the triangle. A triangle breakout would signal an end to the correction and a resumption of the bigger uptrend.
SPY became short-term oversold on July 29th as %B dipped below zero. This means the close was below the lower Bollinger Band, or two standard deviations below the 20-day SMA. Within an uptrend, short-term oversold conditions alert traders to pullbacks and possible bullish setups.