Could Seasonality Give You an Edge in the Market?
Treasury yields were a major driver of the market this week. Despite the U.S. Treasury’s intervention earlier in the week, bond yields continued to rise, with the 30-year closing at 5.28% and the 10-year closing at 4.74%.
The intervention did produce some interesting price action across asset classes. Stocks finished the week lower, precious metals moved higher, and cryptocurrencies finally awoke from their slumber.
This week’s update:
- Crypto breaks higher
- Seasonality Charts get a new look
- What’s on deck
Crypto Surges
Bitcoin jumped about 24% for the week, a move we haven’t seen in years. It’s also up about 24% for the month. This makes the seasonality picture especially interesting.
Over the past 13 years, August and September have generally been weak months for Bitcoin, which has finished higher just 31% of the time in August and 42% of the time in September. Average returns were -0.44% and -3.99%, respectively (see the Seasonality Chart below).
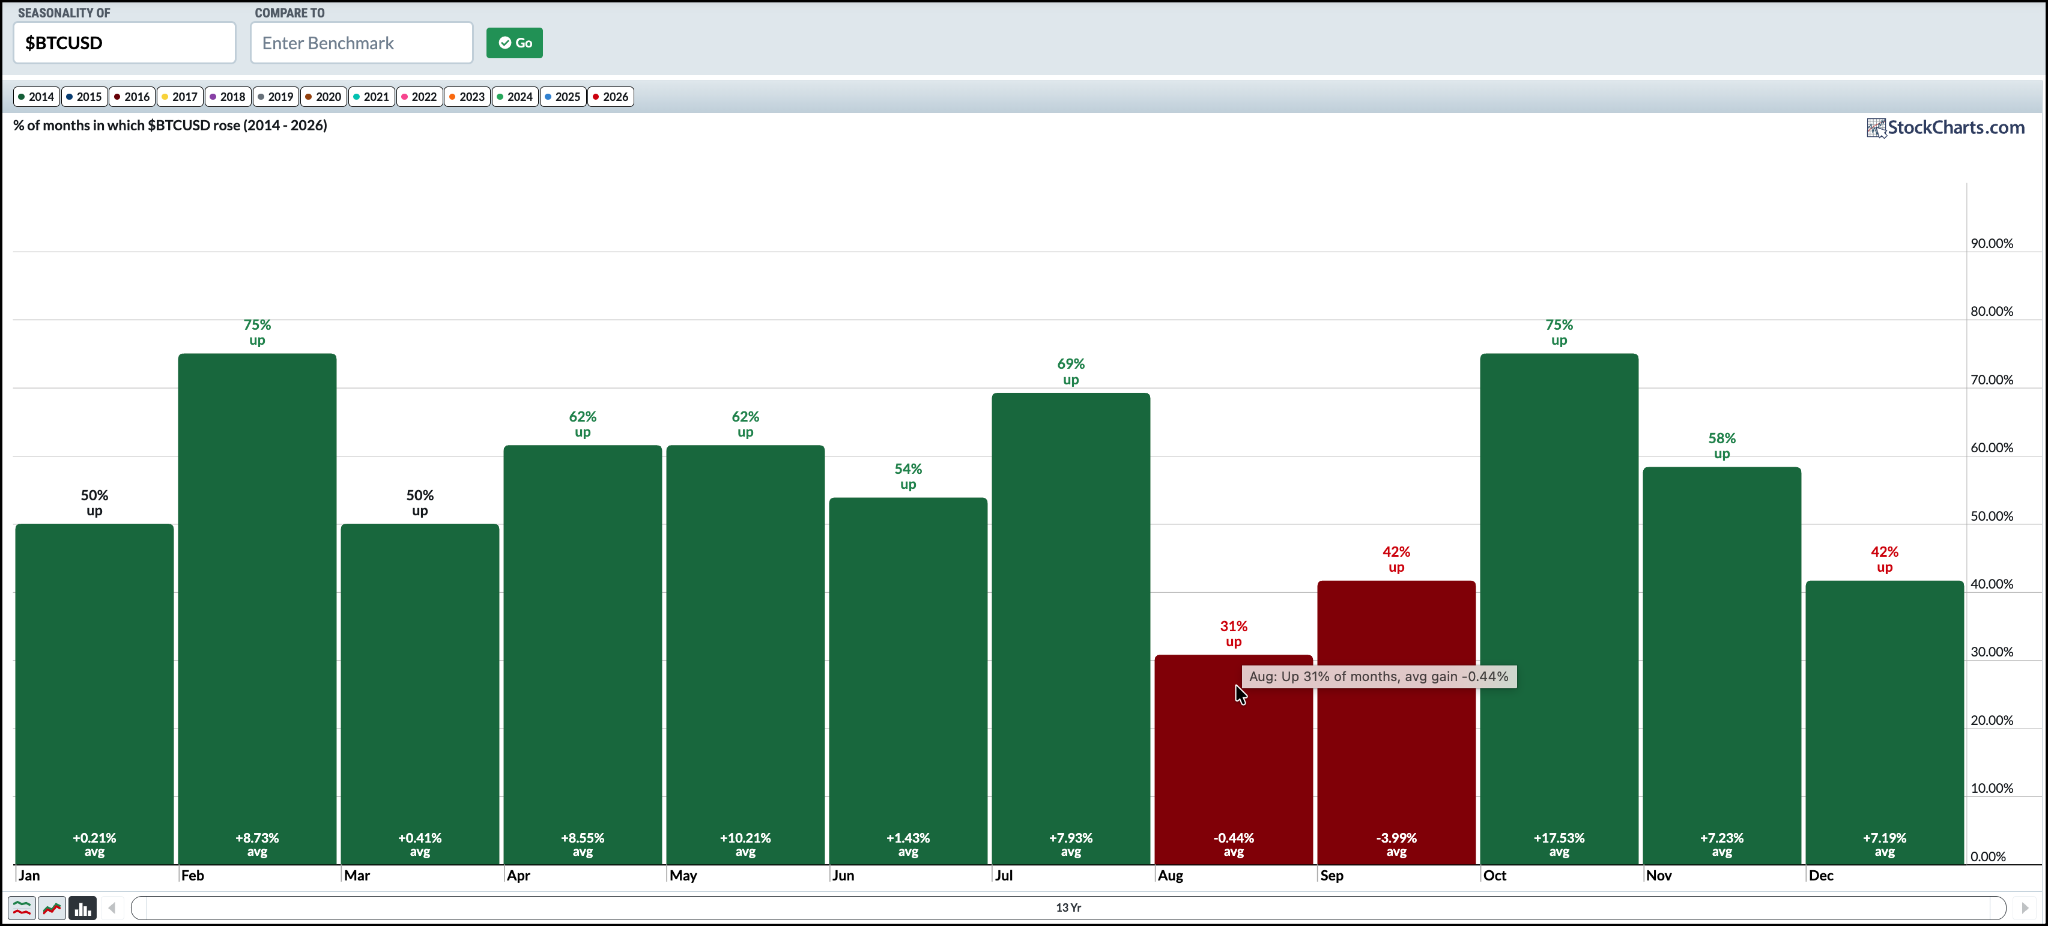
This August, however, Bitcoin has surged. There’s still a little over a week left in the month. Let’s see if Bitcoin can buck its seasonal tendencies and push above its May highs.
Seasonality Charts Get a New Look
Speaking of seasonality, have you checked out our refreshed Seasonality Charts?
The first thing you’ll notice is the new, more colorful look. But there are bigger changes under the hood.
Seasonality data now goes back to 1980 for assets with enough history. This gives you a much deeper look at how stocks, indexes, ETFs, and other securities have performed during different times of the year.
We’ve also made it easier to explore that history. When viewing performance in either of the line modes (same scale or separate scale), hover over a year at the top of the chart to highlight that year’s performance. Click on a year to toggle it on or off, making it easy to compare the periods you’re interested in.
You can also view your ChartLists using Seasonality Charts, giving you a quick way to look for seasonal tendencies across the securities you follow.
And here’s one more improvement you might appreciate: your Seasonality Chart settings are now retained when you bookmark or share a link.
If you haven’t explored the refreshed Seasonality Charts, this weekend would be a great time to give them a try.
On Deck for Next Week
Next week brings several potential market movers, including Kevin Warsh’s speech at the Jackson Hole Symposium and the July Core PCE inflation data.
NVIDIA (NVDA) earnings are also on deck, and it’s likely investors will be listening closely for clues about the health of the AI industry. Be sure to read our earnings preview before the report.
Have a wonderful weekend!