Can Semiconductors Be Both a Buy and a Sell?

Semiconductor stocks have been hit hard over the last six weeks. The good news is that the VanEck Semiconductor ETF (SMH) is now oversold, as shown in Chart 1. The green arrows indicate that meaningful advances followed the previous four rebounds from the 30 level. This type of sensitivity to an oversold condition is characteristic of an ongoing bull market.
It’s also possible that the breakdown from the post-May head-and-shoulders top will prove to be a false move. To confirm that possibility, SMH and 9-day Relative Strength Index (RSI) would need to break above the two dashed-green trendlines, much as they did at the start of April. At that time, the Know Sure Thing (KST) generated a buy signal, completing a constructive technical setup. Although the KST currently remains below its moving average, it would not take much upside momentum to trigger another buy signal.
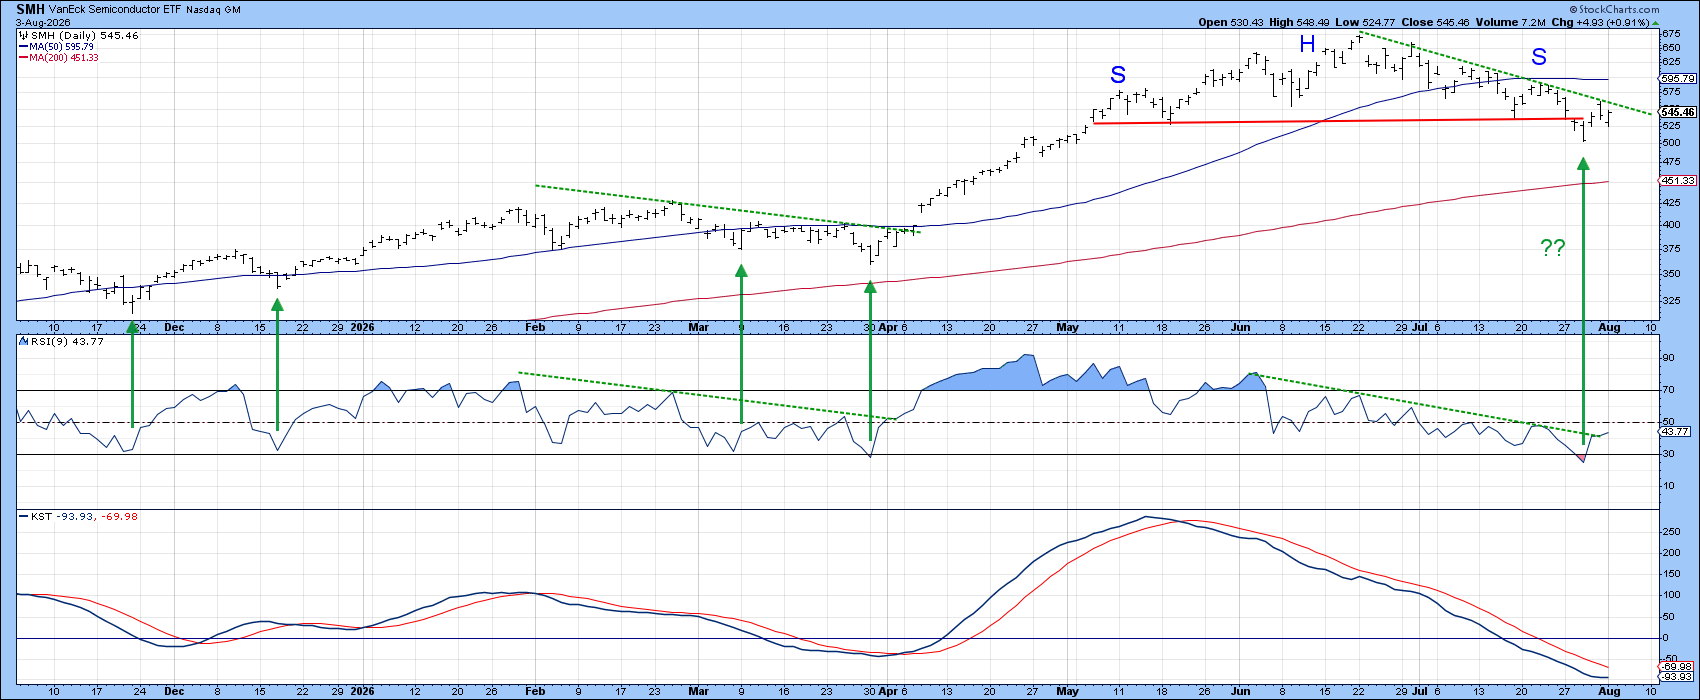
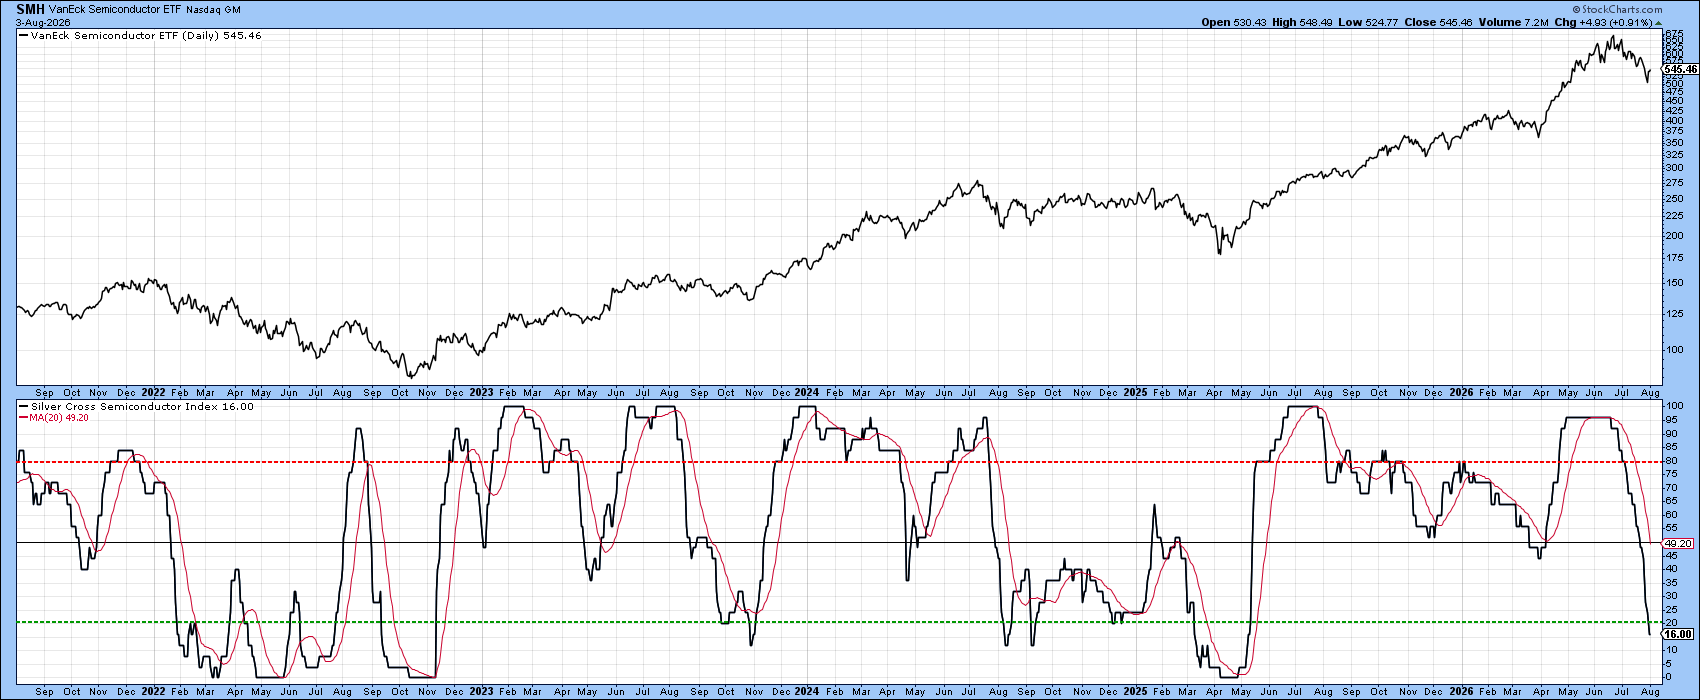
Chart 2 also points to an oversold condition. It shows that the percentage of semiconductor stocks registering a positive Silver Cross has fallen below the lower dashed-green threshold. A Silver Cross occurs when a stock's 20-day moving average rises above its 50-day moving average. While this breadth indicator remains in a downtrend and its moving average has not yet crossed above the 50% equilibrium level, it's nevertheless in a more constructive position than it was during the May–June period.
Long-term Position
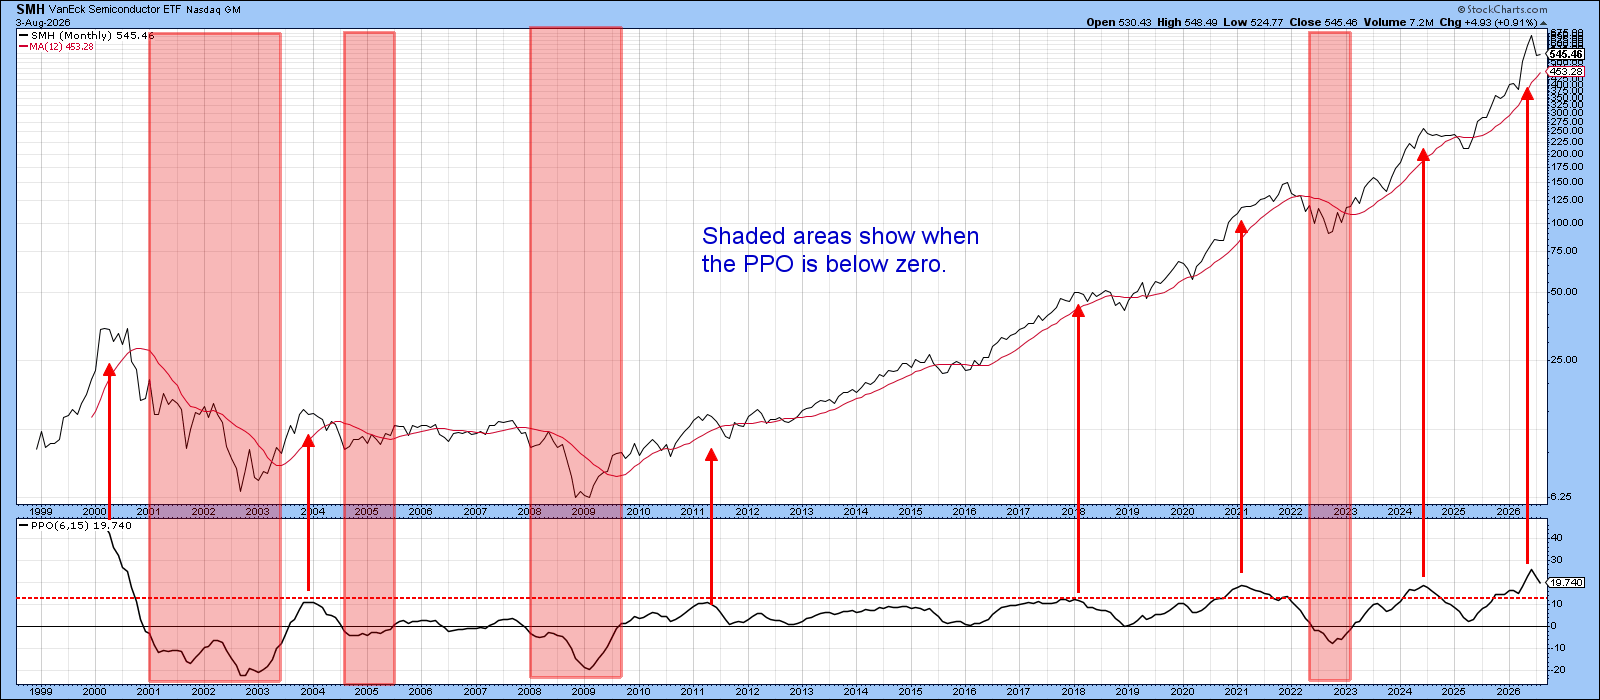
Chart 3 takes the picture back to the turn of the century and features a Percentage Price Oscillator (PPO) using the 6- and 15-period parameters. The pink-shaded areas warn of potential trouble when the PPO is trading below zero. This condition has captured most major declines during the last 25 years.
At the moment, the indicator is a long way from a negative crossover, so there's little risk that a bearish signal will be triggered anytime soon. That said, it’s worth noting that more timely sell signals have occurred when the oscillator reverses to the downside after rallying to, or above, the red overbought line. Six such setups have materialized since the 2000 peak, and all were followed by either a significant decline or an extended trading range. This year has witnessed a seventh reversal from a level that has been exceeded only once before, namely during the height of the tech boom.
Exhaustion or Thrust?
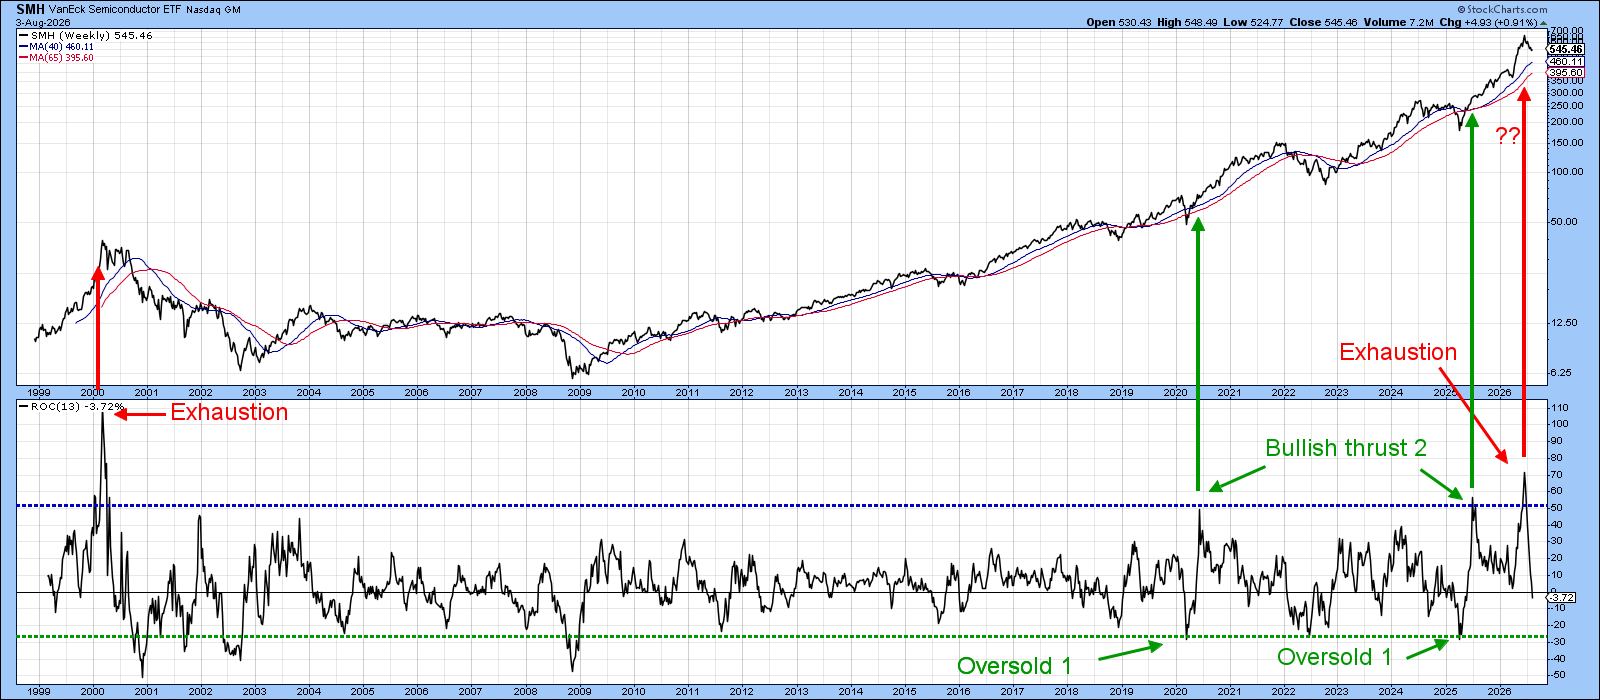
Chart 4 compares the SMH with its 13-week Rate of Change (ROC). The price itself remains in a clear uptrend above both its 40- and 65-week simple moving averages (SMAs). However, it’s the momentum action that has caught my attention, as the 13-week ROC recently peaked after reaching a level above its dashed blue extreme-overstretched zone.
As you can see, this type of reversal occurs very infrequently. It has happened only four times since 1999. When it does occur, it tends to telegraph either a strongly bullish or strongly bearish message.
A bullish reversal delivers a "one-two punch." The first is a recovery from a deeply oversold condition, represented by the green dotted line. The second requires the ROC to peak from a level at or above the blue dotted line. This recovery from an oversold reading represents the thrust phase and is bullish in nature. The thrust reflects a complete reversal in investor sentiment, from extreme pessimism to overwhelming optimism, and reflects a vibrant young bull market in its early stages.
The other type of signal occurs when the oscillator reaches an extreme following an extended advance. This pattern identifies buyer exhaustion and is generally bearish, carrying at least primary-trend significance. The latest reversal occurred from the second-highest level on record and should therefore be respected accordingly.
The Bottom Line
This indicator alone doesn’t guarantee the emergence of a primary bear market; it’s far too early to reach that conclusion. Nonetheless, it does raise a red flag, suggesting that we should carefully evaluate the quality of any impending short-term rally in order to determine if it still exhibits the characteristics of a pro trend advance.
Good luck and good charting,
Martin J. Pring
The views expressed in this article are those of the author and do not necessarily reflect the position or opinion of Pring Turner Capital Group of Walnut Creek or its affiliates. The Six Stages of the Business Cycle are followed each month in Martin Pring’s Intermarket Review.