Oil's Consolidation May Be Nearing an End

Key Takeaways
- XLE is showing bullish action, which strengthens the argument that oil is resuming its primary uptrend.
- The chronological sequence in long-term commodity momentum is bullish for oil.
- If a giant breakout occurs in Brent crude, it would have implications beyond the energy complex.
At the beginning of last week, I noted that commodities were confronting two key battle lines, the resolution of which would likely determine the direction of their next major move. Since then, fresh evidence has emerged in favor of an upside breakout, most notably from the price action of energy stocks, as reflected by the SPDR Energy ETF (XLE).
As Chart 1 illustrates, XLE has completed a breakout from an inverse head-and-shoulders pattern. This development is reinforced by both short- and long-term momentum indicators, which remain firmly positive in the lower panels.
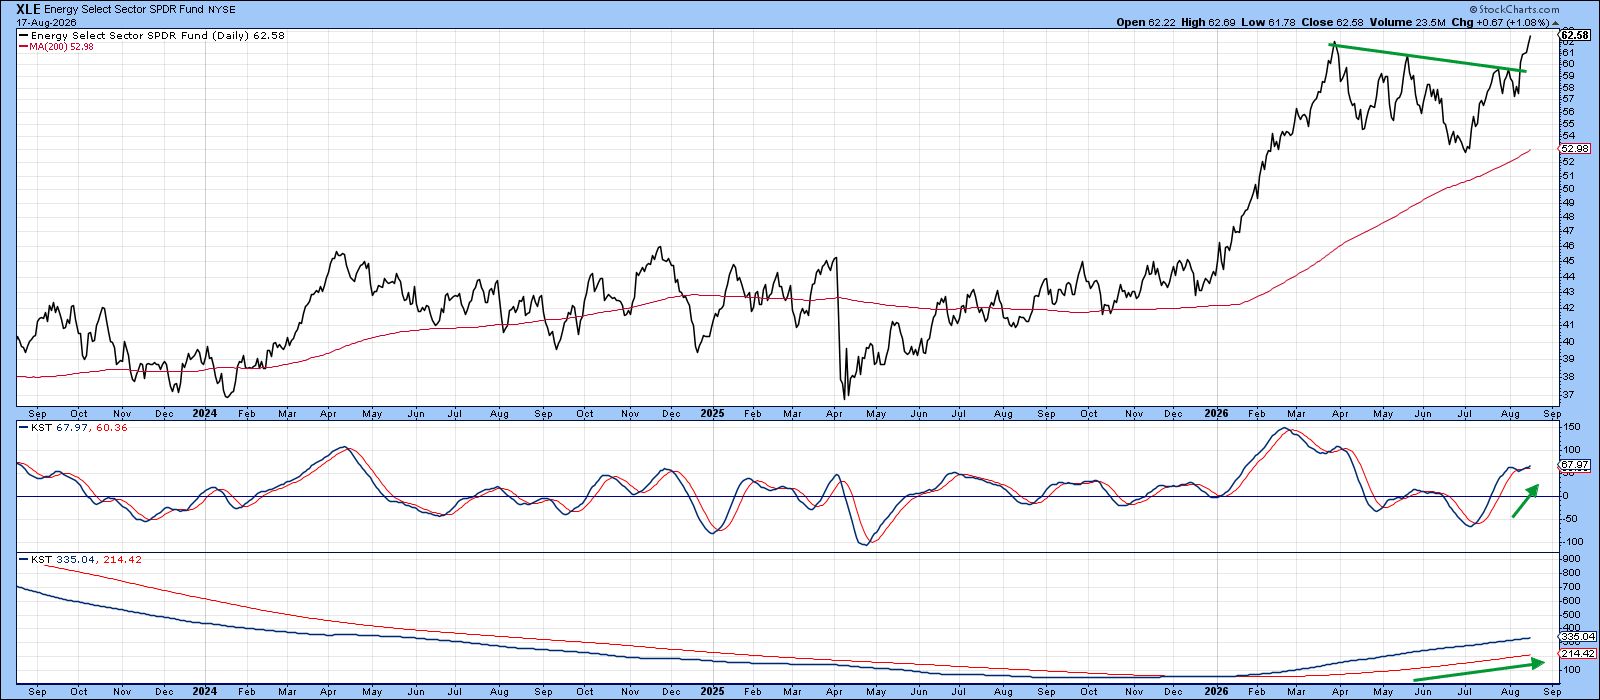
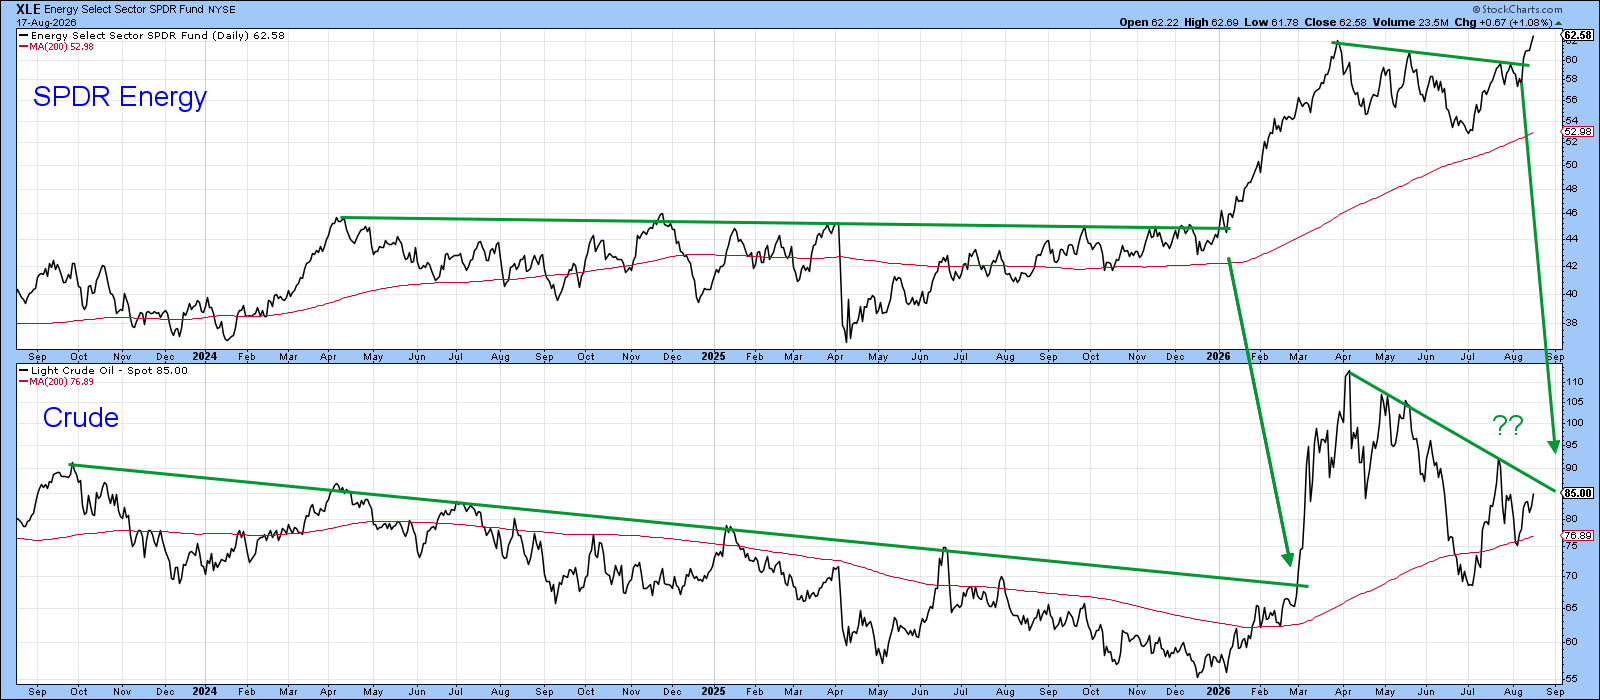
Chart 2 shows that the XLE led the way during the early 2026 breakout, and it now appears to be doing so again. West Texas Intermediate crude is on the verge of breaking above its intermediate-term downtrend line, a development that would validate the stock ETF's recent bullish action and strengthen the argument that oil is resuming its primary uptrend.
The Chronological Commodity Cycle is Bullish for Oil
Another reason for expecting higher crude prices is illustrated in Charts 3 and 4. They show a chronological sequence in long-term commodity momentum, as measured by the smoothed Know Sure Thing (KST) indicator during a typical business cycle. Chart 3 highlights the pattern at cyclical troughs, while Chart 4 focuses on major peaks. The sloping arrows identify the usual lead-lag relationships.
Gold is primarily a monetary asset rather than an industrial commodity. As such, it typically peaks first as investors begin to anticipate tighter monetary policy, higher real interest rates, and less favorable liquidity conditions.
Copper, often referred to as "Dr. Copper" because of its sensitivity to industrial activity, generally turns lower next. Since it reflects expectations for manufacturing, construction, and capital spending, copper often begins discounting an economic slowdown before it becomes evident in many conventional economic statistics. However, Chart 3 shows that copper's KST is still advancing and has yet to join gold in the bearish camp.
Crude oil typically brings up the rear. In the latter stages of an expansion, energy demand frequently remains robust even after industrial metals have begun to weaken. Consequently, oil prices often reach their cyclical highs often well after gold and copper have peaked.
From an equity market perspective, the most dangerous phase of the cycle occurs when copper has already rolled over, but oil remains strong. Such a divergence suggests that actual economic activity has not yet caught up with the weakening industrial demand already being signaled. In mid-August, copper momentum was still rising, so that warning signal has yet to materialize for the current cycle. Indeed, the historical sequence suggests that copper’s momentum may still have room to advance and, given its leading tendencies, oil’s may as well.
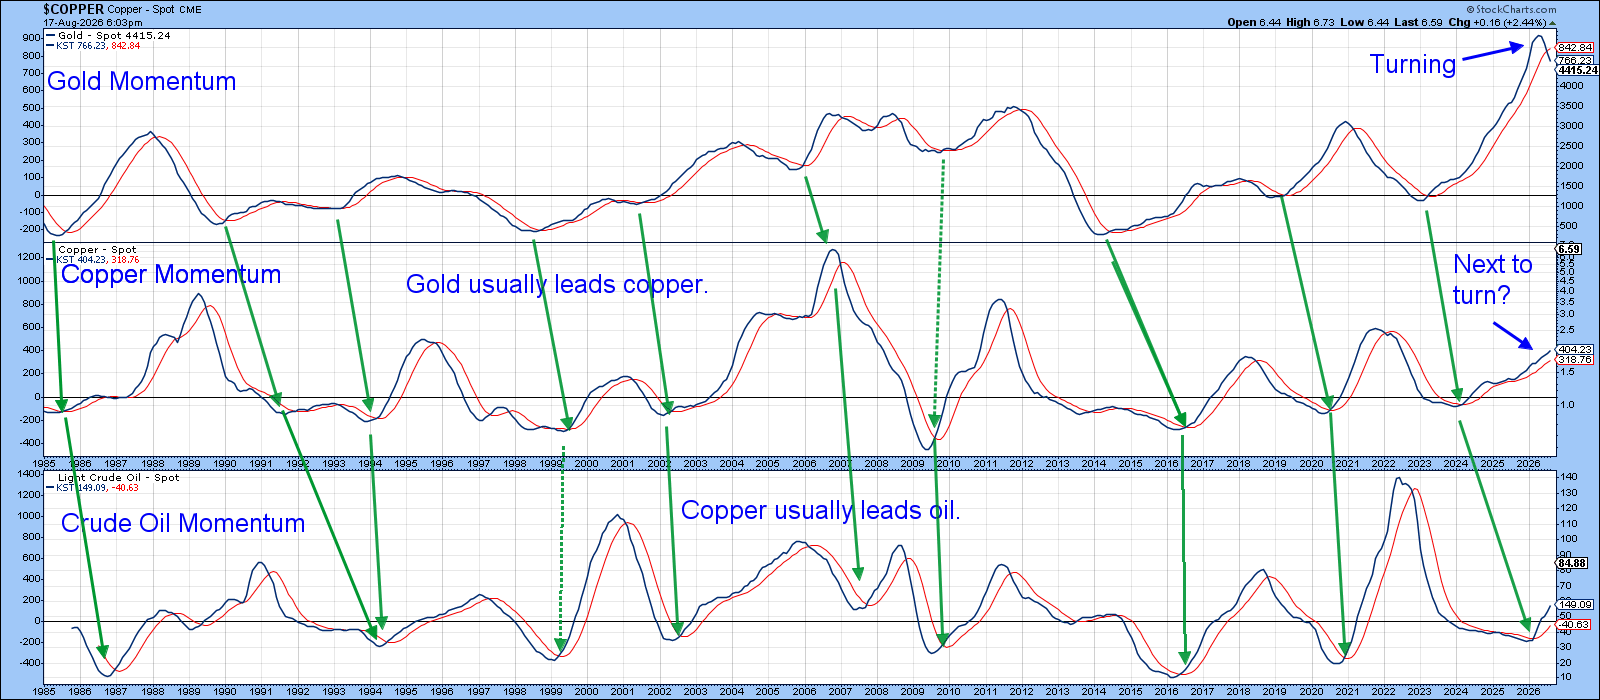
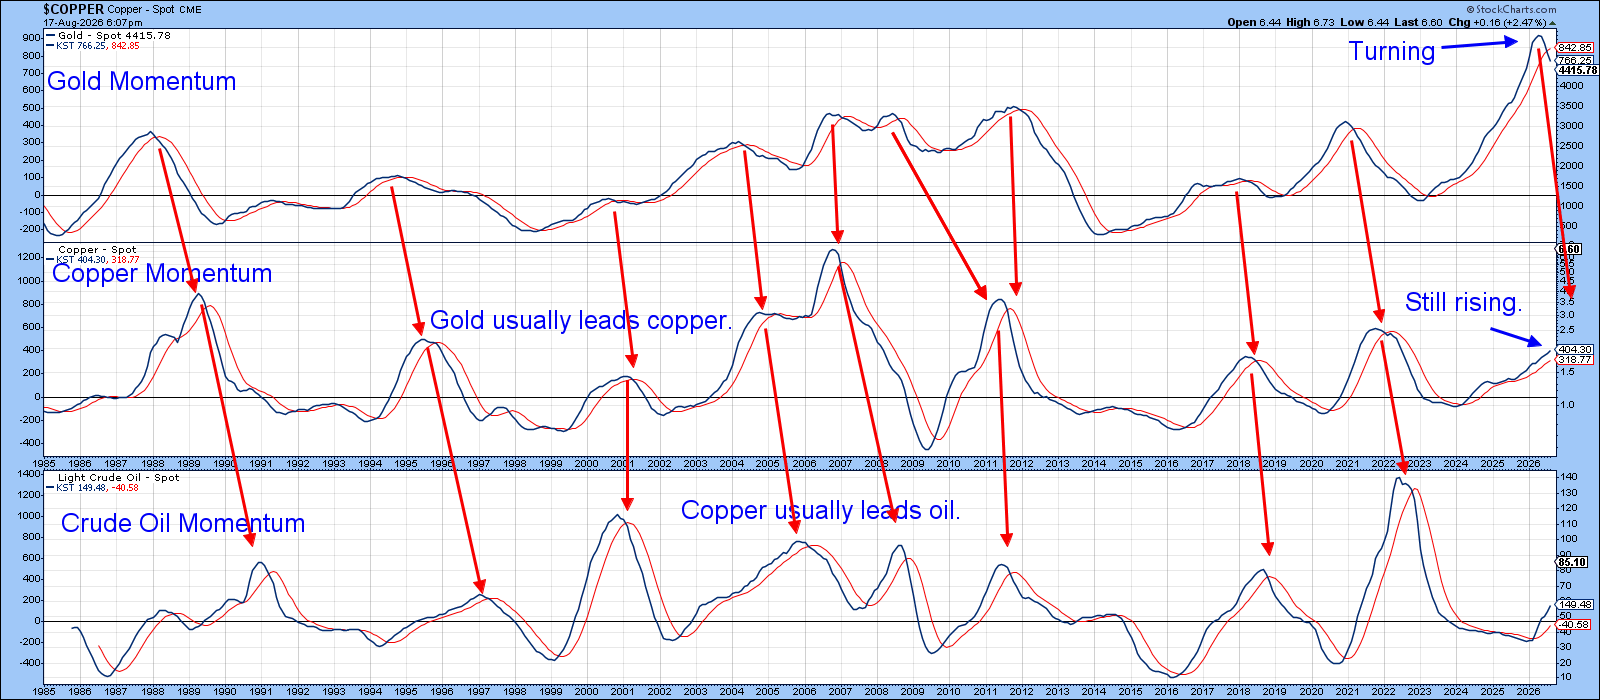
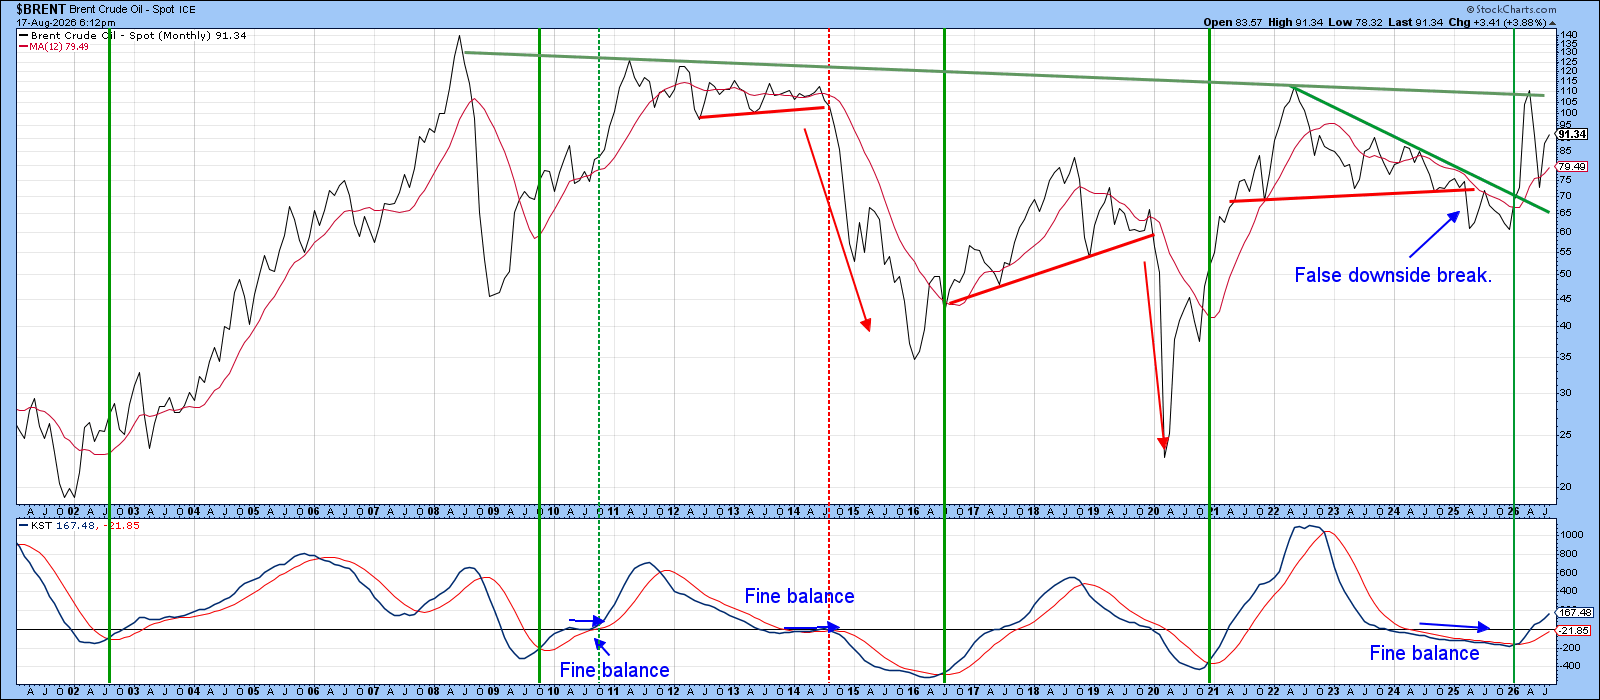
Chart 5 shows that the stakes could be quite high, as the price of Brent is very close to what is really the neckline of a potential multi-decade consolidation inverse head-and-shoulders. If this formation is completed, it would strongly suggest significantly higher energy prices over the course of the next couple of business cycles.
The Bottom Line
Oil equities are in the process of breaking to the upside. Historical precedent suggests, though by no means guarantees, that crude oil prices will eventually follow suit. Should that occur, and should the giant breakout pattern discussed earlier be completed, the implications would extend far beyond the energy sector. We could expect to see a broadening commodity rally, upward pressure on interest rates, and increasing challenges for an already overvalued stock market. In that respect, the potential upside action in oil would likely signal much more than just higher energy prices.
Good luck and good charting,
Martin J. Pring
The views expressed in this article are those of the author and do not necessarily reflect the position or opinion of Pring Turner Capital Group of Walnut Creek or its affiliates. The Six Stages of the Business Cycle are followed each month in Martin Pring’s Intermarket Review.