NVIDIA Earnings Preview: Bulls See a Path to New All-Time Highs

Key Takeaways
- The world’s most important AI company issues Q2 results on Wednesday, the 26th, and technicals are leaning bullish after a frustrating summer.
- A $239 record-high target is in play after unimpressive price action in recent months, and there’s one volatility catalyst ahead of the report.
- Broader semiconductor weakness is the biggest risk, while options markets imply a relatively modest 5.4% earnings-related move.
This earnings season has been one for the books. The S&P 500’s Q2 blended EPS growth rate is north of 50%, a rate usually only seen coming out of steep profit recessions. Retailer earnings continue to pour in but, after Walmart’s (WMT) release Thursday morning, all eyes turn to NVIDIA (NVDA). CEO Jensen Huang has been busy on the summer speaking circuit, highlighted by last week's CNBC appearance in which he wrangled a who’s-who of Wall Street financiers to craft a $500 billion chip capital facility.
It remains to be seen how active the third-party investment plan will be, but the hope is that risk will be spread to willing investors, similar to how other asset-backed vehicles are used. Less “vendor financing” and fewer circular deals could make NVIDIA’s balance sheet cleaner over time. As it stands, the world’s most valuable company’s 5-year credit default swaps are back near their summer highs... not the biggest vote of confidence.
NVDA vs. SPX
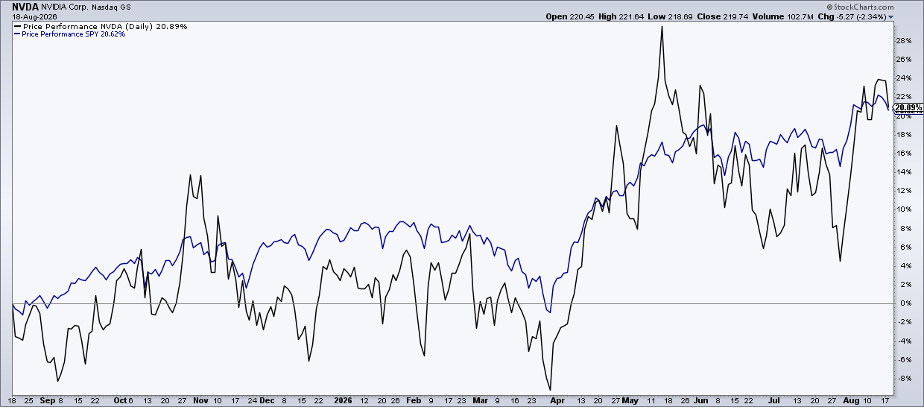
As for NVIDIA’s stock performance? It almost exactly matches the S&P 500 over the past year. NVDA has returned 20.9% compared with a 20.6% total return on the SPDR S&P 500 Trust (SPY). Eyeballing the chart, NVDA has offered about 2x more volatility than the U.S. large-cap index, but the ending point is the same.
Will that change after its Q2 numbers hit the tape on Wednesday evening, August 26? Let’s check out the technicals.
NVDA Bulls Linger, But They Are Not Running
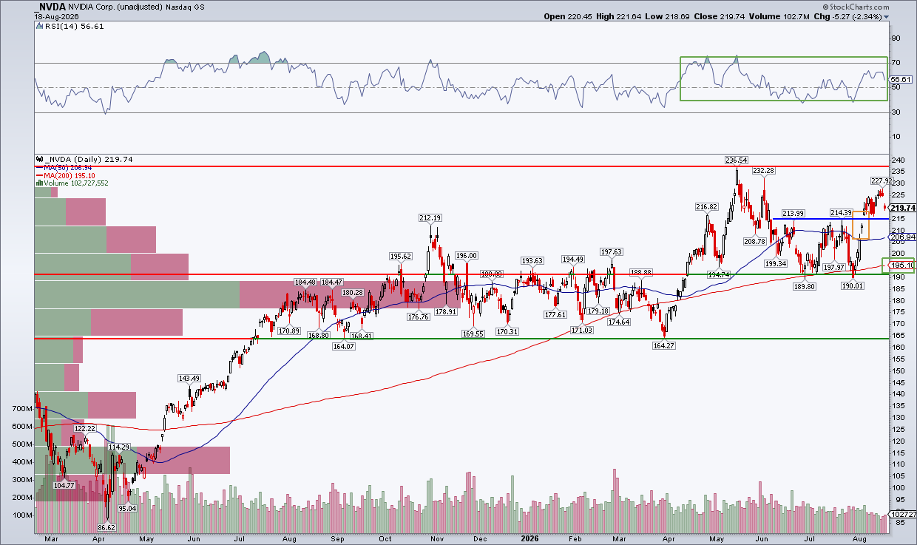
Notice in the chart below that there are no major red flags. NVDA’s long-term 200-day moving average is on the rise, suggesting that the bulls control the primary trend. It has generally been a series of higher highs and higher lows over the course of this year, despite bouts of relative weakness. The 18-month zoom does indicate some vulnerability in the short term, however, as I spot a pair of gaps that could be filled before the quarter is out. The first is near $212, while the second is a few percent lower at $207.
A $10–$15 decline from the current spot would barely be a blip for long-term investors. It would also be hardly significant from a technical standpoint. Leading into the Q2 print, the options market prices in a relatively modest 5.4% earnings-related stock price swing, based on the at-the-money straddle expiring soonest after the release and conference call. That's only $12, with implied vol hovering below 40%. You can check out additional options data using StockCharts OptionsPlay Strategy Center.
Momentum Angle: Good, Not Great
Also look at the RSI momentum oscillator at the top of the SharpChart. It ranges in a bullish zone between 40 and 75, though it hasn’t cracked 70 since the all-time high was notched some three months ago. Bulls want to see a test of that $236.54 peak on strong volume and an RSI burst to help confirm a new, protracted uptrend.
Record Highs in Q3? Totally Doable.
While NVDA’s chart isn’t totally clean, there is a technical target in play. The mega-cap consolidated from $214 to $189 throughout much of June and July, then gapped higher earlier this month. That $25 height, added to the $214 breakout level, yields a measured move upside price objective to $239.
My thesis based on the technicals? NVDA will rally toward that record high, perhaps even marginally eclipsing it, before Labor Day. The action could even get going before the numbers cross the wires, as the firm will present at Hot Chips 2026 in Palo Alto starting Sunday night.
Eyes on $6 Trillion
Such a jolt would bring Jensen’s company to within earshot of a $6 trillion equity valuation, but it would only bring the forward price-to-earnings ratio to the low 20s (near a market multiple). Based on out-year (FY 2027) EPS, we’d still be talking about a high-teens P/E.
Long-Term Support: $190
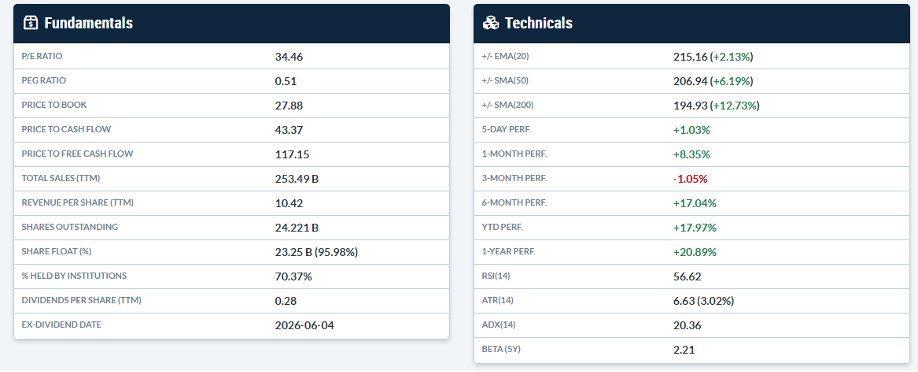
Traders must consider a negative outcome, though, and longer-term support is down at $190, with the 200-DMA possibly offering a cushion. The 18-month chart reveals a high amount of volume-by-price from $175 to $190, so it would take quite a bearish reaction and major sentiment reset to break that zone.
Are Chips Rolling Over?
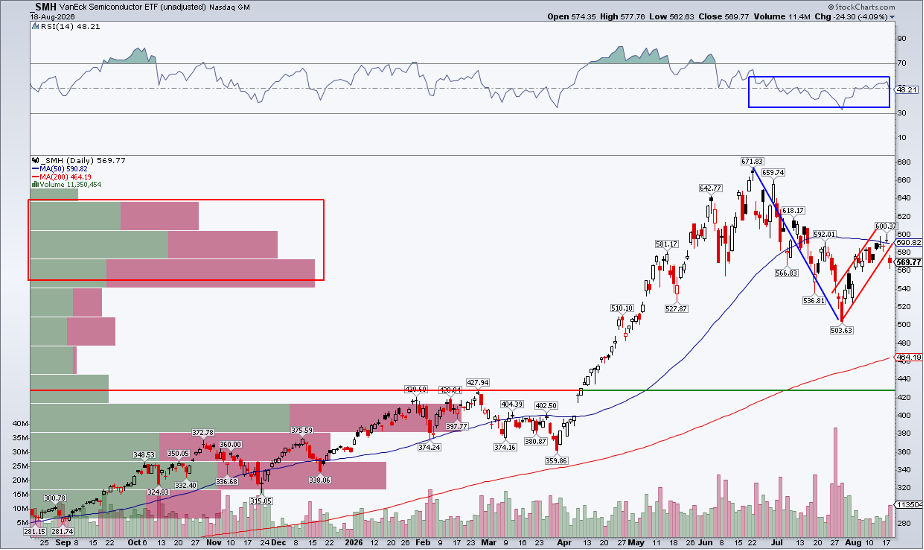
Industry price action matters, too, and the VanEck Semiconductor ETF (SMH) is more worrisome than NVDA. The glamor ETF was rejected for a second time at its now-falling 50-DMA after retracing a bit more than half of the June 22 to July 29 low. It will be challenging for NVDA to reach new highs without some help from the broader chip space.
Conversely, a bullish earnings reaction could lift the entire group, making next Wednesday’s event all the more pivotal. For now, the jump off the “Leopold low” looks tenuous and bear-flaggy. Additionally, SMH has supply of its own to contend with, as there are many “dead bodies” above today’s price, meaning a large number of shares traded above the current level. That overhead supply will make rally attempts tough on the AI bulls.
The Bottom Line
The earnings season isn’t over until Jensen says it is. The world’s largest company by market cap and most pivotal to the AI mega-theme reports Q2 results after the bell on Wednesday, August 26. The call starts at 5 p.m. ET, and Wall Street will listen for Huang’s latest outlook. NVDA has taken a backseat to intensely volatile memory/storage semiconductor names, but that could change in the days ahead, and traders must prepare.
Disclaimer: This blog is for educational purposes only and should not be construed as financial advice. The ideas and strategies should never be used without first assessing your own personal and financial situation, or without consulting a financial professional.