Four Scenarios for the Nasdaq 100 After This Week’s Pullback

With the Nasdaq 100 experiencing its most significant pullback in months, investors are suddenly being forced to reconsider assumptions that seemed obvious just a week ago.
Following an impressive advance from the March low through the end of May, growth stocks have stumbled out of the gate in June. Semiconductor stocks have weakened, the Magnificent Seven have come under pressure, and investors are beginning to ask whether this is simply a healthy correction or the beginning of a more meaningful rotation.
Rather than trying to predict exactly what comes next, let's engage in a probabilistic analysis exercise. Today, we are going to revisit one of my favorite exercises, a probabilistic analysis or “choose your own adventure” approach to considering alternative scenarios. I’ll reveal four potential future paths for the Nasdaq 100 over the next six to eight weeks; by selecting one of the scenarios as the most probable, you’ll cast your vote and clearly articulate your investment thesis. Then, by listening to the four different scenarios and considering all the possibilities and the merits of each outcome, you’ll be able to open your mind to alternative points of view.
Before we get to the current chart and four outcomes for the QQQ, let’s revisit our most recent exercise back in April. We laid out four scenarios, and it turns out that the S&P 500 ($SPX) ended the week almost exactly on the top of the arrow for the super bullish scenario!
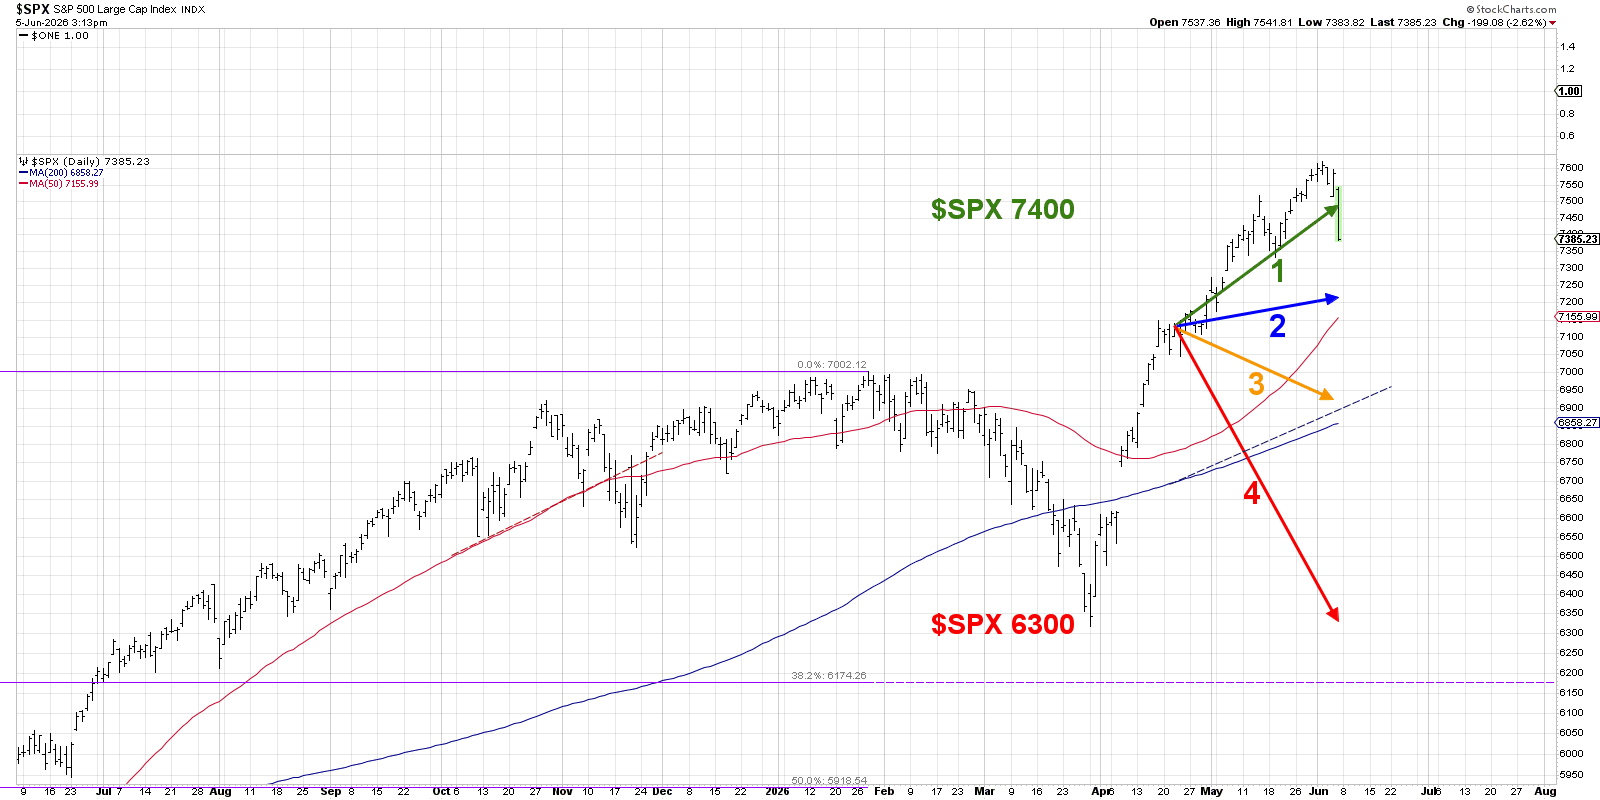
So if you felt back in April that the uptrend for risk assets was just getting started, you were proven correct. The strength in technology names, particularly the semiconductors and key software stocks, was enough to propel the S&P 500 to reach 7600 for the first time in history.
Back to the current markets, let’s review the four scenarios for the Nasdaq 100 ETF (QQQ) between now and late July 2026. As a friendly reminder, the point of this exercise is threefold:
- Consider all four potential future paths for the ETF, think about what would cause each scenario to unfold in terms of the macro drivers, and reflect on what signals/patterns/indicators would confirm the scenario.
- Decide which scenario you feel is most likely and why you think that's the case. Don't forget to drop me a comment and let me know your vote!
- Think about how each of the four scenarios would impact your current portfolio. How would you manage risk in each case? How and when would you take action to adapt to this new reality?
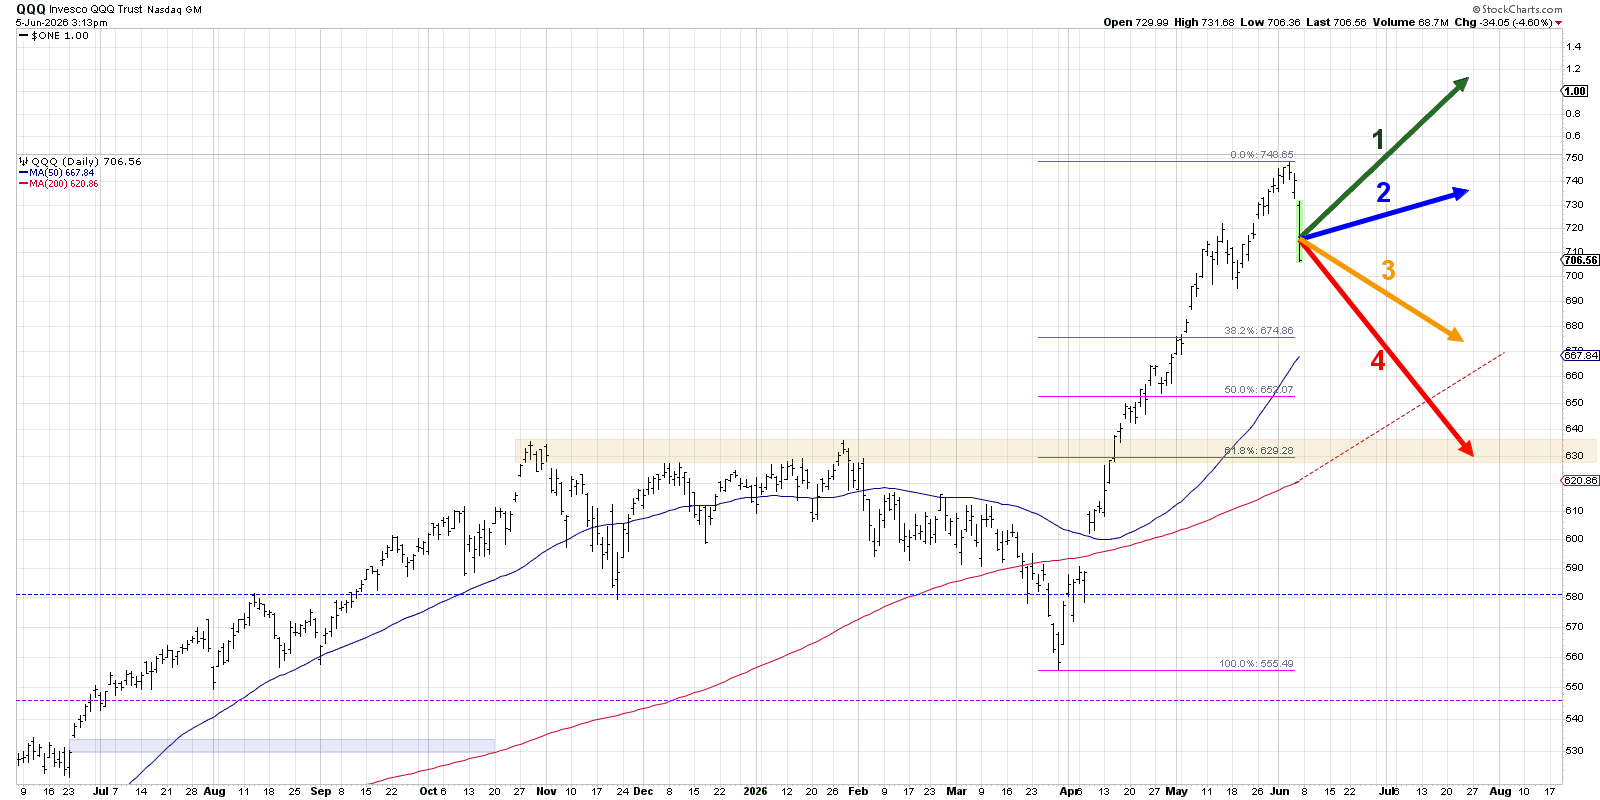
Here’s the chart we’ve created to illustrate the four scenarios. You’ll find a breakdown of each scenario below, along with the probability I’ve assigned to each scenario. Disagree with me? Jump over to my YouTube channel and drop a comment- tell me why I’m wrong!
Let’s start with a super bullish outcome, where the Nasdaq recovers quickly from this week’s drop, as buyers come back to the game in force.
Scenario 1: The Super Bullish Scenario
In the most optimistic scenario, the selloff we've experienced in early June proves to be little more than a brief interruption in an otherwise powerful uptrend. The recent weakness would quickly attract dip buyers eager to add exposure to artificial intelligence, semiconductors, and mega-cap technology stocks. Growth leadership would reassert itself, investor enthusiasm would return, and the Nasdaq 100 would resume its advance toward fresh all-time highs.
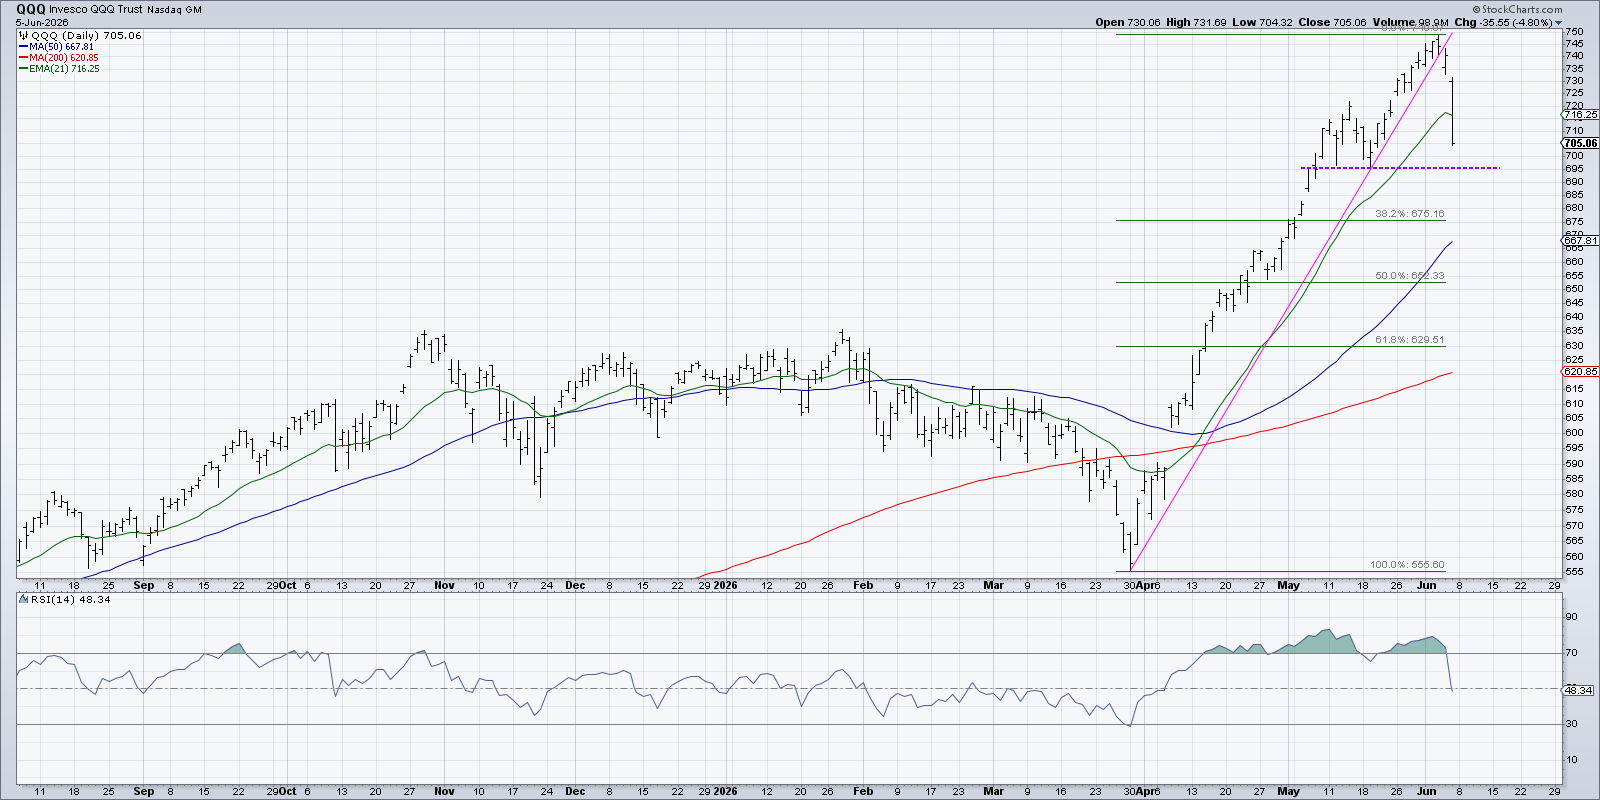
Given the severity of the current pullback, it would be difficult to maintain the same pace of ascent we experienced in April and May. Even so, a recovery toward the $780 area on QQQ by late July would represent a continuation of the dominant bullish trend.
For this scenario to play out, investors would need to view the recent decline as a buying opportunity, rather than the beginning of a larger shift in market leadership.
Dave’s Vote: 5%
Scenario 2: The Mildly Bullish Scenario
The second scenario assumes that the recent weakness in technology is real but not particularly damaging to the broader market. Instead of growth stocks immediately resuming leadership, we could see a healthier rotation beneath the surface. Financials, consumer staples, industrials, and healthcare stocks could attract new capital while technology works through a period of consolidation. In this environment, the Nasdaq 100 may struggle to exceed its early June highs, but the overall market would remain constructive.
The result would be a more measured advance, with the S&P 500 potentially outperforming the Nasdaq 100 and the Dow Jones Industrial Average ($INDU) showing relative strength as investors broaden their exposure beyond the Technology sector.
This scenario would represent a market that remains bullish but becomes less dependent on a handful of growth stocks.
Dave’s vote: 25%
Scenario 3: The Mildly Bearish Scenario
The third scenario assumes that the weakness we're seeing in technology continues through the summer. One potential catalyst would be rising interest rates. Stronger economic data has already caused investors to rethink expectations for Fed policy, and a higher-rate environment tends to create headwinds for growth-oriented stocks. The reason is straightforward. Much of the value assigned to growth companies comes from expected future earnings. As interest rates rise, those future earnings become less valuable in present-value terms, putting pressure on valuation multiples. So higher interest rates could certainly throw cold water on the technology dominance theme.
In this scenario, investors rotate steadily away from growth and toward value-oriented sectors. The Nasdaq 100 retraces a larger portion of its spring rally and declines toward the 38.2% Fibonacci retracement level near 675 on QQQ. By late July, investors would likely be discussing whether the Nasdaq 100 can successfully hold its 200-day moving average. The long-term trend would remain intact, but the market's leadership structure would be changing in meaningful ways.
Dave’s vote: 55%
Scenario 4: The Super Bearish Scenario
Every probabilistic analysis exercise needs a doomsday scenario. In this case, the weakness we're experiencing today is merely the first leg of a much larger decline. Instead of rotating into value stocks, investors shift toward defensive sectors such as Utilities, Consumer Staples, and Real Estate. Risk appetite deteriorates significantly, technology leadership completely breaks down, and the Nasdaq 100 gives back most of its gains from the March-to-June advance.
Under this scenario, QQQ declines toward 630, representing approximately a 61.8% retracement of the entire rally from the March low. More importantly, the Nasdaq 100 would likely fall below its 200-day moving average, raising questions about whether a cyclical bear phase has begun.
Interestingly, this outcome would align fairly well with historical seasonal tendencies. Midterm election years often experience weakness during the May-to-October period, and a larger correction would fit that historical pattern. While certainly not my base case, it's important to acknowledge the possibility and understand what evidence would support it.
Dave’s vote: 15%
Which Scenario Gets Your Vote?
If I had to summarize the four paths:
- Scenario 1 assumes the recent pullback is simply a buying opportunity.
- Scenario 2 envisions a healthy rotation while the broader market remains constructive.
- Scenario 3 suggests a more meaningful correction driven by rising rates and a shift away from growth.
- Scenario 4 assumes the current weakness is the beginning of a much larger decline.
The purpose of this exercise isn't to be right. The purpose is to prepare. By considering multiple outcomes before they occur, we're far less likely to be surprised by market behavior. More importantly, we can identify the signals that would increase or decrease the probability of each scenario and adjust our positioning accordingly.
So which scenario do you find most compelling?
RR#6,
Dave
P.S. Ready to upgrade your investment process? Check out my free behavioral investing course!
David Keller, CMT
President and Chief Strategist
Sierra Alpha Research LLC
marketmisbehavior.com
https://www.youtube.com/c/MarketMisbehavior
Disclaimer: This blog is for educational purposes only and should not be construed as financial advice. The ideas and strategies should never be used without first assessing your own personal and financial situation, or without consulting a financial professional.
The author does not have a position in mentioned securities at the time of publication. Any opinions expressed herein are solely those of the author and do not in any way represent the views or opinions of any other person or entity.