China Stocks Are Beating AI Chip Stocks. Here’s Why It Matters

Key Takeaways
- Chinese ETFs are outperforming semiconductor equities as money rotates away from the AI trade.
- Relative strength charts suggest China’s technical picture is improving after a prolonged slump.
- While long-term trends remain challenging, China could offer diversification opportunities in the second half.
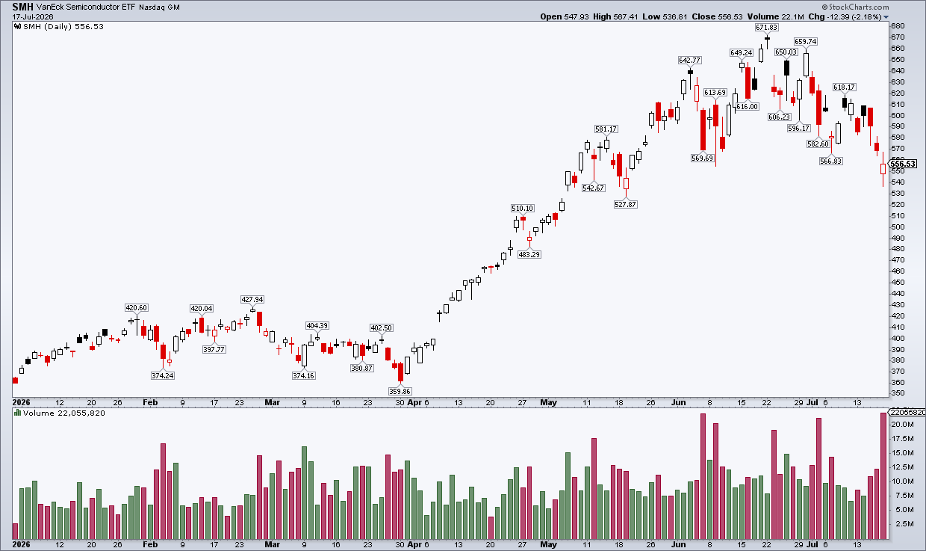
It has been a July to forget for much of the semiconductor space. The VanEck Semiconductor ETF (SMH) was within a couple of percentage points of its all-time high on the final trading day of the first half, then reached technical bear-market territory last Friday before a late-session rebound on options expiration.
As steam lets out of the AI trade, it’s fascinating to spot pockets of alpha amid the rotation.
One country keeps popping up on my daily market checks: China.
Despite falling with the broader market to close last week, the iShares China Large-Cap ETF (FXI) is up 13% from its late-June low. The long-underperforming nation has been led by a 25% July surge in Alibaba (BABA) shares, along with double-digit advances in names like PDD (PDD) and JD.com (JD). Recent news surrounding BABA’s AI engine, Qwen, comes as SpaceX's Elon Musk and OpenAI's Sam Altman sling insults at each other on social media.
Price speaks louder than words, though, and China’s absolute and relative strength thus far in the third quarter should not go unnoticed.
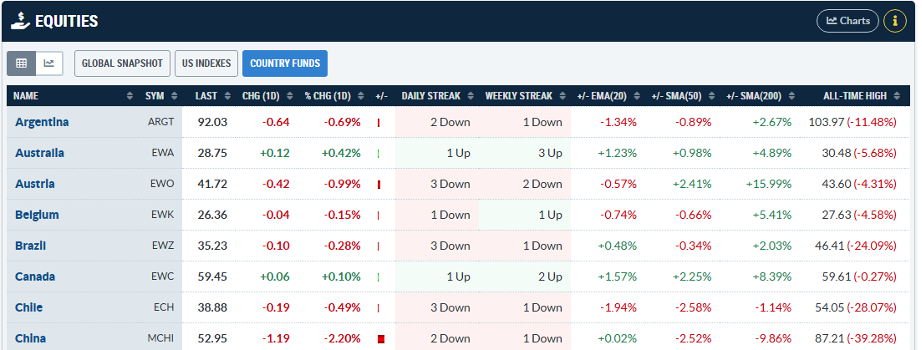
Zooming out, I’d encourage traders to review technical data across all the major country ETFs using the StockCharts Market Summary page. Right near the top, you’ll find the “Equities” section and the “Country Funds” tab to the right of “Global Snapshot” and “US Indexes.” The default China ETF is the iShares MSCI China ETF (MCHI), which trades similarly to FXI and has about $2 billion more in AUM. Both are solid China proxies.
The Relative Strength Story
On the surface, FXI and MCHI don’t appear to have much going for them. Consider that MCHI closed lower last week, and it’s merely at its short-term 20-day exponential moving average according to the Market Summary page. But two relative performance views raise eyebrows.
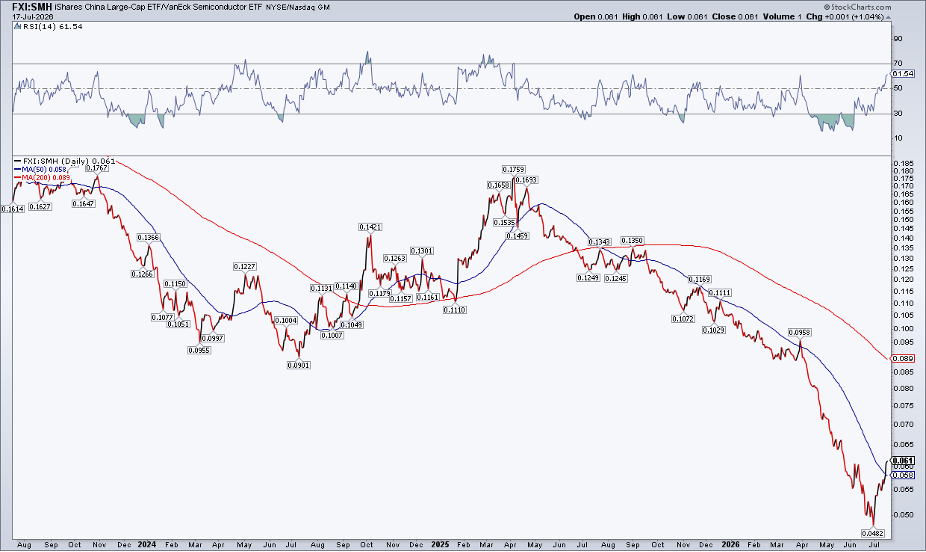
First, let’s compare FXI to SMH. Notice where, in the chart below, an impressive V-bottom appears. The China large-cap ETF prints a fresh two-month high compared to global chip stocks. I’ve also made this a log-scale chart, which is generally good practice when the y-axis price scale is wide. Applying a 50-day moving average, we find that FXI:SMH is the furthest above that trend-indicator line since early 2025.
Also, take a look at the RSI momentum oscillator at the top of the chart. It has climbed to its best mark going back to April of last year. In short, an increasing number of indicators suggest a durable China bounce relative to what was once the red-hot semiconductor trade.
Next up is FXI paired against the iShares MSCI South Korea ETF (EWY). Same story, as FXI is at a multi-month relative high with much-improved RSI momentum. The FXI:EWY RSI oscillator notched a series of higher lows as the first half drew to a close, suggesting a bullish divergence between momentum and price. It’s the kind of indicator you want to see when sifting for tradable bounces.
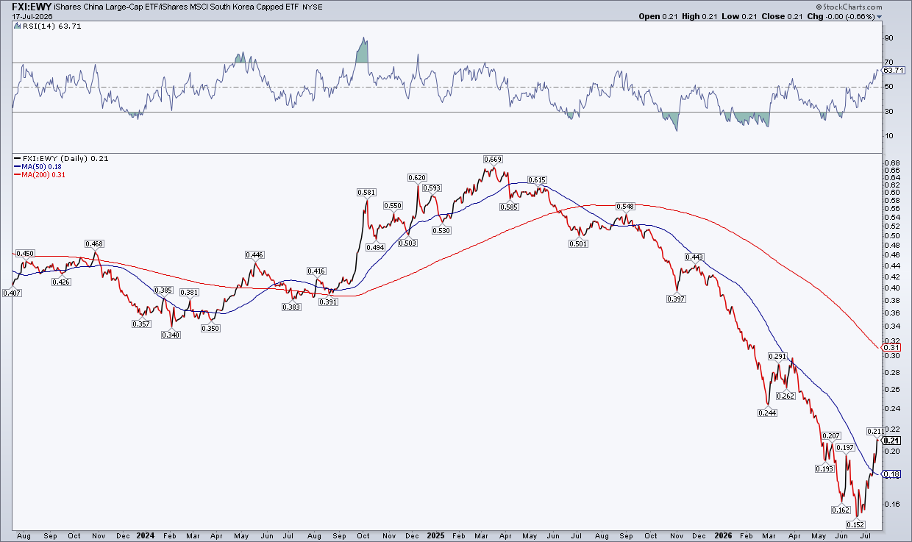
To be clear, both relative strength charts point to a lot of wood for the China bulls to chop, as evidenced by falling long-term 200-day moving averages and considerable overhead supply of shares.
After protracted downtrends, congestion at previous polarity levels leaves many so-called "dead bodies" on the chart.
A Bull Market? Not Yet.
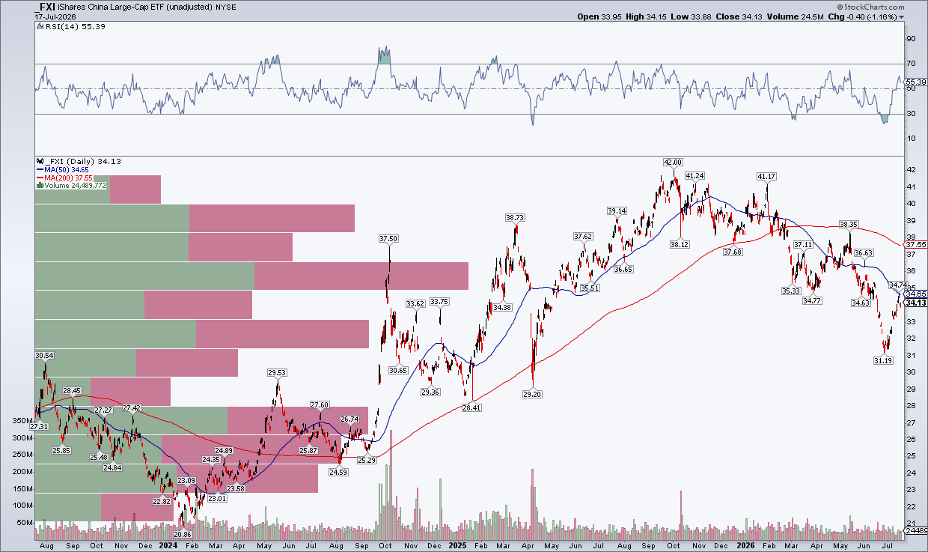
Unfortunately, the absolute FXI chart won’t get the bulls excited. The 50-DMA and 200-DMA are declining, asserting that the bears control the short- and long-term trends. Moreover, lower highs and lower lows have been the technical zeitgeist since last October, with FXI just now testing a key resistance spot near $35. I’d like to see it close above $39, which would take FXI above the May peak while also taking out the 200-DMA; this would be a healthy confirmation signal.
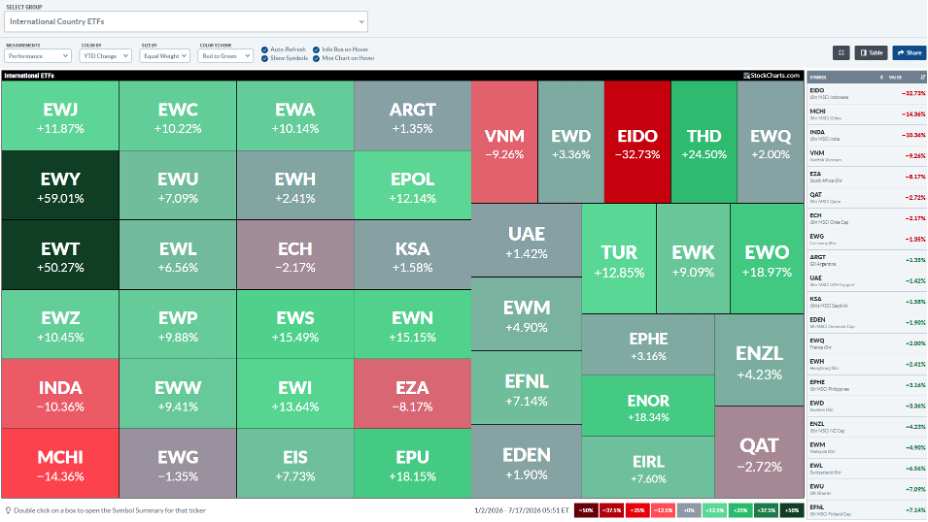
Here’s another tool to help you globe-trot with your portfolio. StockCharts’ MarketCarpets offers a heat-map summary of all the major country ETFs. I prefer to measure performance across timeframes using equally0weighted boxes (I often go with market-cap-weighted for individual stocks and price-weighted if I’m analyzing the Dow Jones Industrial Average).
Right now, it’s red across the board beyond the 5-day carpet, but be sure to check back at month-end to see how China (MCHI) appears versus the world. It could end up being one of the bullish standouts.
Seasonality Adds a Caveat
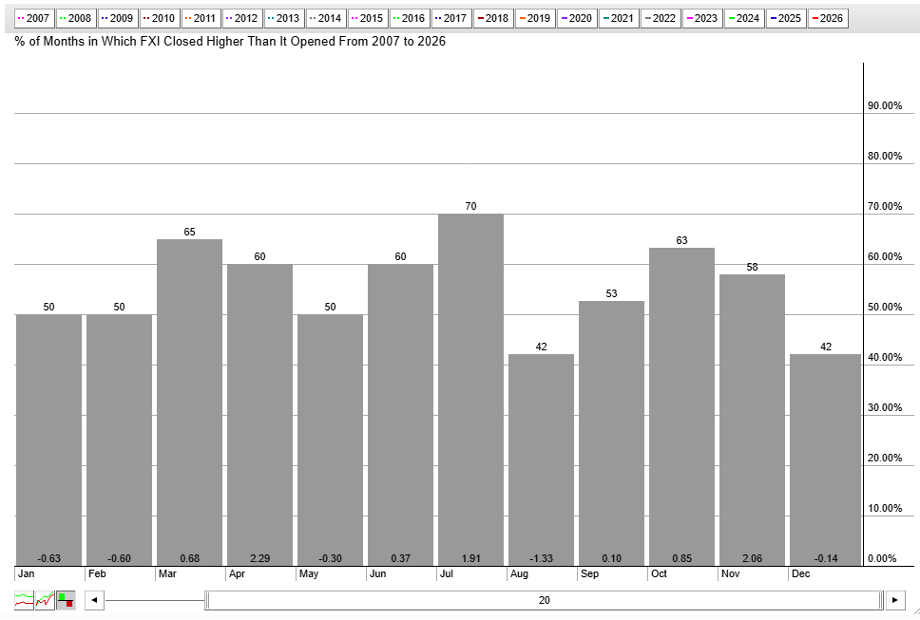
Speaking of the calendar, it’s not uncommon to see Chinese equities perform well at the beginning of the second half. July has been among the best months since 2007, averaging a 1.9% gain and finishing higher 70% of the time. Seasonality then favors the bears in August and September, a stretch that often features increased volatility.
There’s rarely a totally clean trading idea, and this is certainly a cautionary factor. Of course, seasonality is a secondary indicator to price.
The Bottom Line
As AI chip stocks come back down to earth, certain areas of the world are catching a rotational bid. China is among them. Both FXI and MCHI boast July relative strength after a “quarters-long” downtrend. It’s not a purely bullish situation, but adding some China exposure could offer diversification benefits as the rest of the year plays out.
Disclaimer: This blog is for educational purposes only and should not be construed as financial advice. The ideas and strategies should never be used without first assessing your own personal and financial situation, or without consulting a financial professional.