Gold's Biggest Pullback in Years: Is a Rally Around the Corner?
Gold prices have retreated sharply since reaching their late-January peak, making it reasonable to anticipate firmer prices and even a potential new all-time high.
Gold Is Oversold
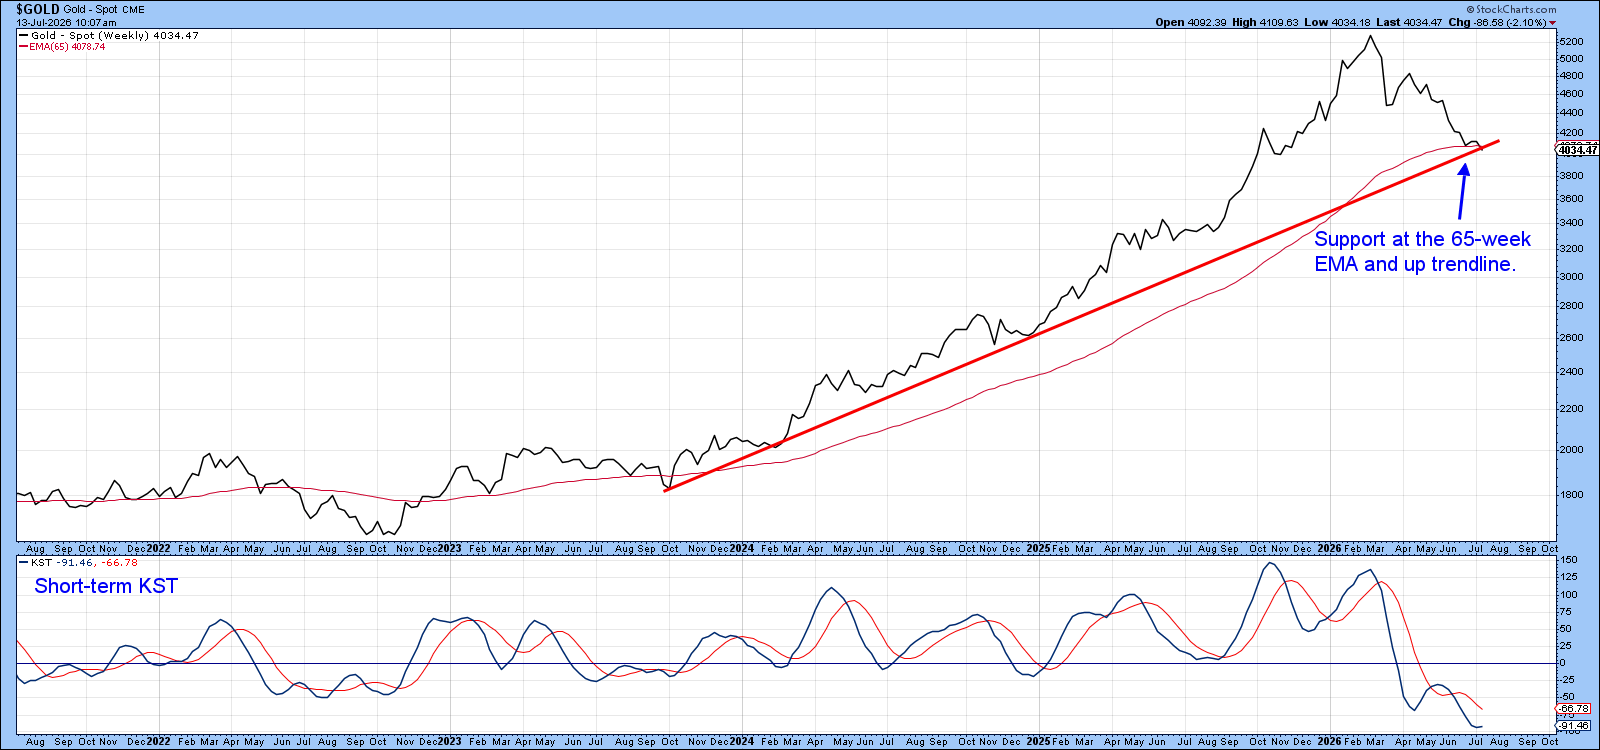
Chart 1 shows that, on a weekly closing basis, gold has declined to an important support zone defined by its 65-week exponential moving average (EMA). Adding to the significance of this area is the uptrend line that has been in place since late 2023, which currently converges with the EMA, therefore reinforcing it as a support zone.
When a market goes through a steep decline, as gold has recently, a support level often becomes more meaningful because a considerable amount of downside momentum has already been expended by the time it’s reached. Consider the analogy of someone attempting to break through a door. If they begin their run only 15 feet away, they are likely to hit it with much greater force than if they started 25 yards away and became exhausted before reaching it. The door offers the same resistance in both cases, but the second runner arrives with far less energy and is therefore more likely to bounce back rather than break through.
A similar dynamic may now be at work in the gold market. The recent decline appears to have consumed a substantial amount of selling pressure, reducing the market's downside energy as it approaches a major support area. This loss of momentum is reflected in the deeply oversold reading of the short-term Know Sure Thing (KST) indicator, suggesting that the conditions for a rebound are increasingly falling into place.
That said, an important question remains: If a rally does develop, what form is it likely to take? Will it prove to be nothing more than a short-term rebound from an oversold condition, or will it have enough strength to carry gold to new all-time highs? For a third possibility, could the metal may spend the next several months, or even years, trading within a broad consolidation range, working off the excesses of its previous advance before the next major trend emerges? To answer properly, we first need to place the current technical structure in context. Only then can we determine whether the next advance is likely to be a brief recovery rally, a move to new highs, or part of an extended trading range.
A Major Sell Signal Has Been Triggered
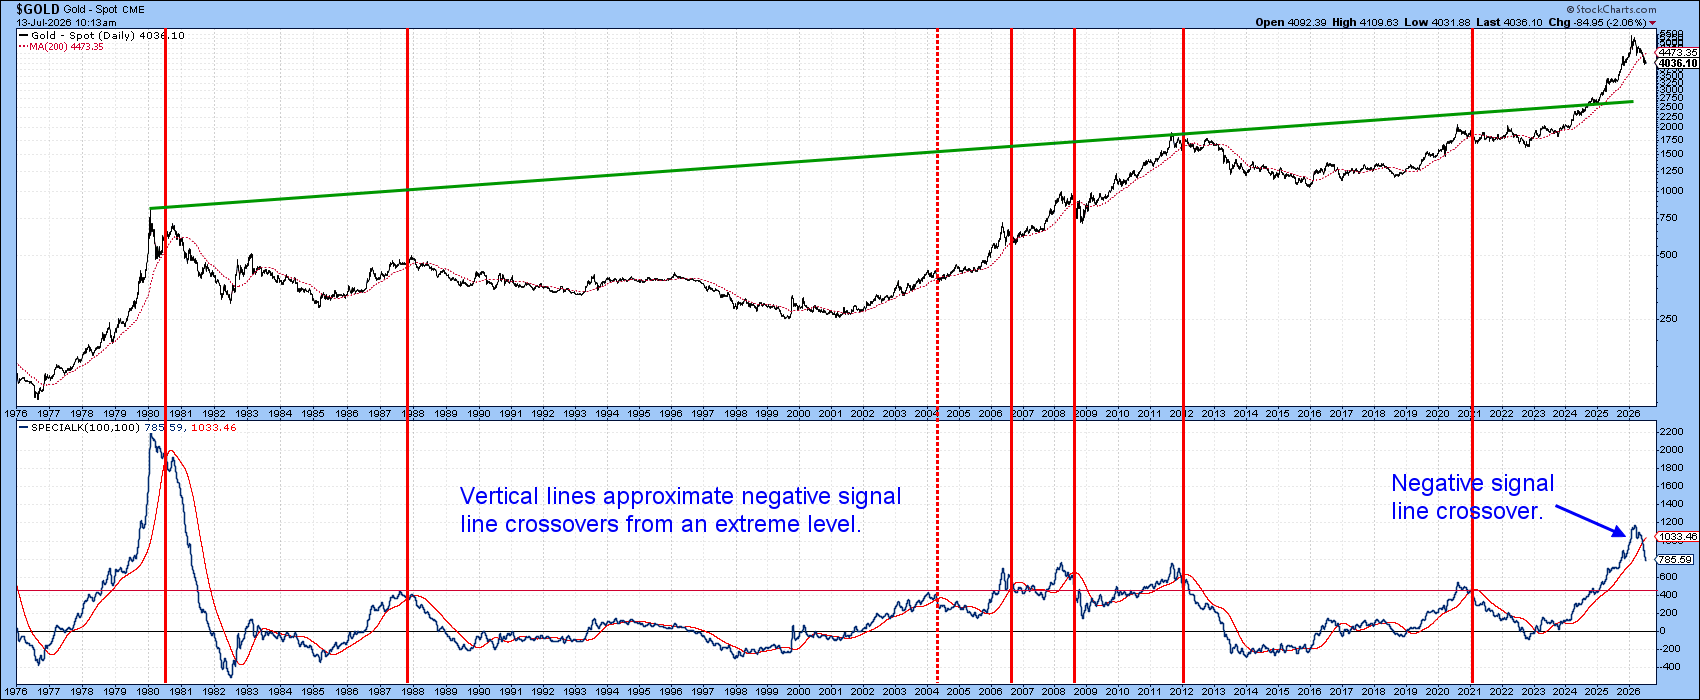
Chart 2 compares the gold price with its Special K (SPK) indicator going back to the mid-1970s. The vertical lines highlight periods when the SPK crossed decisively below its signal line after having risen above the red horizontal line signaling an overstretched market. There is little doubt that last month's violation qualifies as a decisive negative crossover, the seventh such signal since 1980. Equally noteworthy is that the latest crossover occurred from the highest SPK reading since the 1980 mega peak.
History shows that the consequences of these bearish crossovers have varied widely. In some cases, such as 2004, they amounted to little more than a temporary interruption within an ongoing bull market. At the other extreme, the 1980 signal marked the beginning of a long secular bear market. The wide range of outcomes underscores the fact that no single indicator can reliably predict the future. Nevertheless, the historical record suggests that signals of this magnitude typically emerge after periods of exceptional enthusiasm and extended price advances, conditions that often require considerable time to unwind.
While it is impossible to know with certainty how the current signal will ultimately play out, the balance of probabilities points to a more challenging backdrop for gold over the next couple of years.
Silver in a Similar Position as Gold
In a broad sense, silver and gold tend to move in the same direction over the long run, and the technical outlook for silver is currently raising some of the same caution flags as gold.
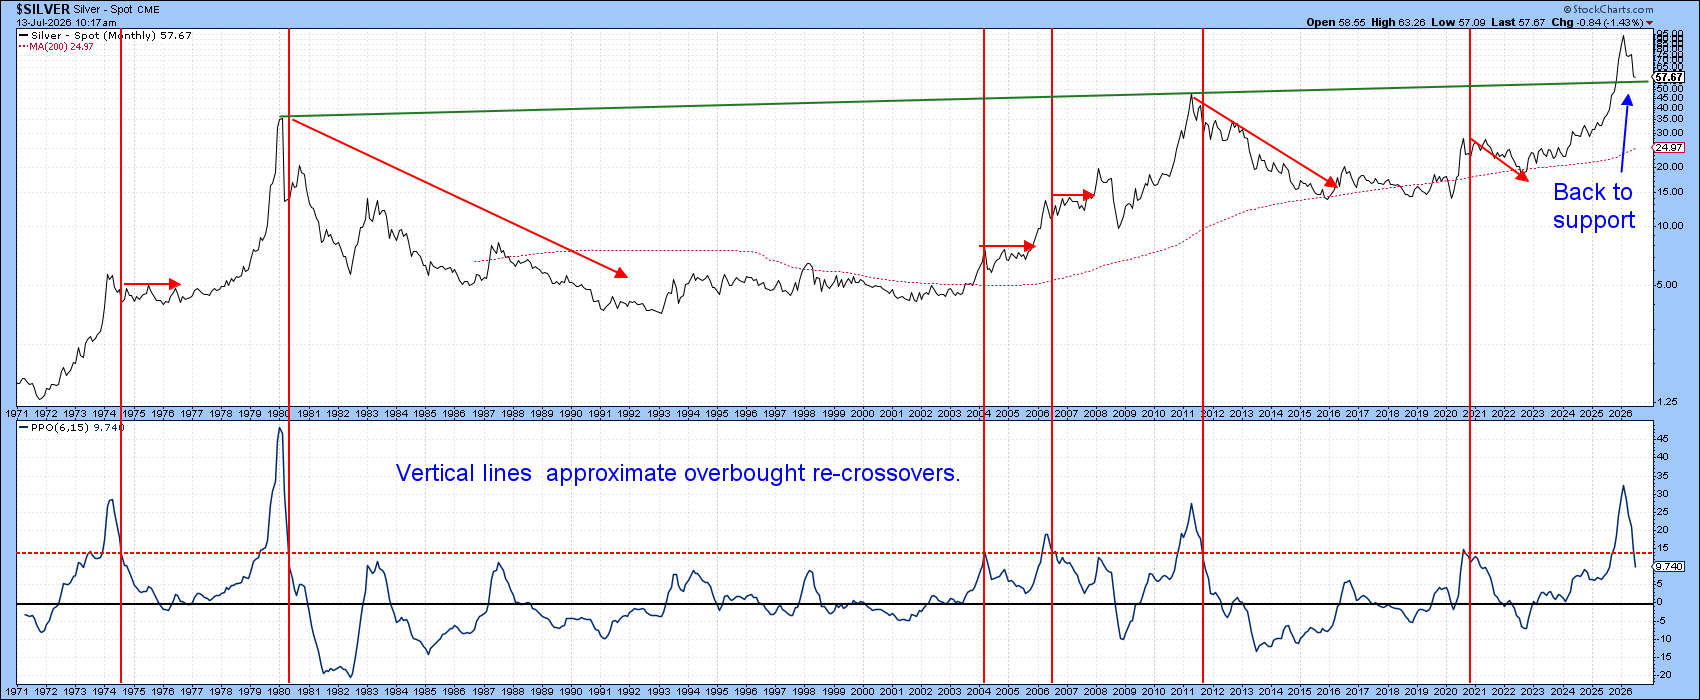
Chart 3 plots a monthly Price Percentage Oscillator (PPO) for the gray metal going back to 1971. Over those 55 years, the indicator has moved above its red-dashed overbought threshold and then crossed back below it on six previous occasions. Earlier this year, a seventh such signal was triggered. All previous examples were followed by a period of extended consolidation or a bear trend.
Like gold, silver is deeply oversold on a short-term basis, suggesting that much of the recent selling pressure may already have been exhausted. In addition, the metal is trading just above an important support zone defined by the extension of a long-term green trendline, a level that previously acted as resistance before being overcome. As is often the case in technical analysis, old resistance has the potential to become new support.
Taken together, these factors suggest that silver is vulnerable from a longer-term momentum perspective, but also increasingly positioned for a near-term recovery.
The Bottom Line
Historical precedent suggests that gold and silver have recently experienced an important peak of some kind. The longer-term momentum evidence points to a prolonged consolidation, or bear market, with little likelihood of the 2026 peaks being surpassed for at least two to three years. For now, though, the technical backdrop argues for a relief rally of some kind.
Good luck and good charting,
Martin J. Pring
The views expressed in this article are those of the author and do not necessarily reflect the position or opinion of Pring Turner Capital Group of Walnut Creek or its affiliates. The Six Stages of the Business Cycle are followed each month in Martin Pring’s Intermarket Review.