The Best Five Sectors This Week #75
Key Takeaways
- Technology dropped over 4%, heavily impacting overall portfolio performance.
- Financials gained 0.1%, climbing to the second spot in sector rankings.
- The Top Five composition remains unchanged.
- Portfolio underperformance widened to 9% since inception, despite improved diversification.
Technology Takes a Hit, Financials Rise
Last week, the S&P 500 ($SPX) index slipped just over 1%. Beneath the surface, though, there were some sharp contrasts across sectors.
Technology, still the largest holding, fell more than 4%. This significant drop weighed heavily on our overall performance. Energy, not currently in the portfolio, surged 3.7%. Financials were up 0.1%, a modest but positive contribution from our holdings. Industrials and Health Care lost 1.9% and 1%, which hurt the performance. Real Estate provided a positive offset with a gain of 1.4%.
Despite some bright spots, these numbers and their respective portfolio weightings weren’t enough to keep pace with the S&P 500. We lagged the benchmark by 1% this week, widening our underperformance to nearly 9% since the index’s inception. The main culprit: the steep decline in Technology.
Shifts in Sector Rankings
These results led to some shifts within the top five, though the overall composition remains unchanged. Technology remains at the top spot, while Financials leapfrogged from fourth to second. As a result, Industrials and Health Care each dropped one position to third and fourth, respectively. Real Estate remains steady at fifth.
In the lower half, Energy jumped from tenth to sixth. Consumer Staples stayed at seventh. Utilities (7), Materials (8), and Consumer Discretionary (9) were all pushed down one position. Communication Services remains at the bottom in 11th.
- (1) Technology - XLK [53%]
- (4) Financials - XLF [19%]*
- (2) Industrials - XLI [12%]*
- (3) Health Care - XLV [13%]*
- (5) Real Estate - XLRE [3%]
- (10) Energy - XLE*
- (7) Consumer Staples - XLP
- (6) Utilities - XLU*
- (7) Materials - XLB*
- (9) Consumer Discretionary - XLY*
- (11) Communication Services - XLC
Weekly RRG
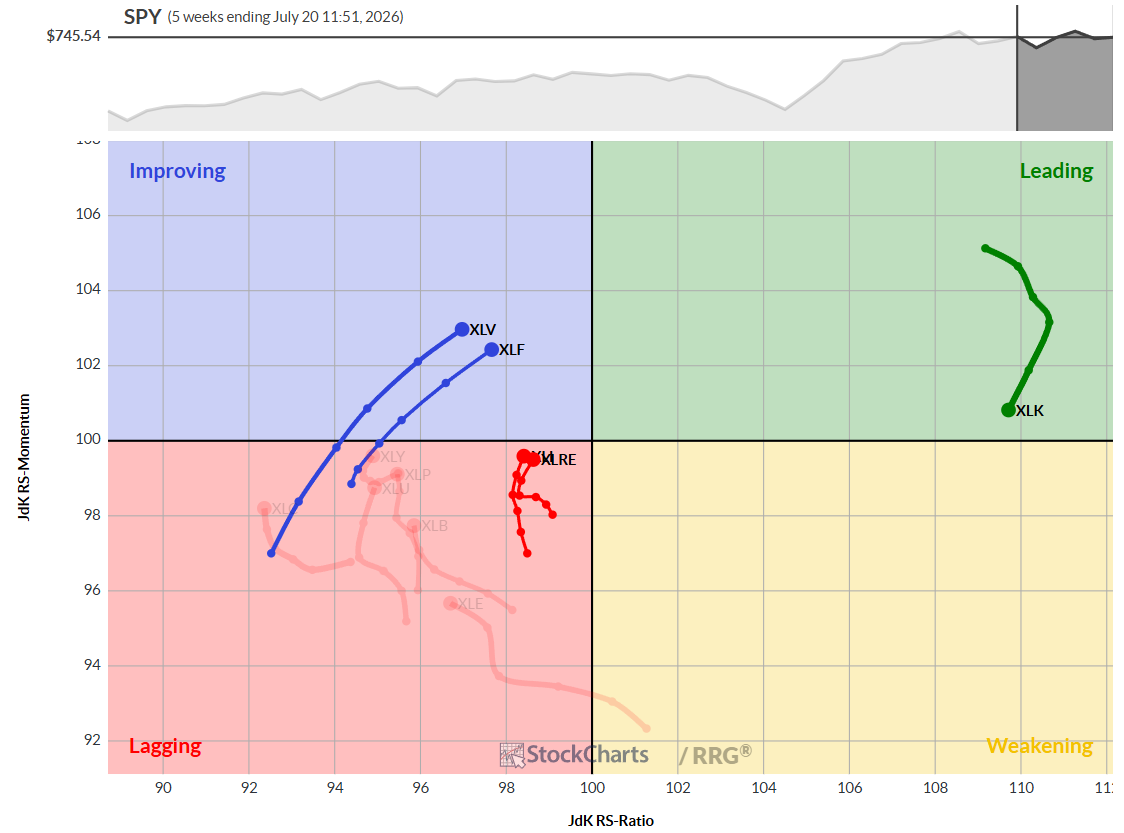
Technology stands alone in the leading quadrant and is the only sector on the right side of the graph. Health Care and Financials are rapidly improving, which explains their rise in the rankings. Industrials and Real Estate, while in the lagging quadrant, are still among the best of the rest and remain in our top five.
Daily RRG
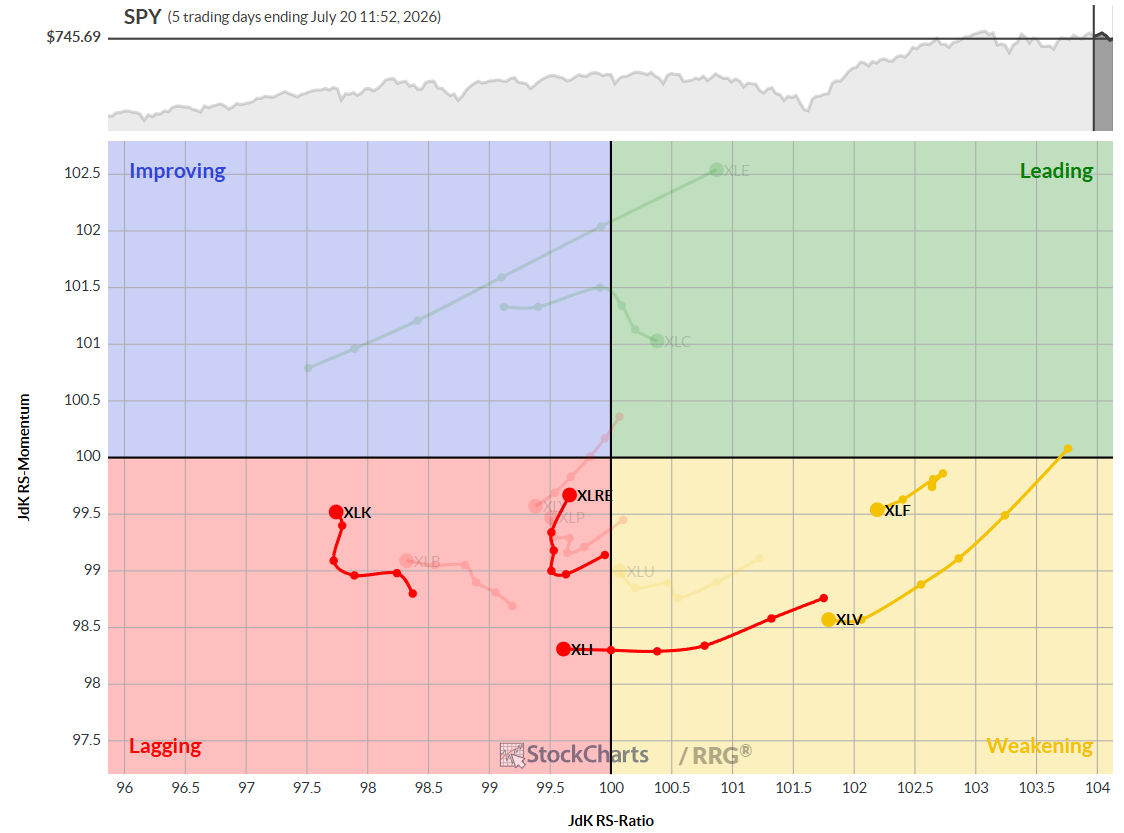
On the daily chart, Financials and Health Care, strong on the weekly, are rotating through the weakening quadrant. Technology, though in the lagging quadrant, appears to be completing its corrective phase and is pushing back toward improvement. However, it’s at its lowest daily reading, which is concerning, though the weekly chart keeps it in the top five. The key question is whether Technology can sustain its leading position. See my Trouble for Technology article last week.
Industrials and Real Estate are both in the lagging quadrant on the daily RRG, but Real Estate is already showing signs of recovery, which could eventually boost its weekly performance as well.
Sector Highlights
Technology
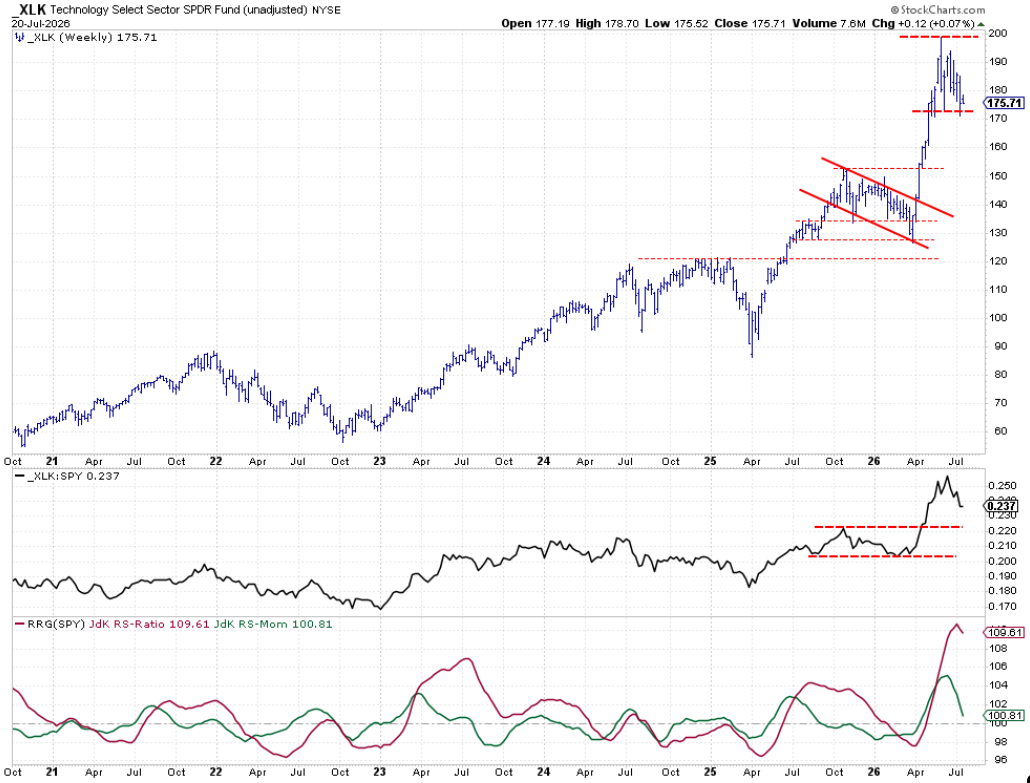
The sector’s chart remains unchanged, with prices moving sideways between support at 170 and resistance just below 200. Relative strength is declining but should find support at last year’s peak. Both RRG lines are trending lower but remain above 100.
Financials
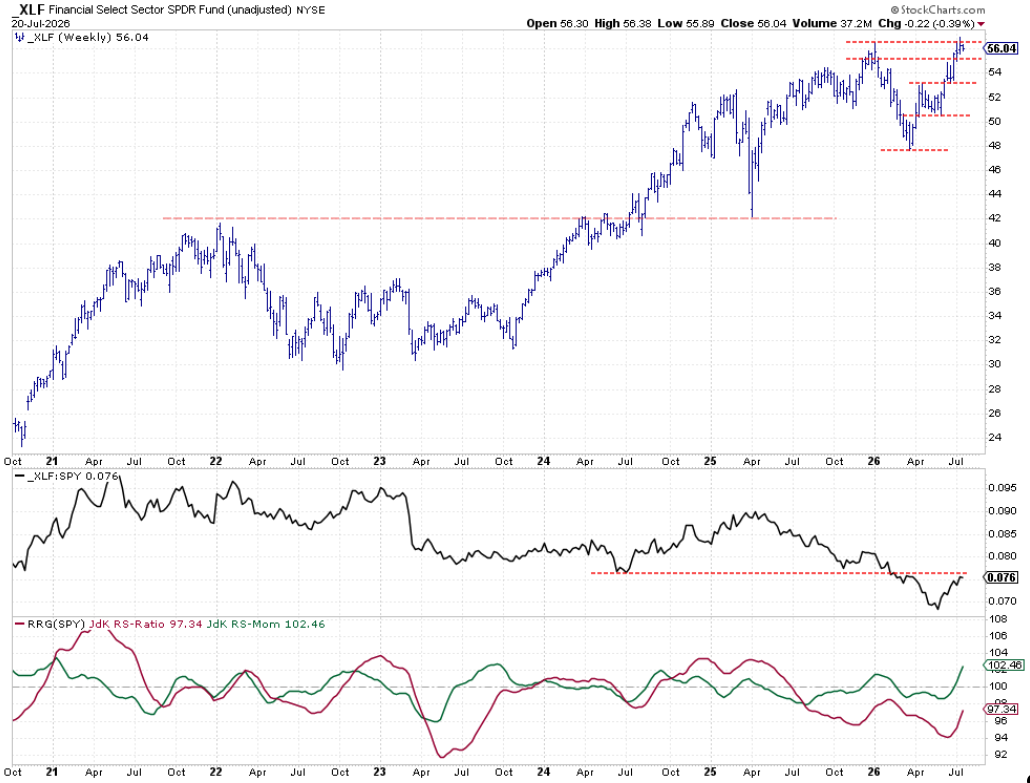
Financials are improving, but face overhead resistance on the price chart. Breaking through this barrier is essential for further gains. Relative strength is approaching resistance, coming off lows from summer 2024 and late 2025. Both RRG lines are moving higher, supporting a positive outlook.
Industrials
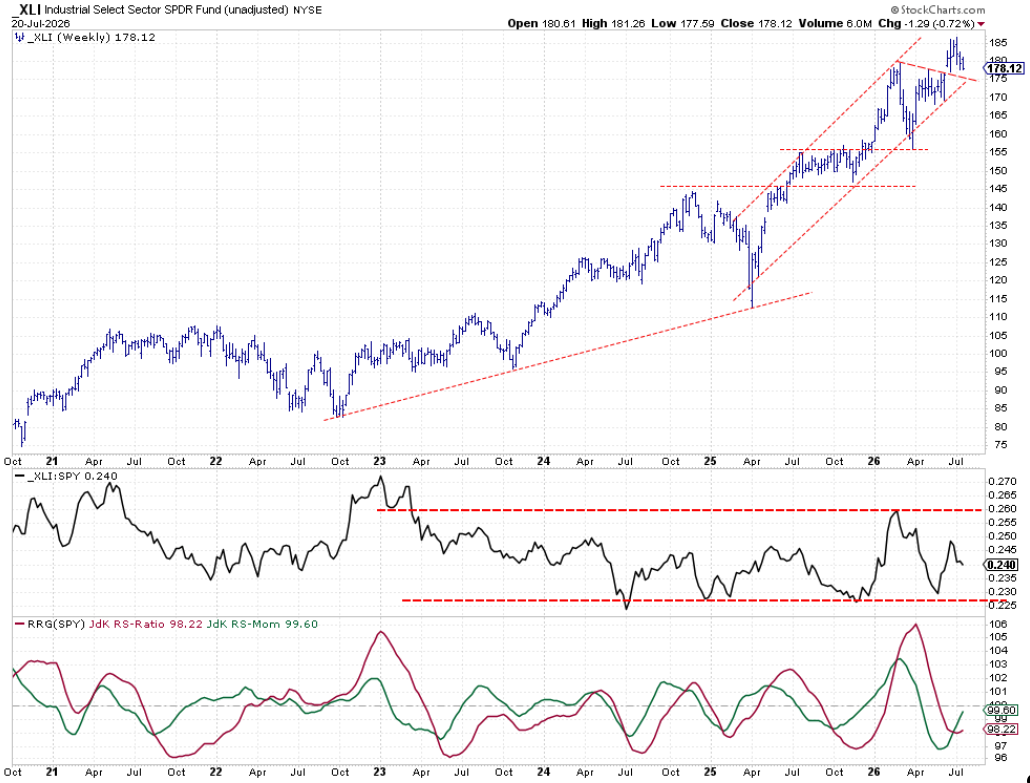
Industrials remain within a rising channel and above the breakout level of their consolidation pattern. Relative strength is in a broad range, but both RRG lines are moving higher, giving the sector a positive heading despite being below 100.
Health Care
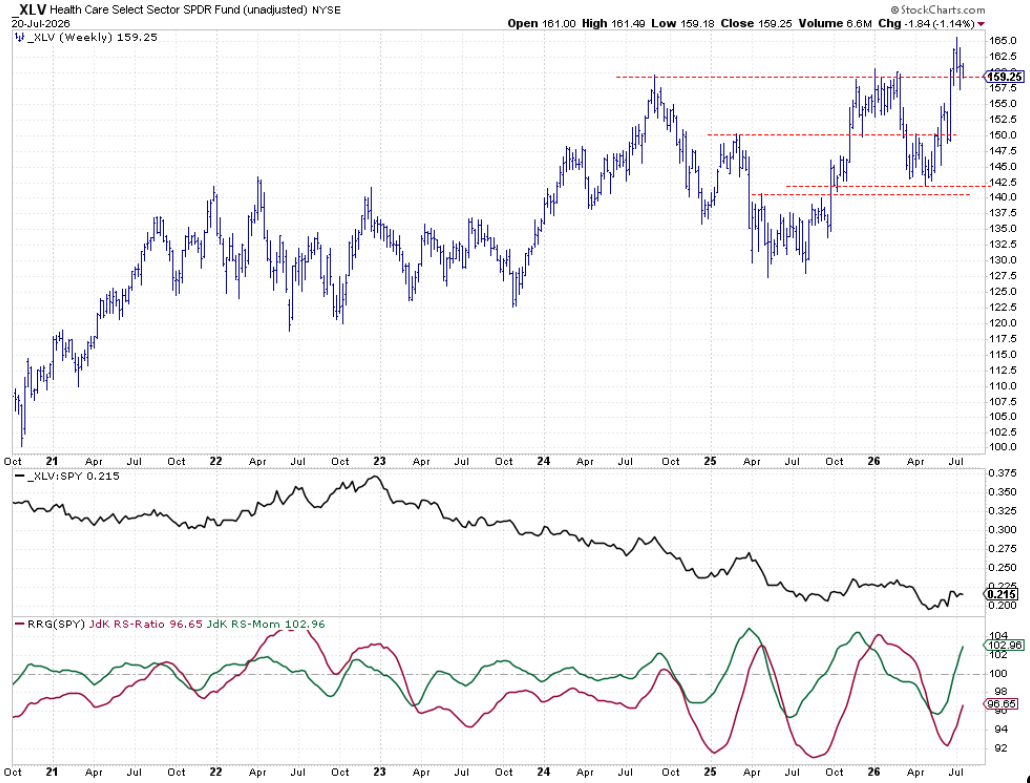
Health Care continues to test old resistance as support and is holding up so far. The relative strength line is stabilizing and may be emerging from its downtrend that began in 2023. Both RRG lines are moving higher, placing Health Care in the improving quadrant.
Real Estate
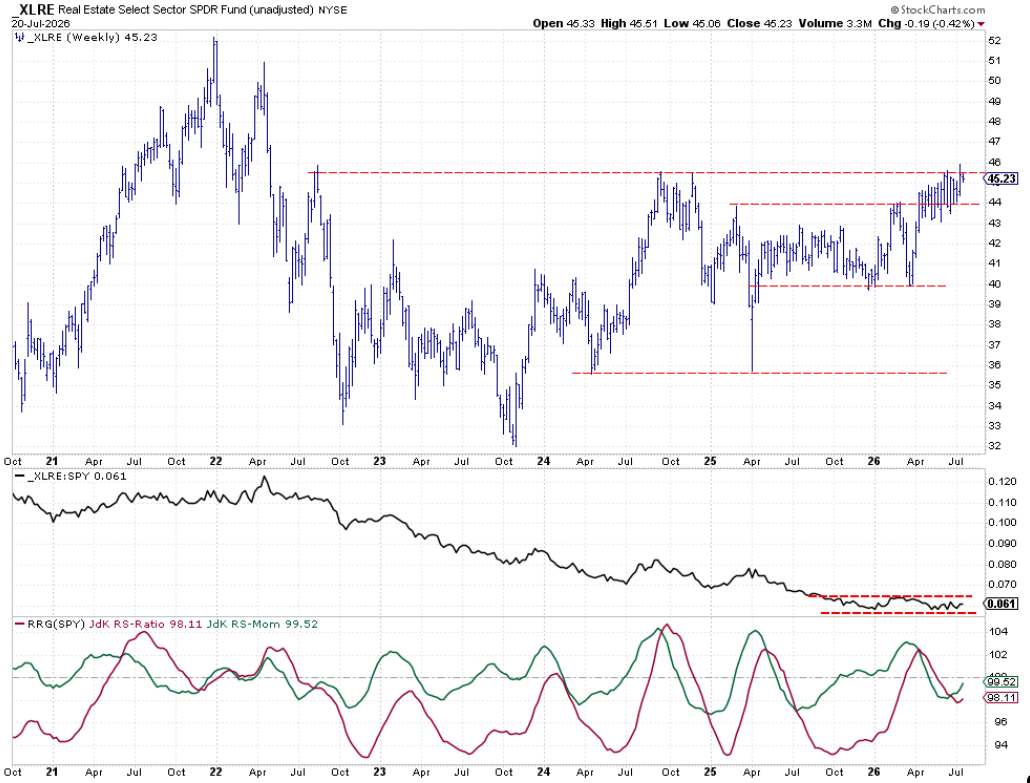
Real Estate is attempting to break out of a sideways pattern, with resistance around 45.50. Last week saw a brief move above this level, but it closed below. A breakout in both price and relative strength would be a strong positive. Both RRG lines are curling up, indicating potential improvement.
Portfolio Performance

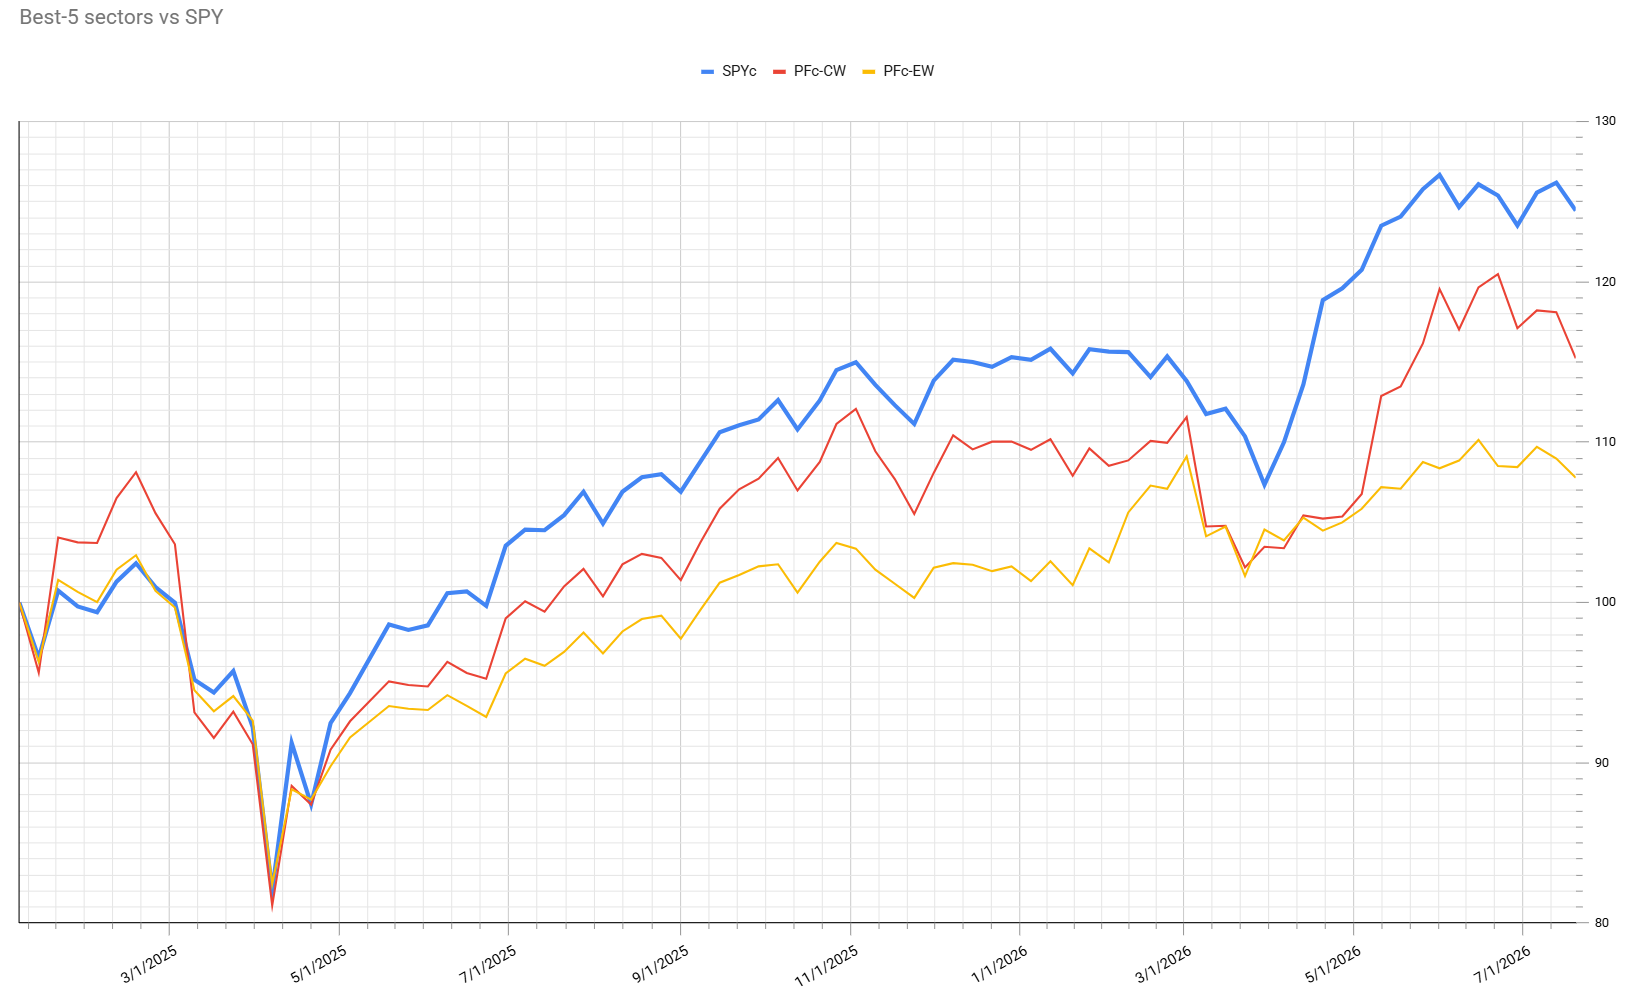
The top five sector composition remains unchanged, with technology still commanding the largest weighting at 53%. However, market capitalization is now more evenly distributed among the top sectors. Financials, Industrials, and Health Care each hold over 10%, with healthcare near 19%. This diversification is a healthier balance compared to a few weeks ago, when technology dominated.
The setback from Technology’s weak performance has widened the performance gap with the S&P 500 again to around 9% since inception.
StayAlert, -Julius