Consumer Confidence at Critical Technical Crossroad

The stock market is constantly influenced by changing levels of consumer and investor confidence. One useful way to measure these shifts is by the ratio of Consumer Discretionary stocks to Consumer Staples stocks (XLY:XLP). When this ratio rises, it indicates that consumers are confident enough to spend on non-essential, discretionary goods and services rather than limiting purchases to everyday necessities. Conversely, a declining ratio suggests a more cautious mindset, with consumers becoming increasingly focused on essential purchases and tightening their spending habits.
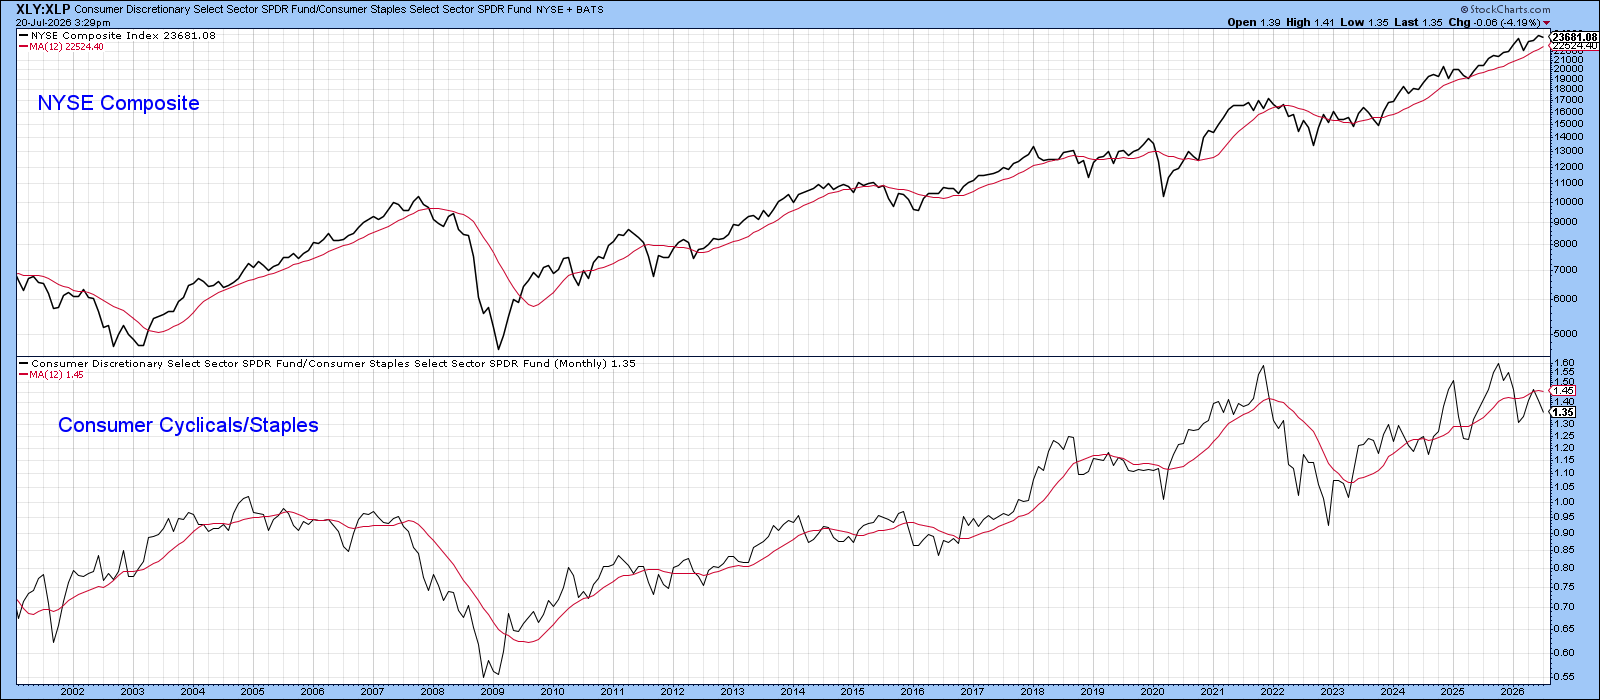
This relationship, as shown in Chart 1, has historically been linked to major swings in the stock market. Consequently, a rising XLY/XLP relationship is typically associated with a primary bull market trend and vice versa. Although it’s possible to compare the ratio directly with the progress of the NYSE Composite ($NYA), the jagged nature of this relationship makes it difficult to consistently identify important reversals.
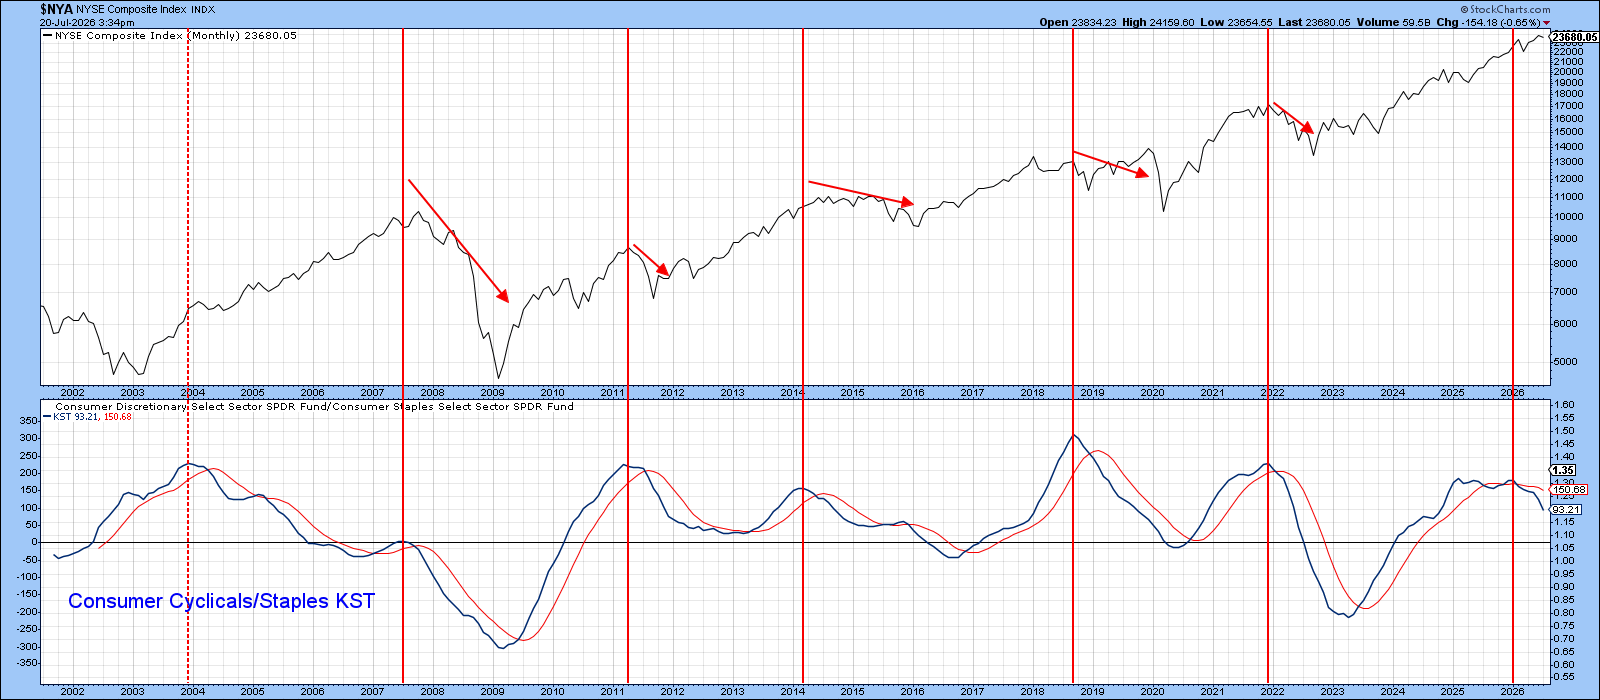
A better way to approach this is by comparing the $NYA to the long-term momentum of the ratio itself. Chart 2 illustrates this momentum using the long-term Know Sure Thing (KST) indicator, with its peaks serving as signals for potential turning points. The red vertical lines mark the approximate locations of these turns. Looking at the price action following each line, equities have generally either pulled back or entered phases of increased volatility.
The KST turned down again in early 2025, yet the NYSE Composite has continued to rally despite that weakening signal. Since market rallies tend to hold up better when they're backed by rising consumer confidence, the key question now is whether this ratio still has more room to weaken.
The simple answer is yes. The following charts collectively demonstrate that the XLY/XLP ratio has fallen to a critical juncture.
Chart 3 shows that the ratio has declined to its 2023–2026 uptrend line and is now trading well below its 200-day moving average. A decisive break and sustained move below this trendline would constitute a serious technical development, since it would signal a violation of a trend that has been in force for several years. The Special K (SPK) has already broken below both its signal line and its own 2023–2026 support trendline, increasing the probability that the ratio itself will eventually follow suit.
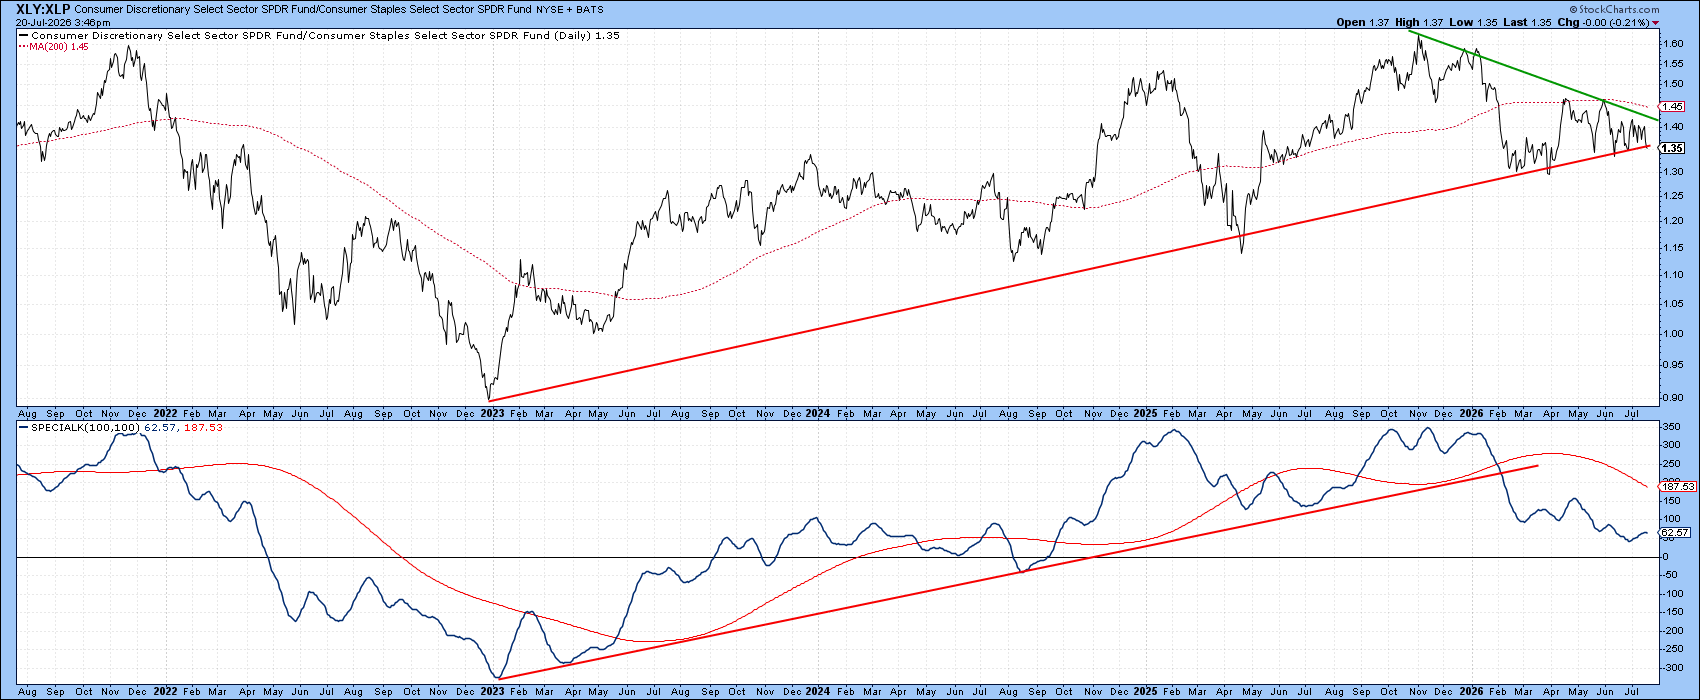
Chart 4 further underscores the importance of the ratio's current position. The relationship has effectively reached a "make-or-break" point. In this case, a "make" outcome would involve a decisive rally above the green downtrend line, signaling renewed confidence and improving relative strength for discretionary stocks. A "break", on the other hand, would be confirmed by a violation of the red support trendline, indicating that consumers are becoming increasingly defensive.
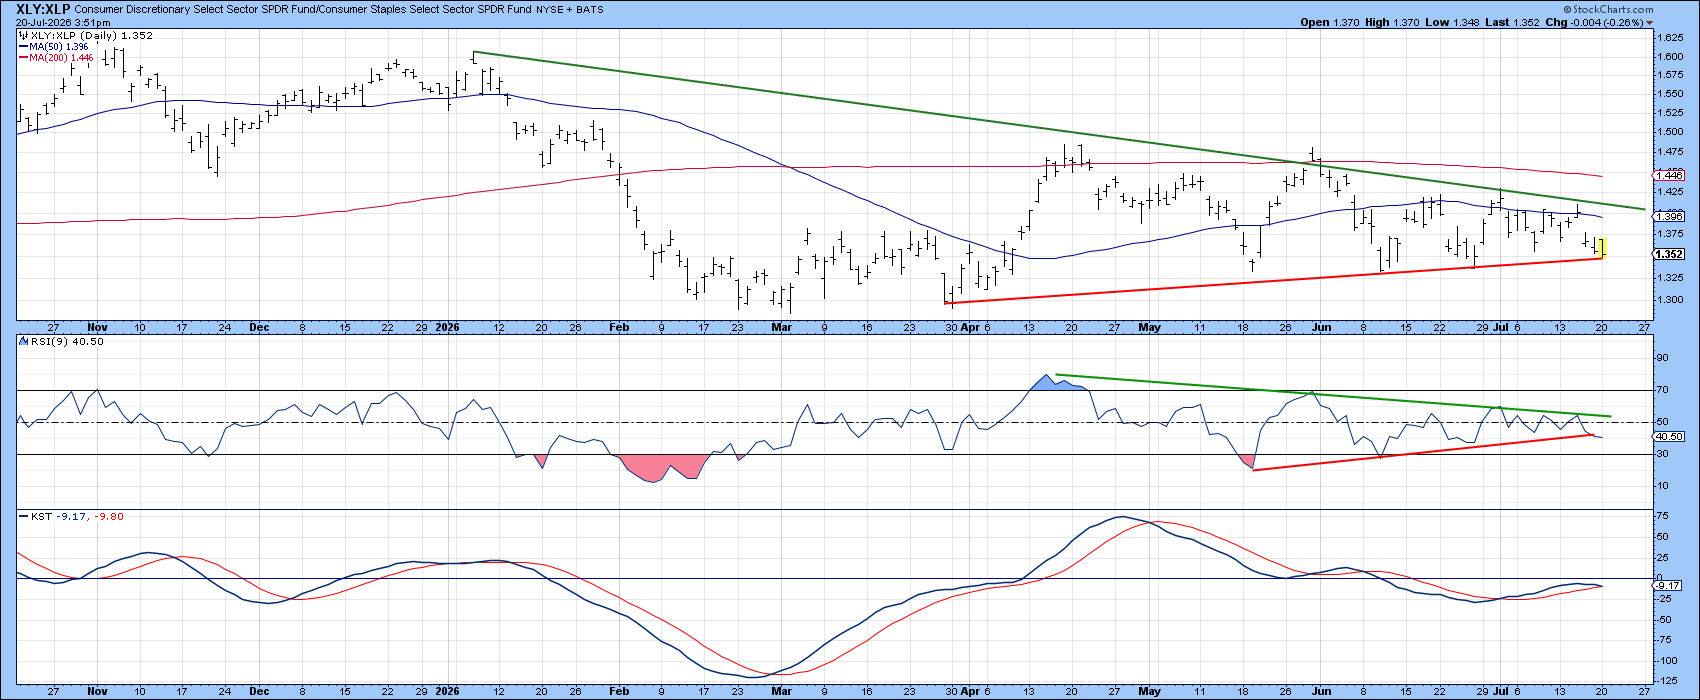
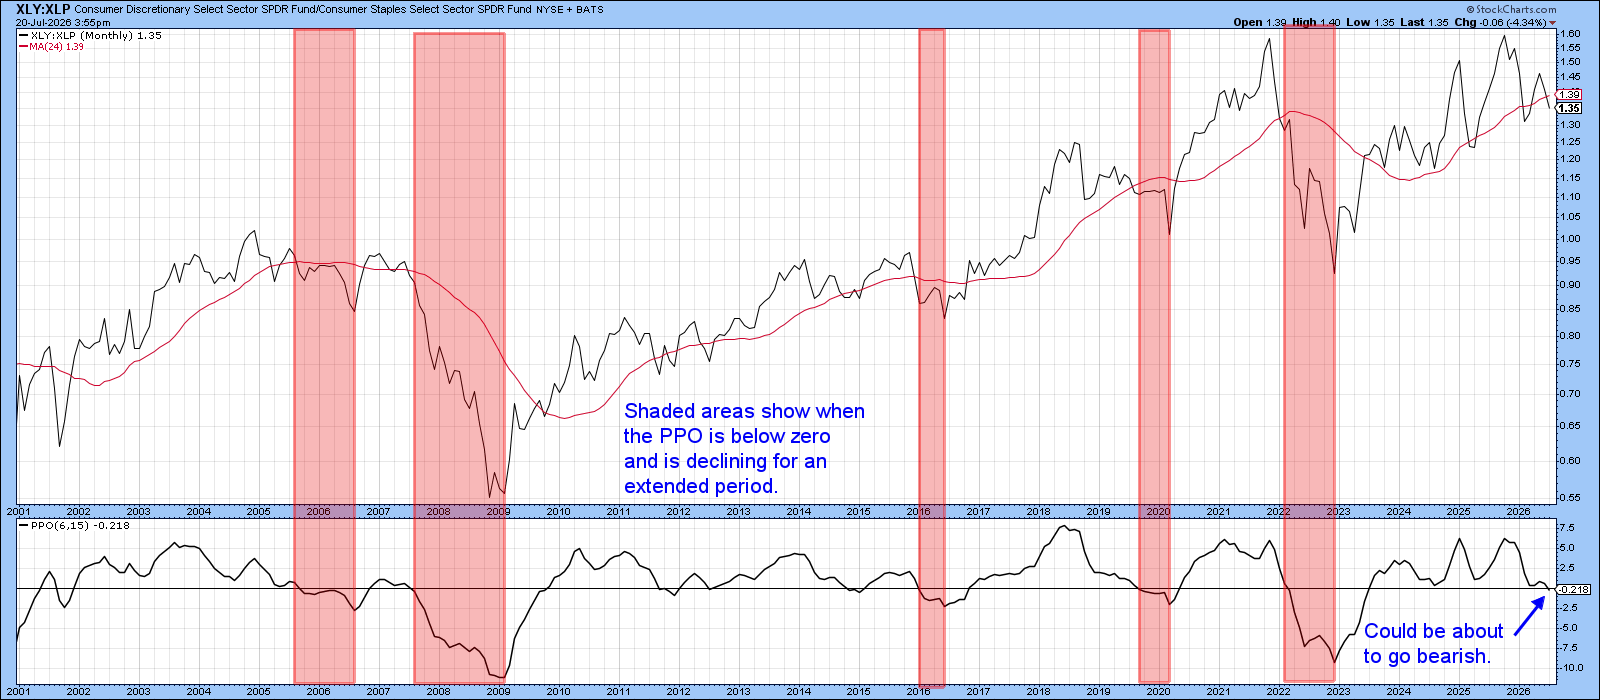
Chart 5 highlights the significance of the current long-term technical backdrop. It features a Percentage Price Oscillator (PPO) based on 6- and 15-month parameters. Historically, bear signals have been generated when the PPO drops below its equilibrium (zero) line and continues to decline. These periods are highlighted by the red-shaded areas. The PPO currently sits right at the zero line, meaning that any additional weakness would trigger a fresh long-term sell signal for the ratio. Such a development would suggest a further erosion of consumer confidence and carry bearish implications for the broader market.
The Technical Picture for XLY and XLP Individually
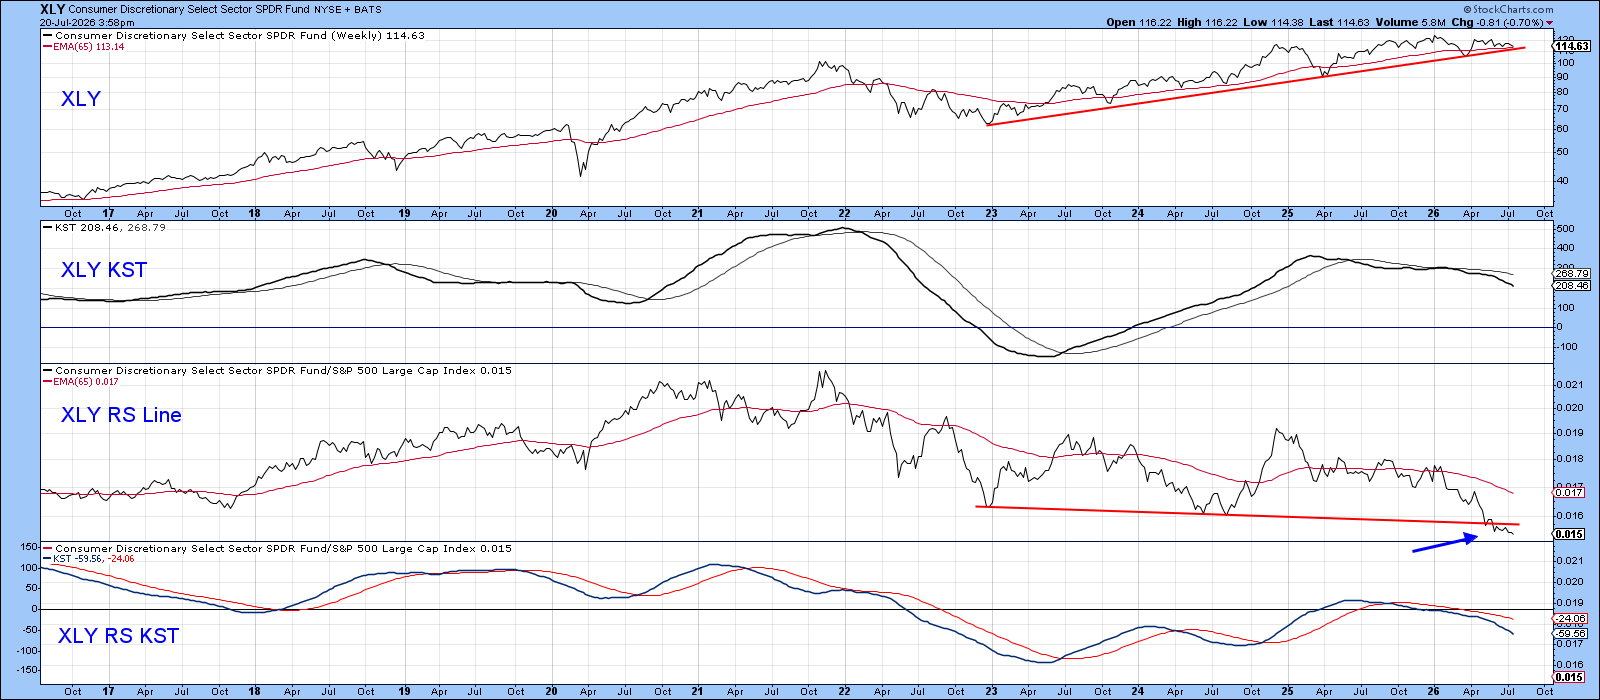
Charts 6 and 7 focus on the individual technical pictures for the XLY and XLP. The former is currently resting on a four-year support trendline as well as its 65-week exponential moving average. However, its long-term KST remains bearish, as does the KST for relative performance shown in the bottom window. In addition, the relative strength (RS) line has tentatively slipped below a key support trendline at a time when it’s already hovering near secular lows. This combination suggests that the discretionary sector would be vulnerable if support in the top window is violated.
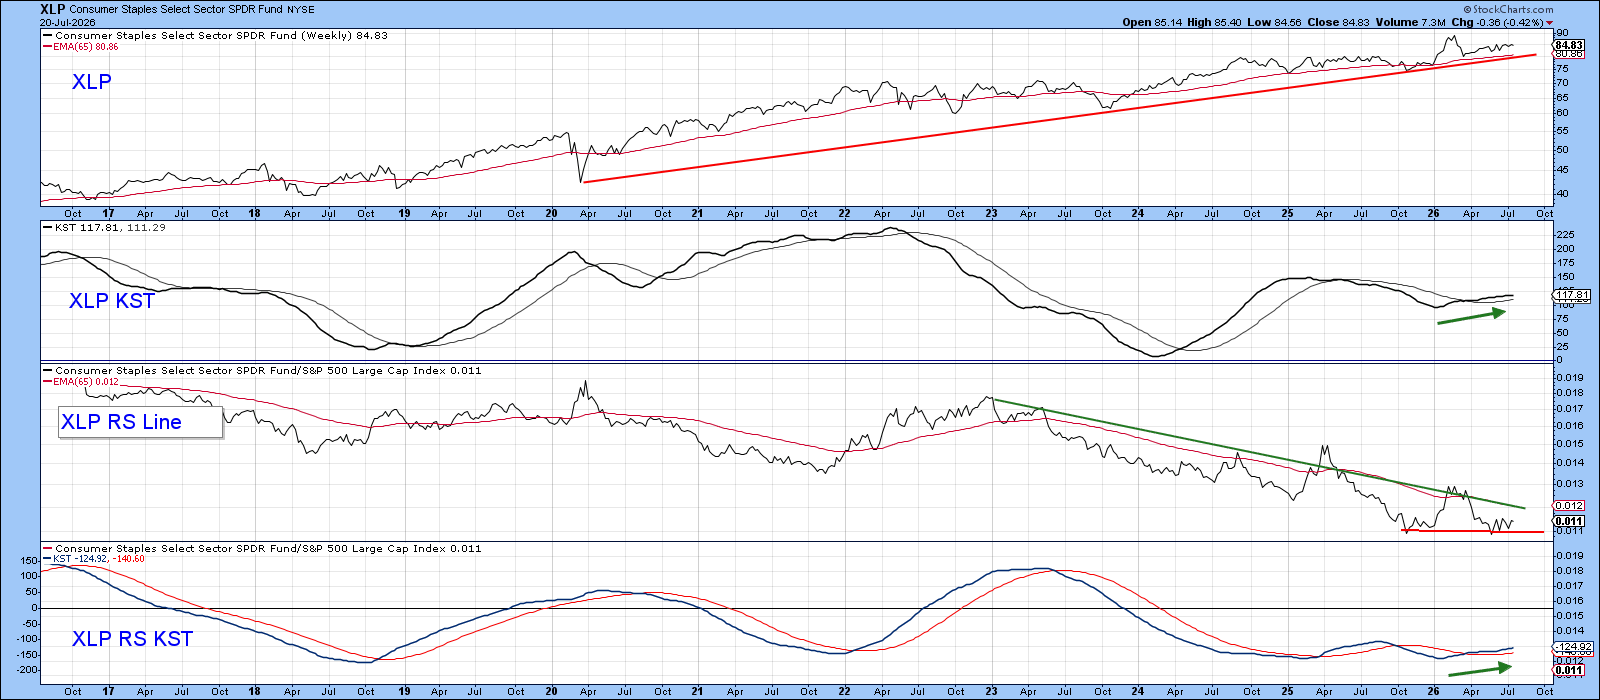
XLP, by contrast, is also trading above an important long-term support line, but displays both positive absolute and relative KST readings. Although its RS line remains below its declining 65-week EMA, it has essentially been moving sideways since mid-2025.
Bottom Line
The XLY/XLP ratio has reached a pivotal long-term support level, placing this important market relationship at a critical inflection point. As a widely-followed gauge of consumer confidence and investor risk appetite, any sustained breakdown could carry significant implications for the broader equity market. Conversely, if the ratio successfully holds support and discretionary stocks begin to outperform once again, it would suggest that consumer confidence remains sufficiently robust to underpin the ongoing bull market and support further market gains.
Good luck and good charting,
Martin J. Pring
The views expressed in this article are those of the author and do not necessarily reflect the position or opinion of Pring Turner Capital Group of Walnut Creek or its affiliates. The Six Stages of the Business Cycle are followed each month in Martin Pring’s Intermarket Review.