How to Find the Stock Market's Next Leaders

As the equity market rally broadens, semiconductor stocks have been relentlessly driving the major indices higher. When the S&P 500 posts a blistering 16% gain in just five weeks, the FOMO (Fear Of Missing Out) becomes almost impossible to ignore.
However, chasing extreme, parabolic moves is a guaranteed way to destroy your portfolio. A disciplined trader doesn't chase exhausted leaders; they scan for the early outperformers that are just starting to play catch-up.
Right now, Oracle (ORCL) is flashing exactly that kind of pristine, early-stage breakout signal.
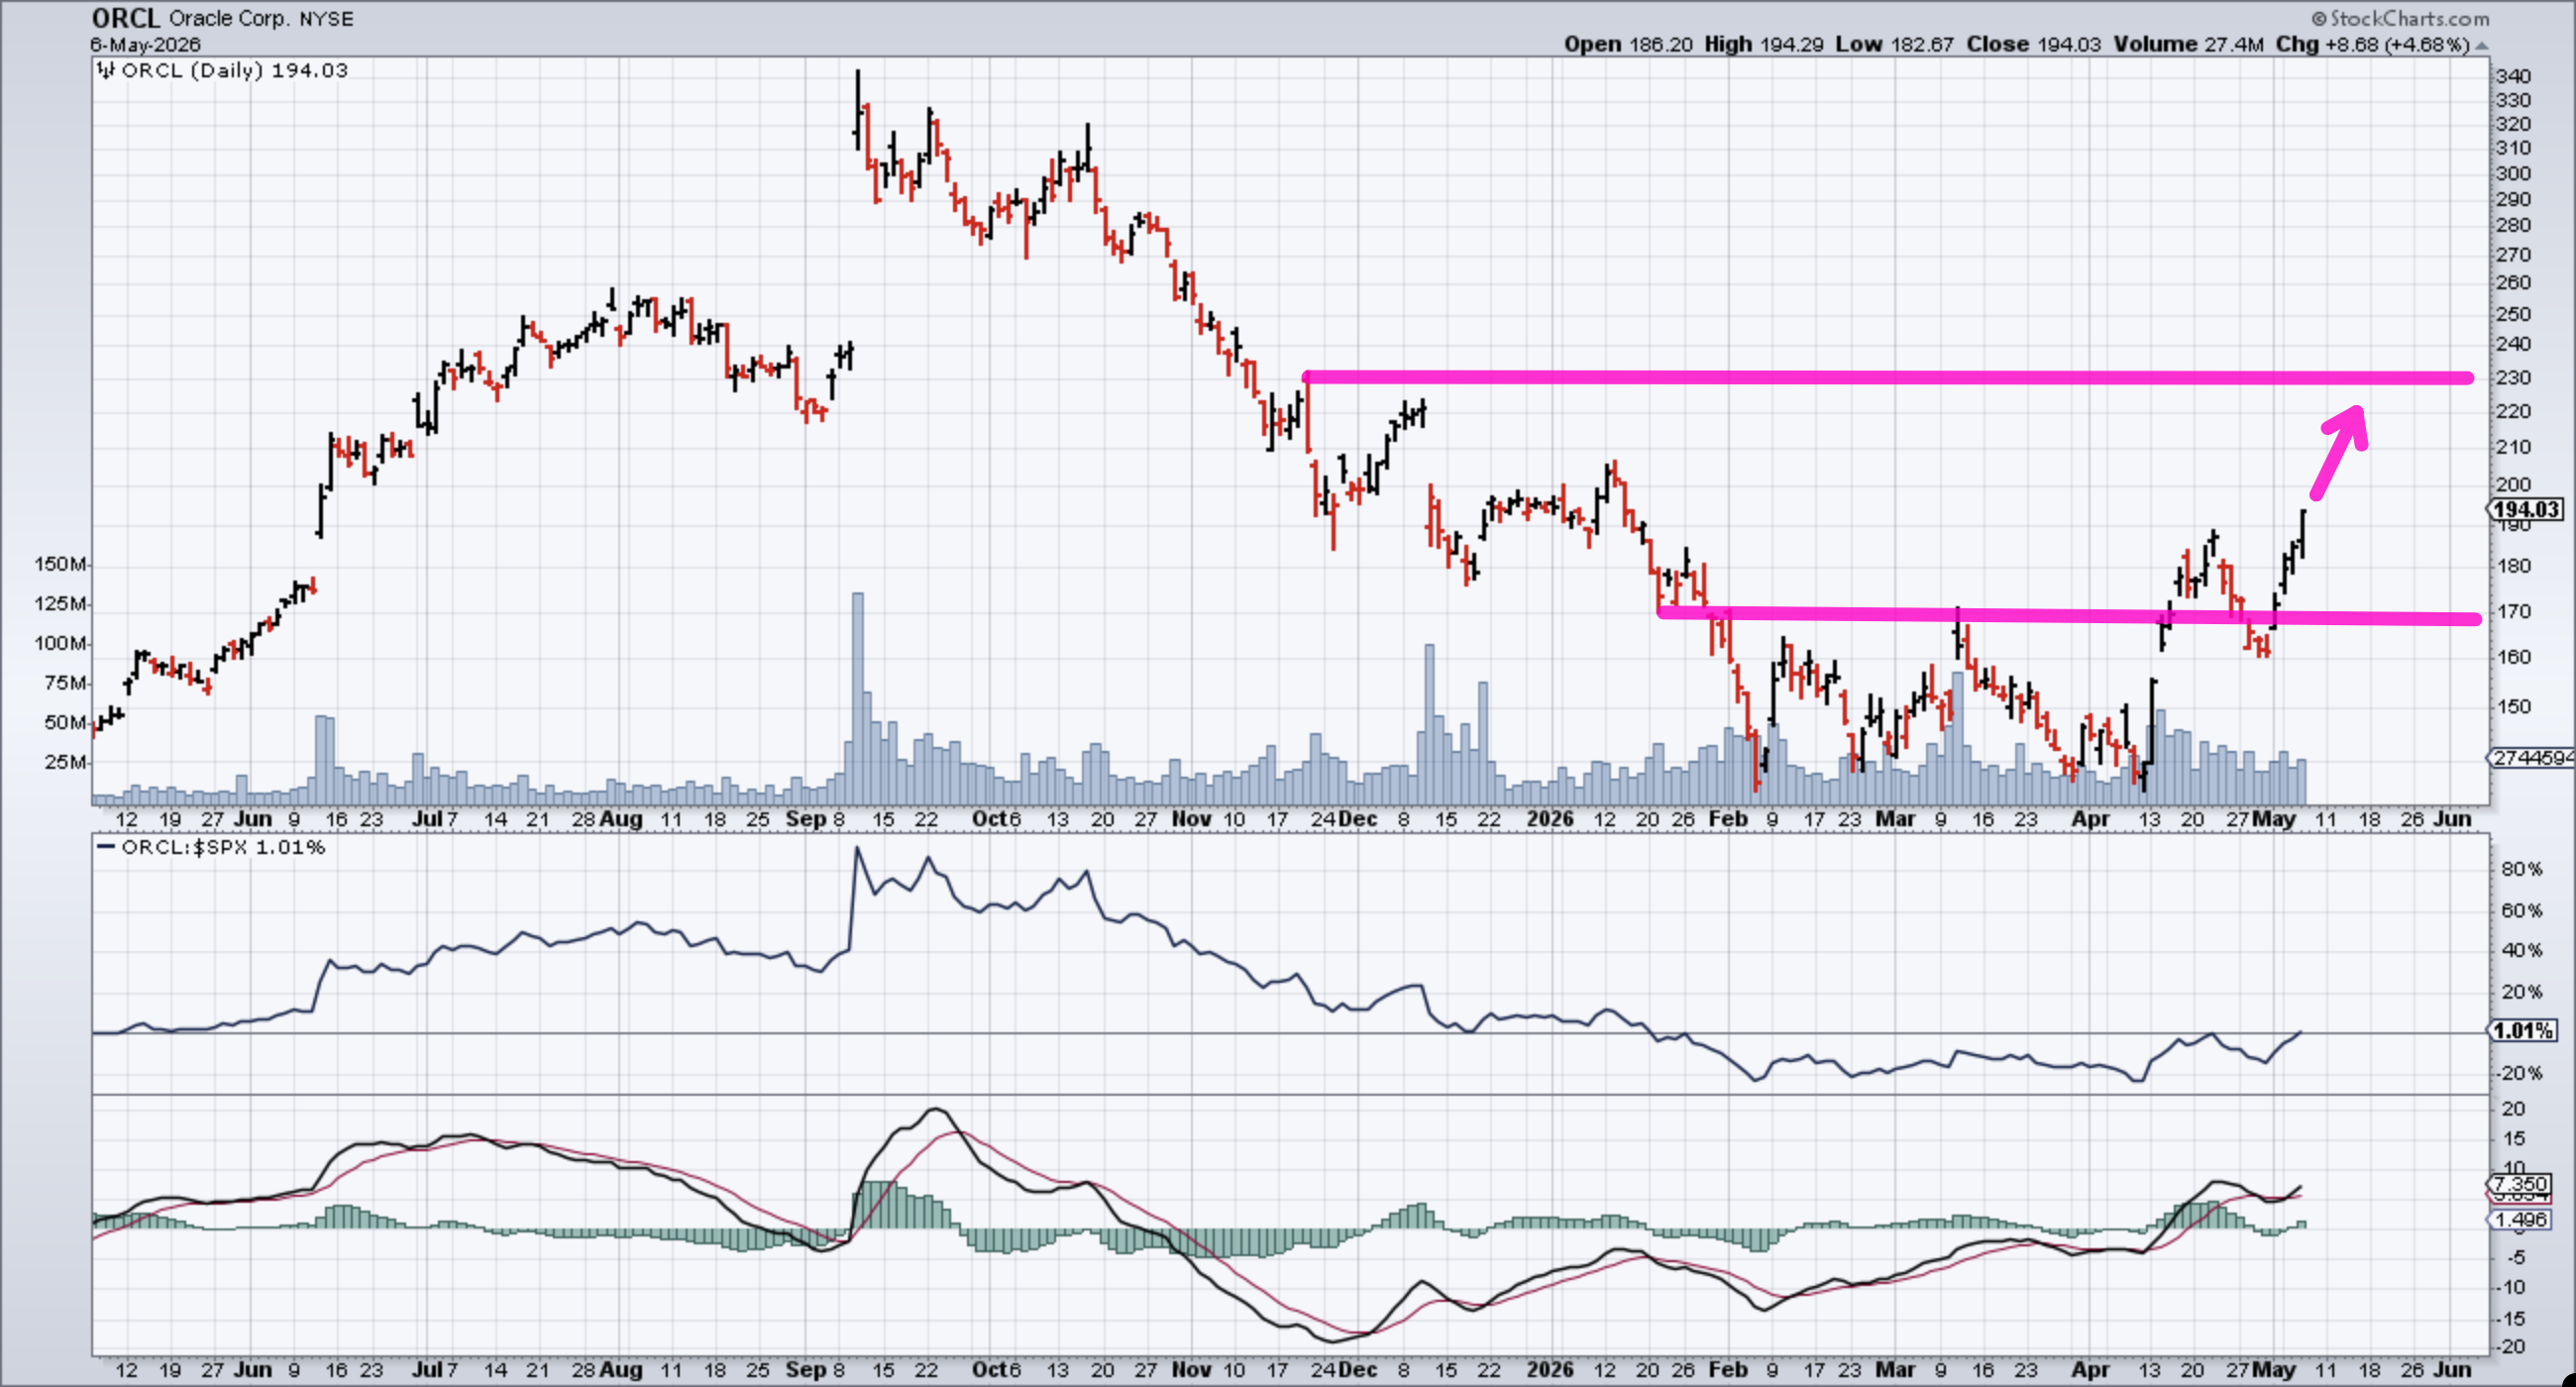
Looking at the chart, ORCL has been slowly and methodically building a base. It just broke out cleanly above the heavy $170 resistance level, retested it as new support, and is now targeting $230 to the upside.
Because the broader markets are so extended, we don't want to buy naked call options and take on massive premium risk. Instead, we engineered a highly capital-efficient Bull Call Spread to capture Oracle's upside while strictly capping our downside.
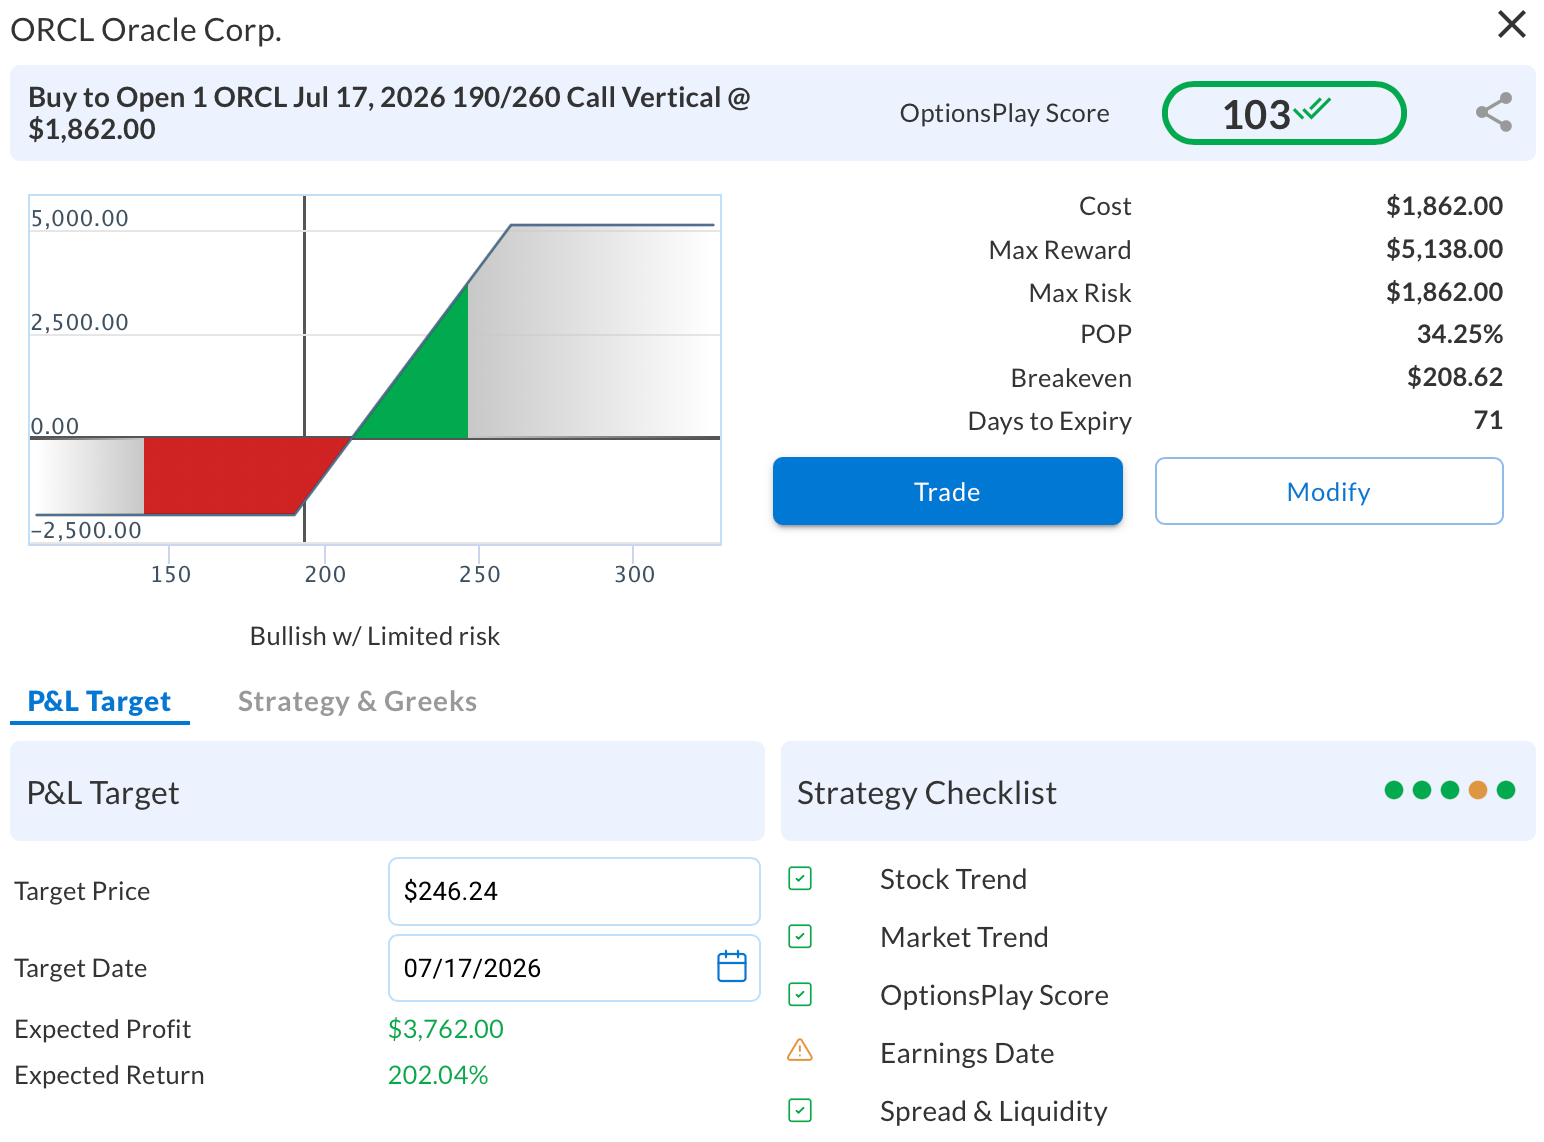
The ORCL Trade:
- Strategy: Bull Call Spread
- Expiry: July 17, 2026 (71 Days)
- Strikes: Buy $190 Call / Sell $260 Call
- Max Risk (Cost): $1,862 per contract
- Max Reward: $5,138 per contract
- OptionsPlay Score: 104
We are risking $1,862 to potentially make over $5,100, an incredible risk-to-reward ratio on a stock that is just beginning its breakout phase.
How Did We Find This? (The Danger of the "Frustration Mindset")
I just handed you a fully optimized, risk-defined trade to safely play the broadening stock market rally. But finding this setup manually is where most retail traders lose their edge.
When the market is ripping higher, the hardest part of trading isn't managing risk; it's filtering out the garbage without burning out. In a traditional workflow, you might scan for breakouts, pull up a dozen charts, and try to find a setup that hasn't already moved.
You might stumble across a stock like Baidu (BIDU), get incredibly excited about the chart, spend 15 minutes calculating option spreads, and then realize the stock just reported earnings and is already up 11% today. The move is entirely behind you. It is a dead end.
When it comes to trading, your mental capital is just as important as your financial capital. When you spend hours hitting these dead ends, you suffer from massive decision fatigue. You become impatient. Out of sheer exhaustion, you succumb to FOMO and force a terrible trade on an overextended semiconductor stock just so you don't feel left out. You end up trading from a place of frustration.
Here is the systematic workflow we used to eliminate that fatigue and force the math to surface the Oracle trade in under 60 seconds.
Step 1: Idea Generation (The Screener)
Instead of guessing which stocks were rotating higher, I opened the OptionsPlay Strategy Center and deployed the "Bullish Outperformance" scan. I wanted the math to instantly tell me which names were making new relative highs to the market.
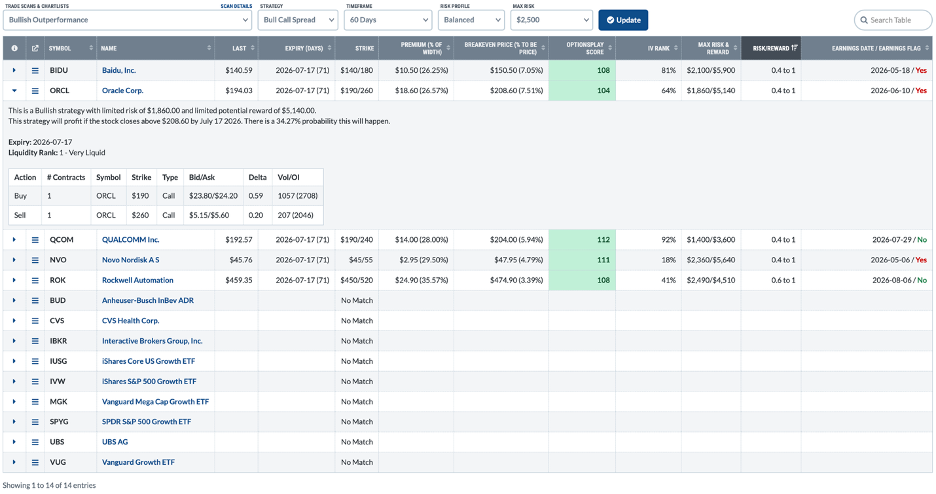
The tool instantly filtered thousands of stocks down to a highly curated list of just 14 names.
Step 2: Strategy Selection
Because the market is up 16% in five weeks, I know a pullback is a real threat. I want upside exposure, but I demand limited risk. I flipped the strategy filter to "Bull Call Spreads."
Step 3: Automated Execution
Instantly, the OptionsPlay Strategy Center analyzed all 14 stocks, calculated the Greeks, and ranked them from top to bottom based on the absolute best risk-to-reward ratios.
BIDU was at the top of the list, but a quick glance at the news showed the earnings move had already happened. I simply dropped to the very next trade on the list: Oracle. The tool had already calculated that the $190/$260 strike combination was the mathematically optimal way to play the $230 chart target.
Within 60 seconds, I bypassed the FOMO, avoided the earnings trap, and found a perfect catch-up trade. My mind was completely clear and focused on execution.
This is just one workflow. We find dozens every day.
What I just walked you through is incredibly powerful, but it is only a fraction of what this tool can do. We used one specific Bullish Outperformance Scan and one specific strategy, but the true power of the OptionsPlay Strategy Center is its ultimate versatility:
- Any Watchlist: You can run this same workflow on any ChartList you have built in StockCharts.
- 6 Pre-Defined Scans: Don't have a ChartList ready? You can instantly deploy one of our six pre-built technical buy-and-sell signal scans to find market-wide opportunities.
- 9 Options Strategies: Whether you are buying simple calls and puts or utilizing advanced income-generation strategies like Credit Spreads and Covered Calls, the tool supports nine strategies from beginner to advanced.
Finding trades like ORCL usually takes hours of manual charting, fundamental research, and complex options chain math. We condensed that entire workflow into less than a minute.
The tool doesn't just give you ideas; it automates the execution. It scans for the best technical setups, checks the liquidity, avoids earnings traps, and calculates the mathematically optimal strike prices and expirations for your specific risk tolerance.
We just gave you the result for the Broadening Equity Rally. But a new theme emerges in the market every single day.
Stop hunting for trades manually. Build a workflow that finds them for you.
The OptionsPlay Add-On for StockCharts is available for $40/month and includes the Strategy Center, OptionsPlay Explorer, and hundreds of daily curated trade ideas.