The Best Five Sectors This Week #63
Key Takeaways
- Technology (XLK) surged to second place, nearing the leading quadrant on the weekly RRG, driven by strong price and relative strength.
- Energy remains the top sector, showing signs of recovery with improving momentum on both weekly and daily RRG.
- Materials and Industrials are weakening, with declining relative strength and momentum, moving towards lagging quadrants.
- Real Estate remains stable, holding above support, but lacks significant follow-through in price and relative strength.
Technology Surges, Energy Holds the Lead
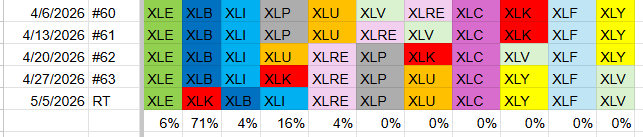
After a week of modest gains for the S&P 500, the sector rankings saw subtle shifts, though the top five sectors remained unchanged in composition. Energy continues to dominate at the number one spot, but technology has made a notable leap, moving from fourth to second place.
This shift pushed Materials and Industrials down to third and fourth positions, respectively, while Real Estate held steady at fifth. The rest of the sectors followed in order: Consumer Staples at six, then Utilities, Communication Services, Consumer Discretionary, Financials, and Health Care, rounding out the list at eleven.
- (1) Energy - XLE [6%]
- (4) Technology - XLK [71%]*
- (2) Materials - XLB [4%]*
- (3) Industrials - XLI [16%]*
- (5) Real Estate - XLRE [4%]
- (6) Consumer Staples - XLP
- (7) Utilities - XLU
- (8) Communication Services - XLC
- (9) Consumer Discretionary - XLY
- (10) Financials - XLF
- (11) Health Care - XLV
Weekly RRG
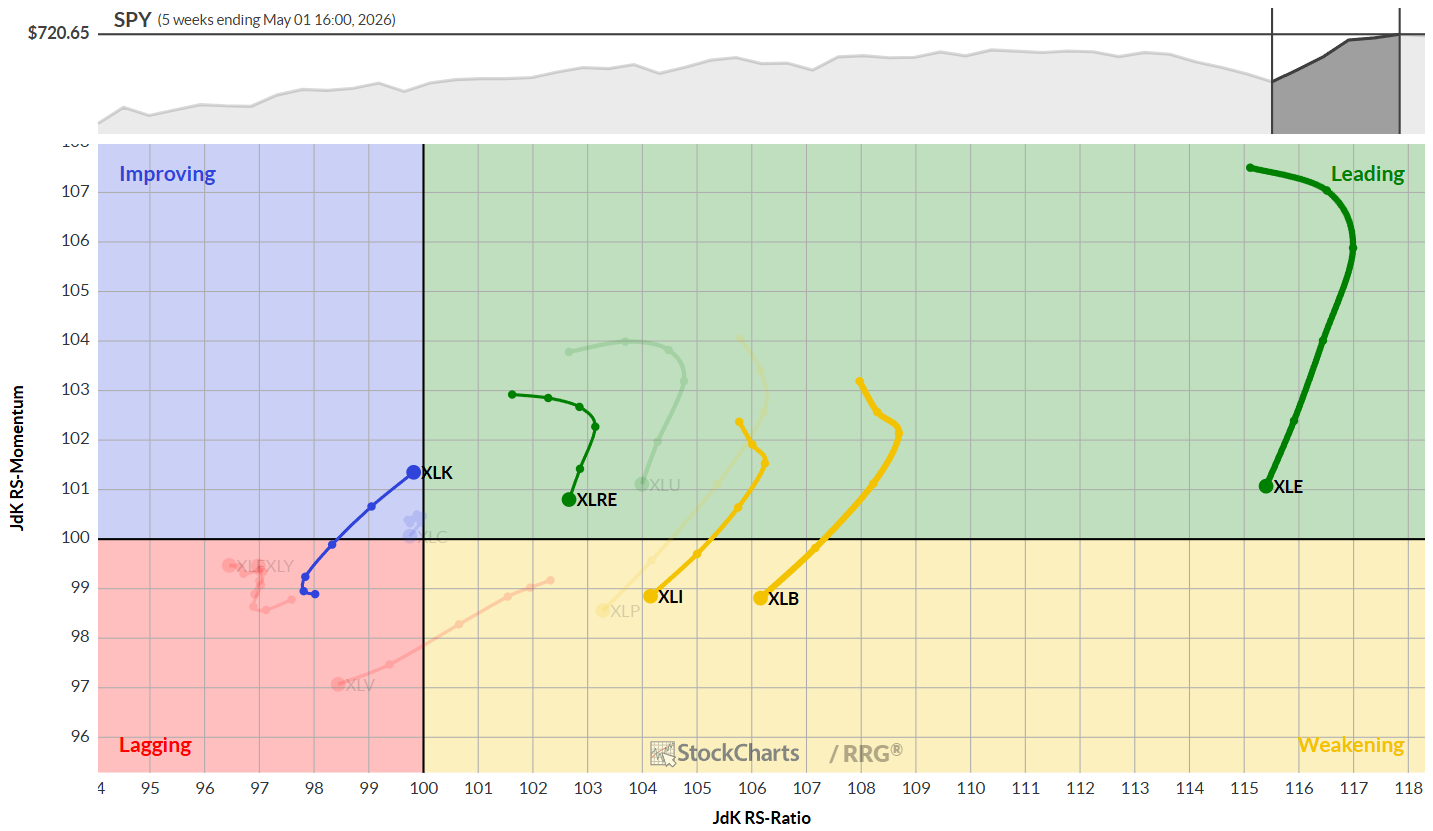
On the weekly Relative Rotation Graph (RRG), the pattern remains consistent. Energy, Materials, Industrials, and Real Estate are losing relative momentum but still occupy the right-hand side of the RRG, indicating ongoing strength.
The standout development is Technology (XLK), which is now on the verge of crossing into the leading quadrant. And it actually did cross into the leading quadrant on Monday, May 4. Its rapid ascent through the sector rankings is evident, with the weekly tail nearly entering the leading quadrant.
Daily RRG
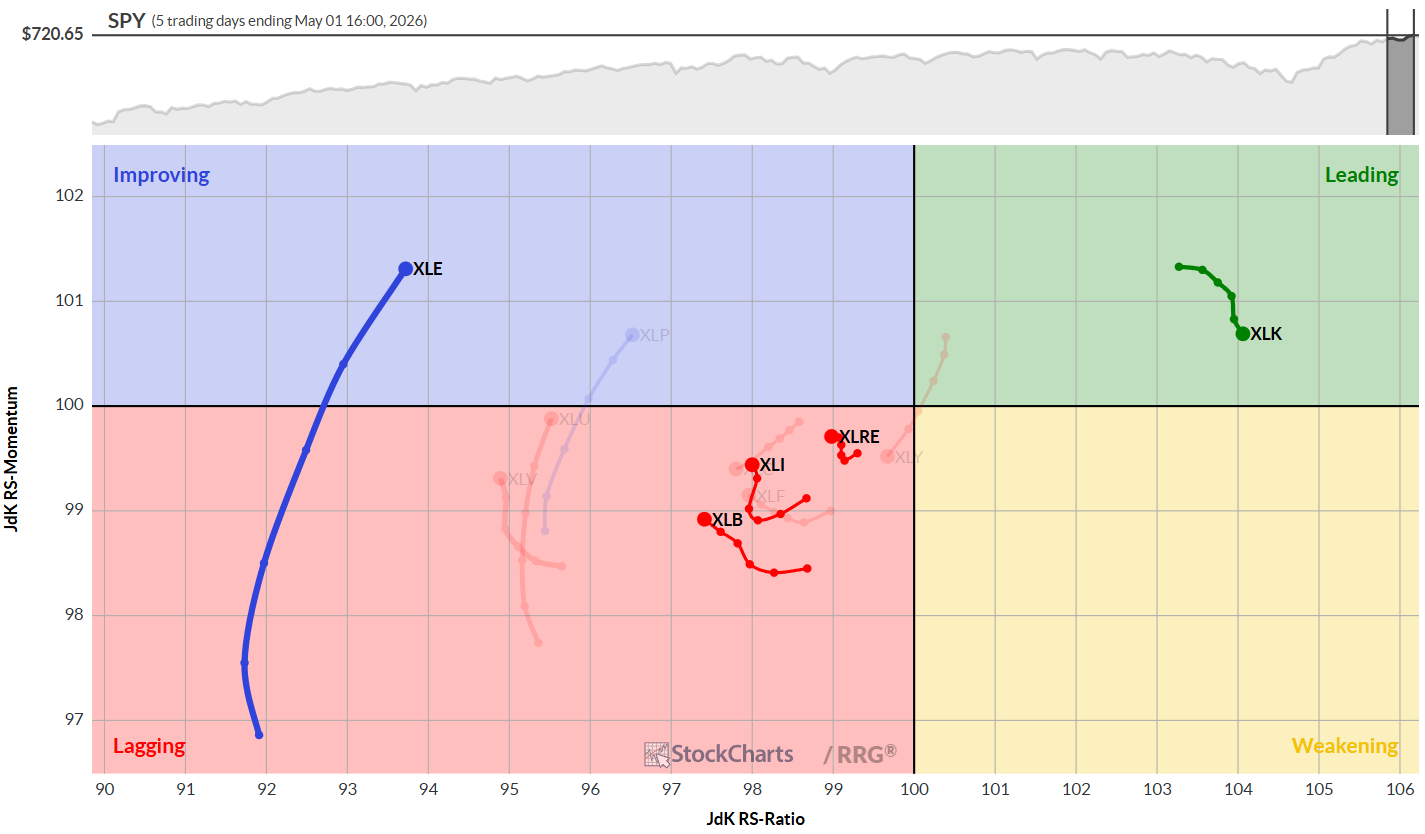
On the daily RRG, momentum is shifting back in favor of sectors that are rolling over on the weekly chart. Energy, Materials, Industrials, and Real Estate are positioned on the left-hand side but are gaining relative momentum. They are all either already inside the improving quadrant (XLE) or moving toward it.
Technology (XLK) is rolling over within the leading quadrant after a swift move, but its improvement on the weekly RRG highlights the sector’s current strength and rapid progress.
Sector Highlights
Energy
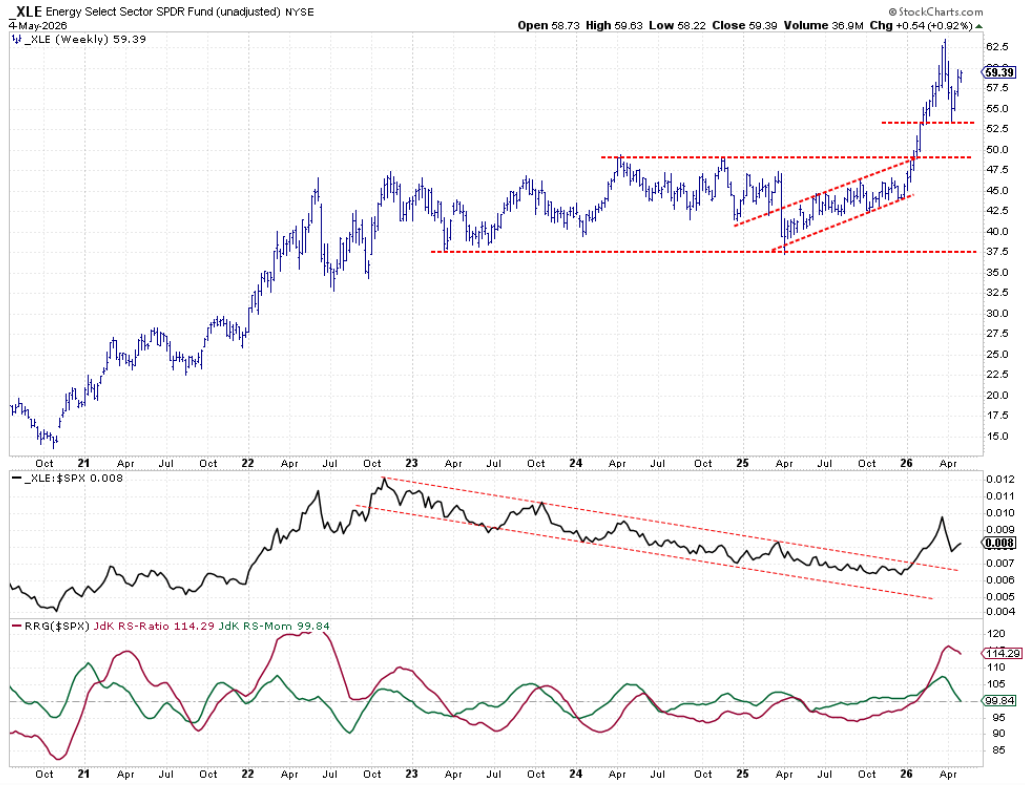
The Energy sector rebounded from a support test around 53, setting a new higher low in both the price chart and the relative strength line. Although the RRG lines are still lagging and moving lower, the sector’s recent improvement should soon flatten and lift the weekly RRG lines.
Materials
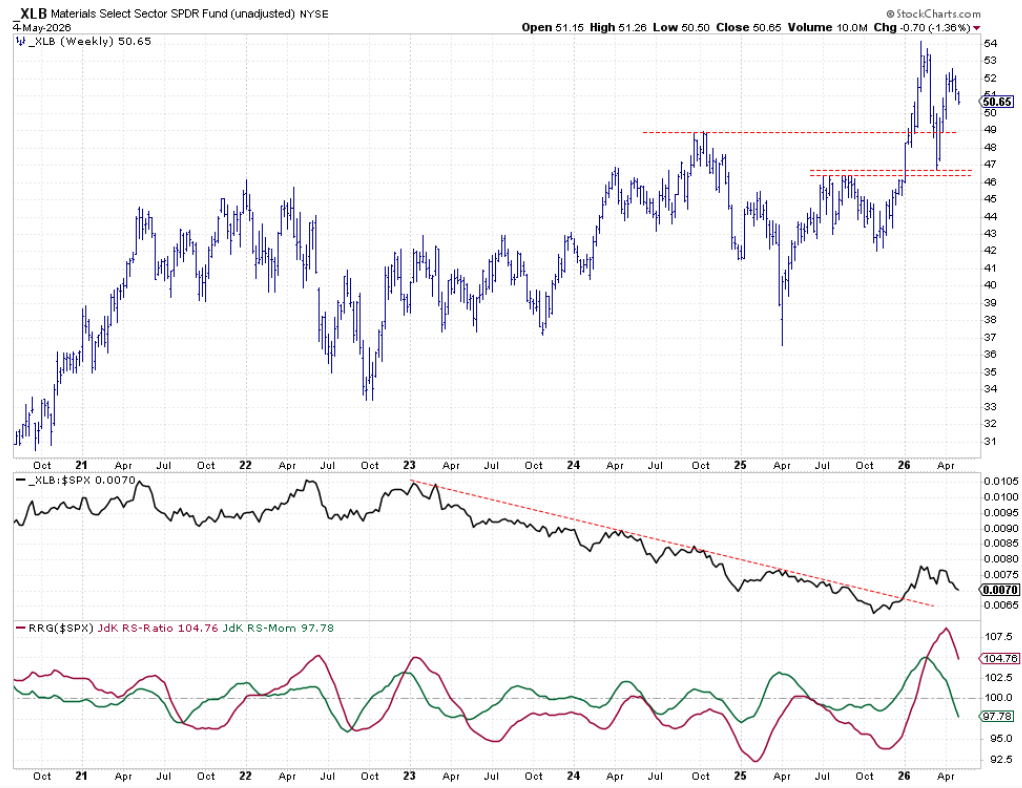
Materials rallied from their recent low near 46.5 but set a lower high two weeks ago. This has impacted the raw RS line, which formed a small double top, causing the RRG lines to roll over and move lower. The RS-momentum line is below 100, dragging the RS-ratio line down. While still in the weakening quadrant, this could signal further weakening ahead.
Technology
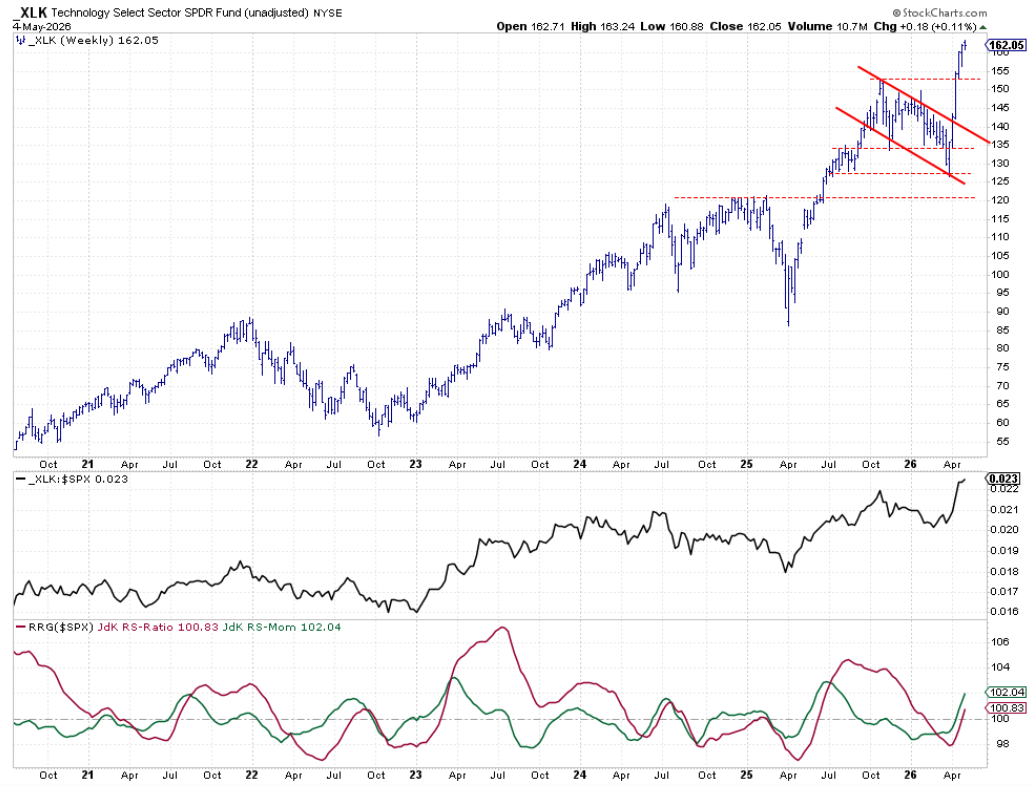
Technology’s rapid rise continues, with XLK breaking to new all-time highs and pushing the raw RS line above its previous peak. Both RRG lines have moved above 100, propelling XLK into the leading quadrant. The weekly RRG tail had not yet entered the leading quadrant as of last Friday’s close, but Monday’s price action has now pushed it firmly into that territory.
Industrials
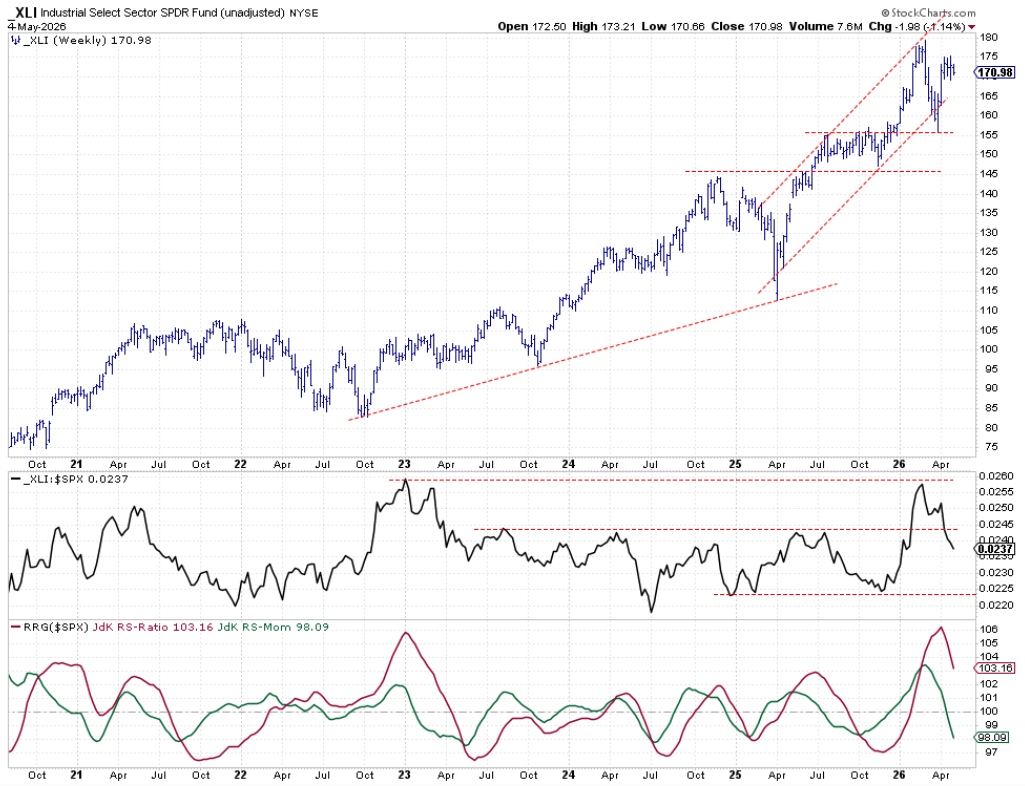
Industrials have moved sideways over the past four to five weeks, causing the raw RS line to trend lower. A pattern of lower highs and lower lows in the relative strength line, along with a drop below previous resistance, signals weakness. The RRG lines are moving lower, with the RS momentum line below 100, positioning XLI in the weakening quadrant and heading toward lagging.
Real Estate
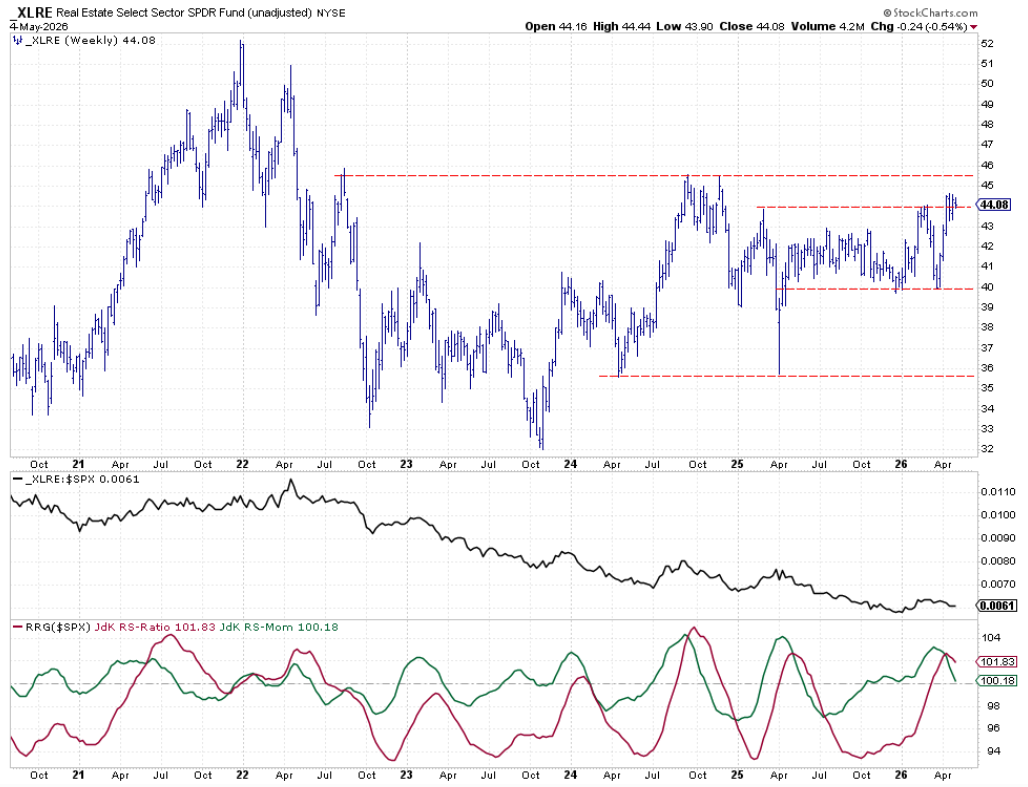
Real Estate remains stable, with its price breakout holding above resistance, now acting as support. However, there’s no significant follow-through, and the relative strength line is moving sideways. This is dragging the RRG lines slightly lower, but any price improvement could quickly boost its relative strength and keep the sector afloat.
Portfolio Composition and Performance
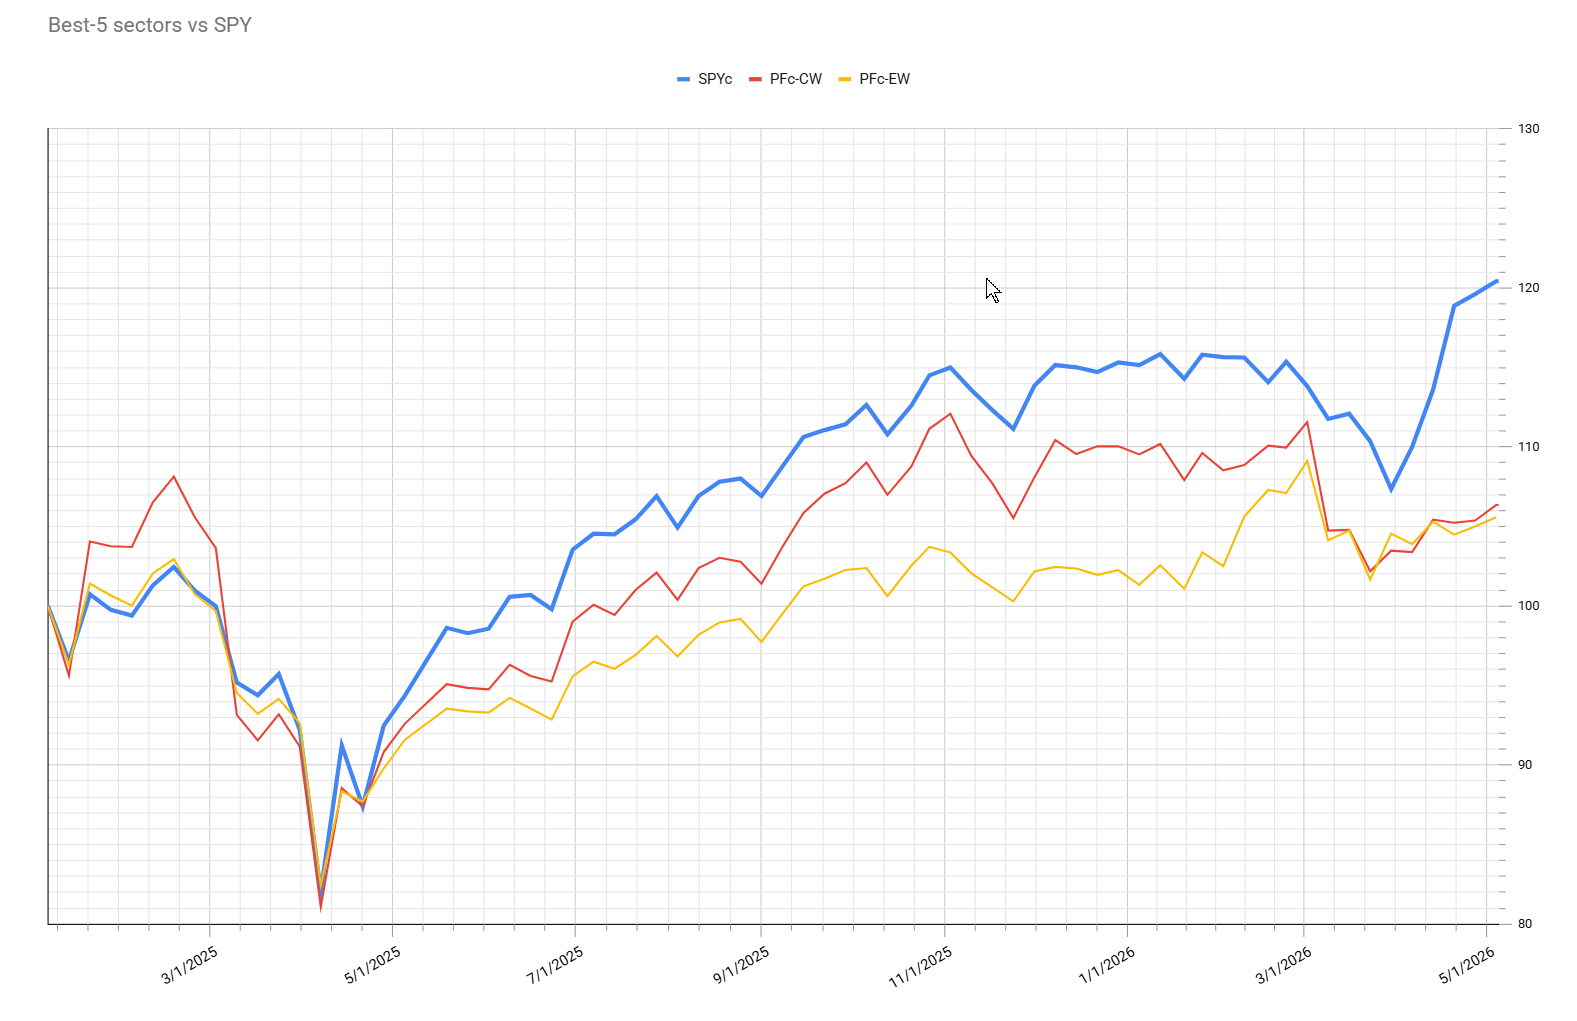
The portfolio composition is unchanged from last week, with Technology commanding a massive 70% weighting. This is due to the relatively low market capitalization of the other top five sectors, leaving Technology to absorb the excess weight.
Portfolio performance remains underwater at around -14%. Strategies like this require sustained trends to outperform, and the lack of a reliable, low-volatility trend has been a challenge since the start of the year.
#StayAlert, -Julius