The Next Leg Higher May Not Be in the U.S. Here’s Where to Look

Key Takeaways
- European equities show improving technicals as energy prices ease and sentiment shifts.
- VGK forms a potential bull flag, suggesting upside if price penetrates key resistance.
- Currency messiness in EURUSD complicates the outlook, favoring selective or hedged exposure.
Advanced Micro Devices (AMD) smashed earnings estimates, layering on more icing to what has been a decorated Q1 earnings season in the U.S. The S&P 500 naturally lifted to a fresh record midweek ahead of April jobs data. Samsung entered the trillion-dollar market-cap club in emerging Asia, helping send the iShares MSCI Emerging Markets ETF (EEM) to a new all-time high.
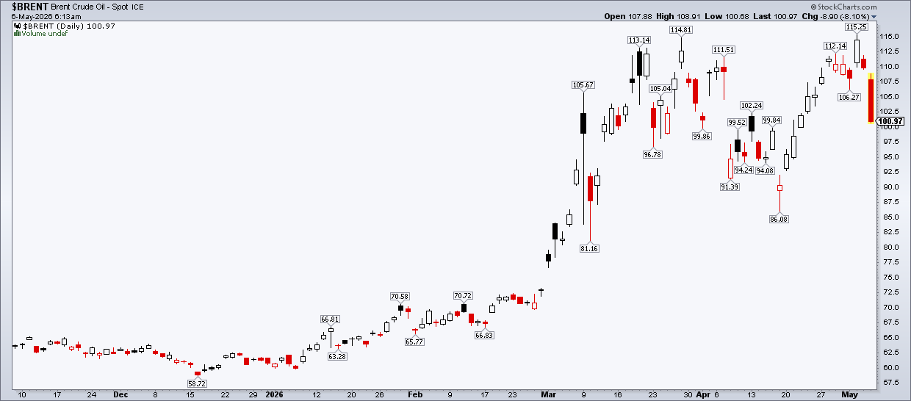
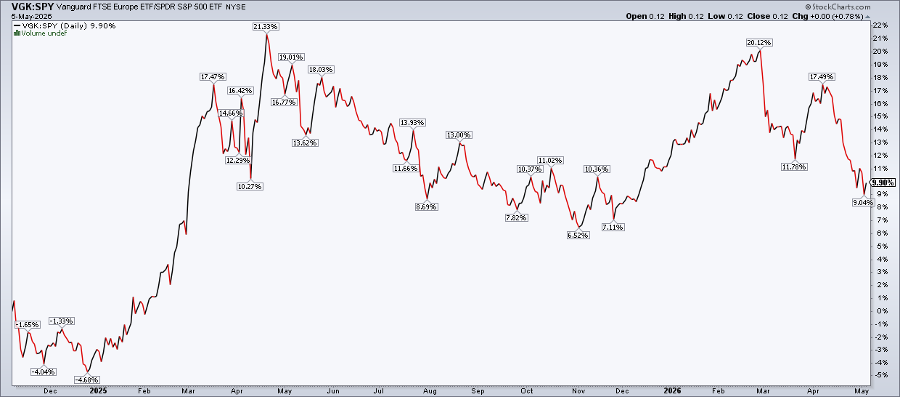
What about the rest of the globe? The AI revolution’s reach continues to expand, but it has not quite wrapped its arms around the developed world. Europe and Asia began lagging the global stock market in February, shortly before the onset of the conflict in Iran. Brent crude oil’s thrust from $70 to near $120 at times took its toll on nations dependent on Middle East energy supplies.
A Fresh Dose of Geopolitical Optimism
But is the macro story changing? There are inklings of that once again. Just like the risk-on environment that ignited five weeks ago following de-escalation efforts by President Trump and the Iranian regime, another dose of geopolitical optimism wafted across trading floors around the room on the evening of Cinco de Mayo.
The United States Oil Fund (USO) tanked 7%, with WTI drifting down to $95 and Brent backing off to $103 on Wednesday morning. Gasoline futures, by the way, shed 16 cents, still implying $4.40 at the pump leading into Memorial Day weekend.
Any efforts to end the dual blockades of the Strait of Hormuz could trigger a more sustained bullish response from European stocks. So, after a three-month alpha pause, is it time to go overweight VGK? Let's toss aside the narratives and study the charts.
VGK: A Laggard, But with Bullish Chart Vibes
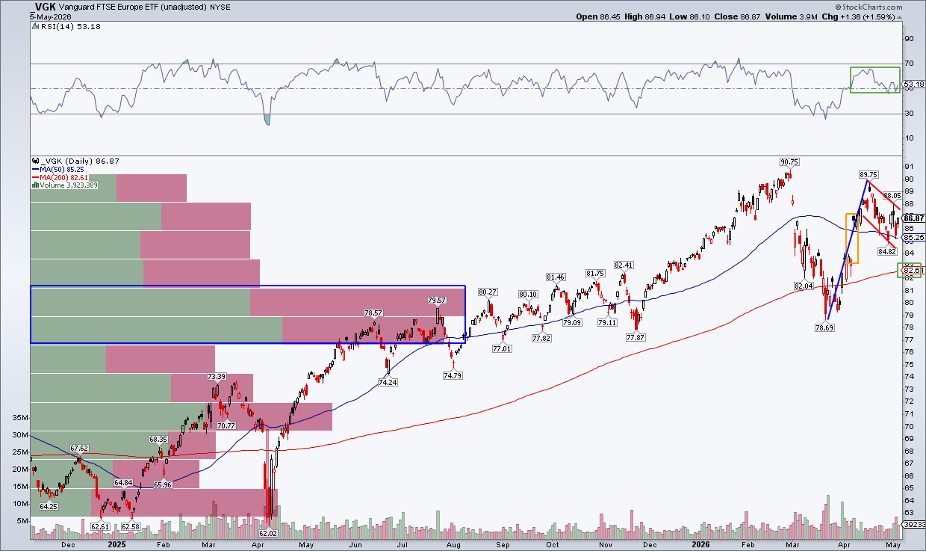
Notice in the chart below that the European equity ETF remains below its early-year peak. There are encouraging indicators, though. What jumps out to me is the April 8 gap from $83.53 to $87.03 (gaps are always taken from a period’s closing price to the following period’s opening price). How a security trades upon testing the gap is a big tell.
In VGK’s case, price entered the gap but didn’t completely fill it. The window was not shut all the way, as the Japanese candlestick experts might say. Chalk that up to the bulls.
Also, take a look at the short-term 50-day moving average. Yes, it is on the decline (score one for the bears), but price has held that trend-indicator line on a few occasions this quarter. The long-term 200-day moving average, meanwhile, remains positively sloped, confirming that the bulls control the primary trend.
Momentum Reset After a Healthy Correction
The RSI momentum oscillator at the top of the chart tagged technical oversold conditions at the March price low and has since climbed back to a more neutral reading near 50. The late-Q1 nadir was also key in that a high amount of volume by price entered the scene in the high $70s.
Ultimately, the 13% retreat appears to have been a garden-variety correction.
Bull Flag or False Hope?
Stepping back, despite significant underperformance relative to the S&P 500 since February 27 (and again since April 8), VGK’s recent dip looks like a bull flag. Gaming that out, we can calculate a measured move price target to near $100 based on the $11 flagpole height ($79 to $90), added on top of the presumed breakout point close to $89.
First, I would like to see the April peak of $89.75 hurdled, followed by a definitive advance to a new all-time high. Should that transpire, it would augur for another leg higher in the global bull market.
Remember that breadth is not just a siloed study of U.S. stocks. Rather, analyzing the expanse of global equities rising or declining is crucial.
EURUSD: A Technical Mess with Macro Implications
We cannot assess overseas markets without a currency look. The euro rose 70 price interest points (pips) after the president said the U.S. would pause “Project Freedom” in the Strait of Hormuz. Who knows what actually plays out on the global stage, but EURUSD does not point to a major peace dividend anytime soon.
The currency pair quietly endured a bearish death cross, in which the 50-day moving average moves below the 200-day moving average. Three consecutive semi-failed breakouts occurred in the past year ($1.183, $1.1919, and $1.2083), as support established near the $1.14 figure. In short, this chart is a hot mess.
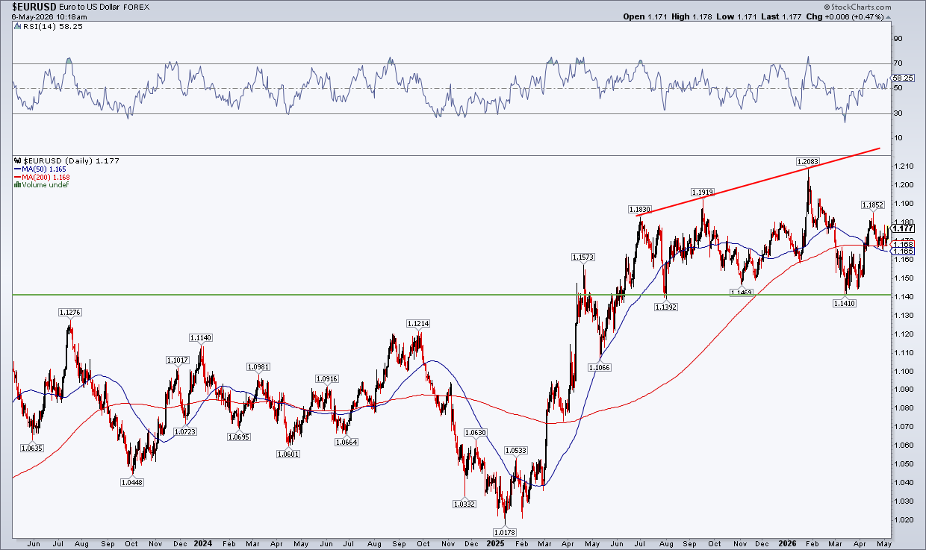
For traders, if we had a sharply rising euro, playing it through something like VGK could turbocharge alpha. When EURUSD depreciates, a currency-hedged ETF such as the WisdomTree Europe Hedged Equity Fund (HEDJ) might make more sense.
The Bottom Line
Investors spreading their bets across countries scored big gains in 2025. This year has been less steady when scanning global returns. As geopolitical experts strategize the next move out of the U.S. and Iran, technical traders can simply look at the charts. Bullish action may be brewing in Europe after a few months of negative alpha. I am watching VGK; should it lift to new highs, the global market would only further strengthen.
Disclaimer: This blog is for educational purposes only and should not be construed as financial advice. The ideas and strategies should never be used without first assessing your own personal and financial situation, or without consulting a financial professional.