What the Nirvana Template Reveals About the Gulf ETFs
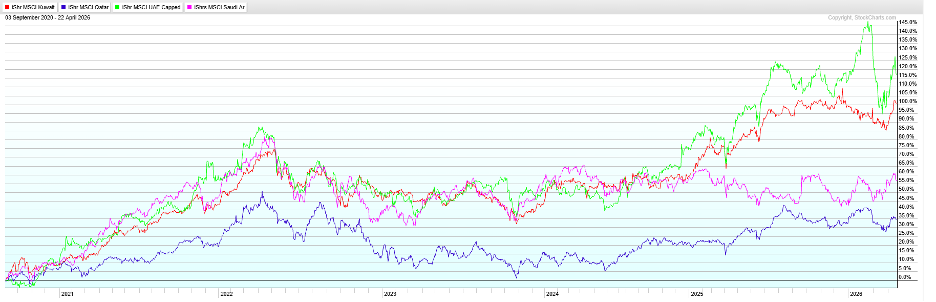
After nearly two months of war, it's an appropriate moment to review the U.S.-traded Gulf ETFs to determine whether any are positioned to benefit from a potential reduction in hostilities. There are four such ETFs: iShares MSCI Saudi Arabia (KSA), iShares MSCI Kuwait (KWT), iShares MSCI Qatar Capped (QAT), and the iShares MSCI UAE Capped (UAE).
Chart 1 plots the performance of these ETFs over roughly the last 1,300 days. The standout performer has been UAE (green), with KWT (red) in second place. While this offers useful historical perspective, our primary interest in past performance is the insight it provides into future potential. With that in mind, we now turn to each ETF individually.
The Nirvana Template
To do this, I use one of my chart styles, called the Nirvana Template. It evaluates the long‑term technical condition of a market by aligning four components, those being the absolute and relative trend together with their respective long-term KSTs. Ideally, you want to see the two momentum series turn up from a sub-zero position and for the price and RS lines to be trading north of their 65-week EMAs. So much the better if a trendline violation can accompany any EMA crossover.
When all four are positive and not overextended, the asset enters a rare “Nirvana condition,” signaling a high‑probability of a long-term buying opportunity.
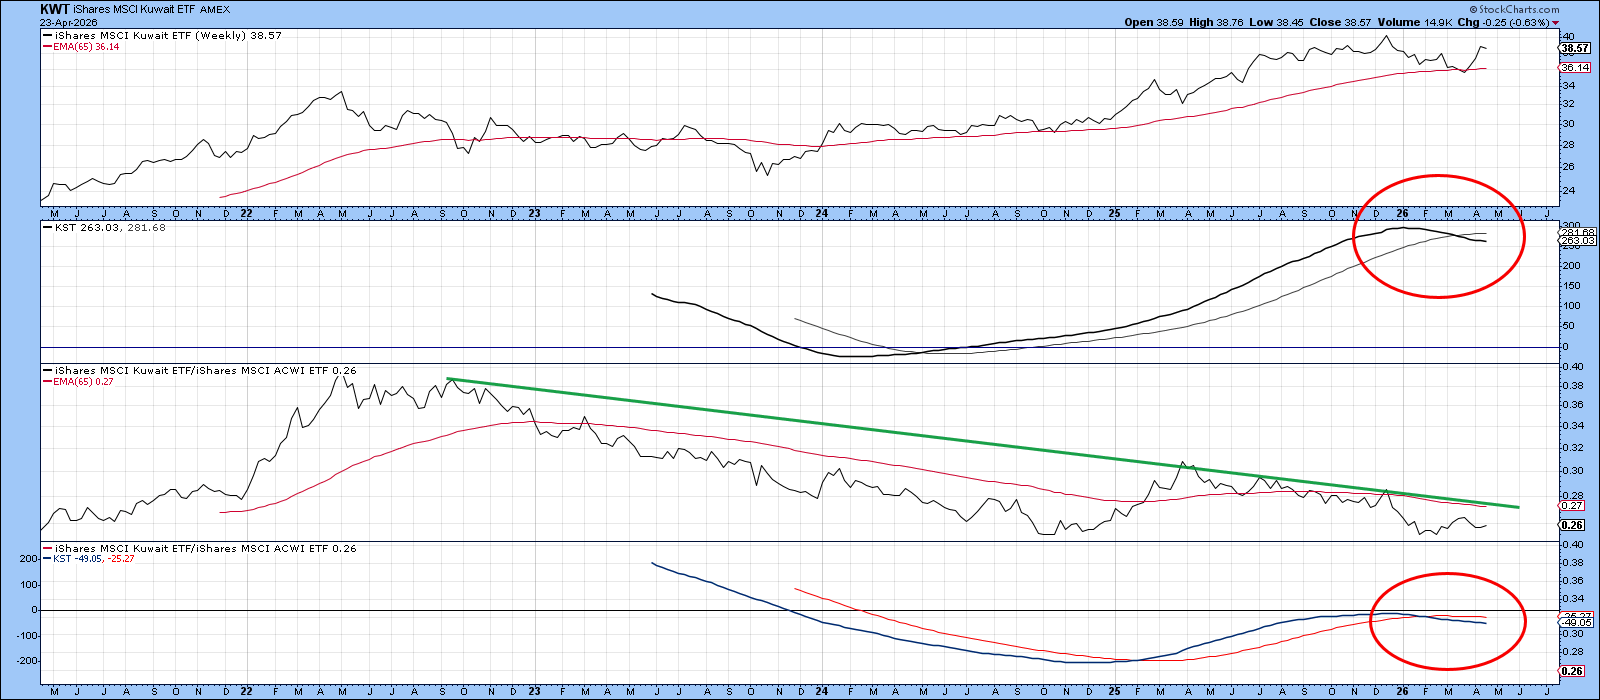
Kuwait
KWT has been rangebound for a couple of years. The RS line, however, has been declining since 2022 and is well below its 65-week EMA and down trendline. Two decisive KST sell signals for the price, and the RS adds to the "weakish" technical position.
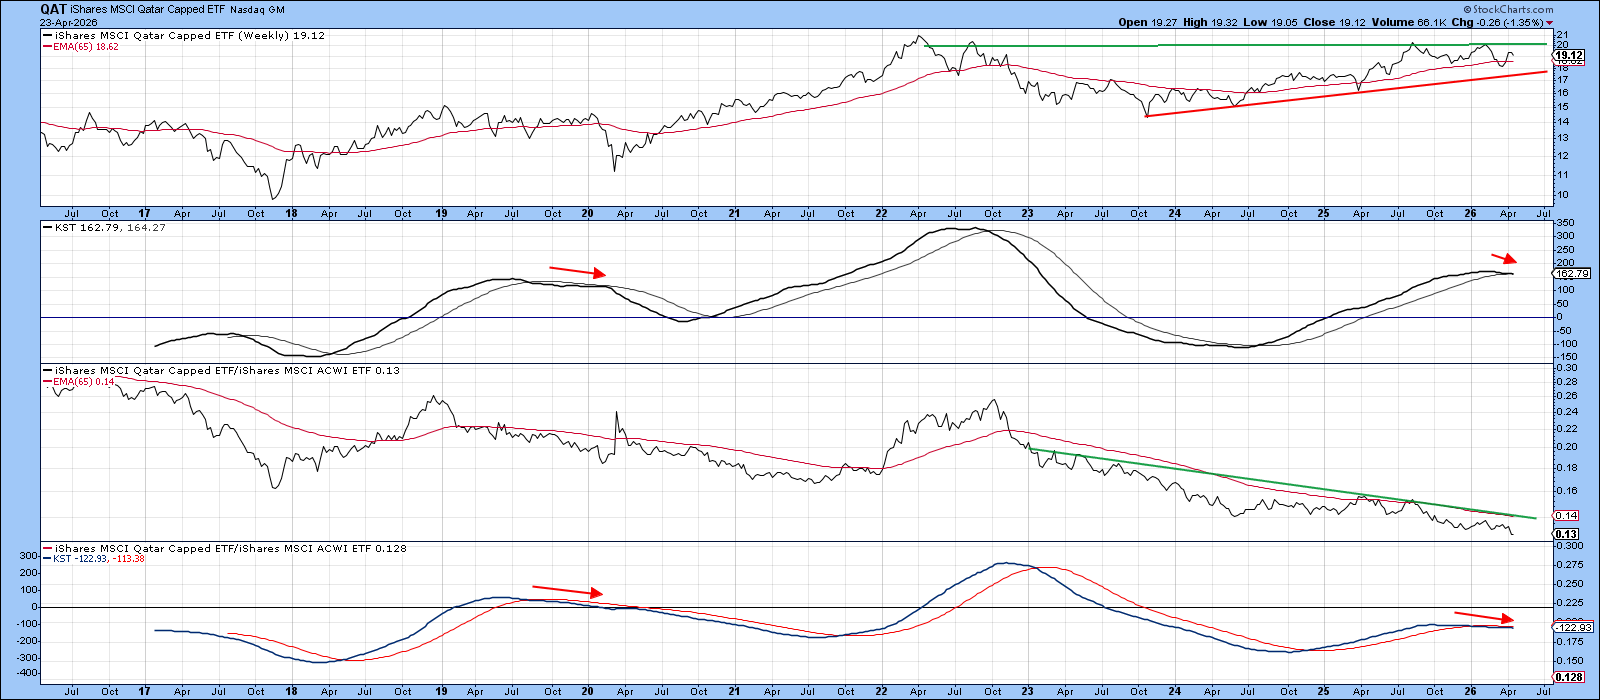
Qatar
QAT has been confined to a much broader and more prolonged trading range than KWT. During this sideways phase, its relative‑strength line has also been deteriorating. A more constructive tone would emerge once price can push decisively above both its 65‑week EMA and the green down‑trendline.
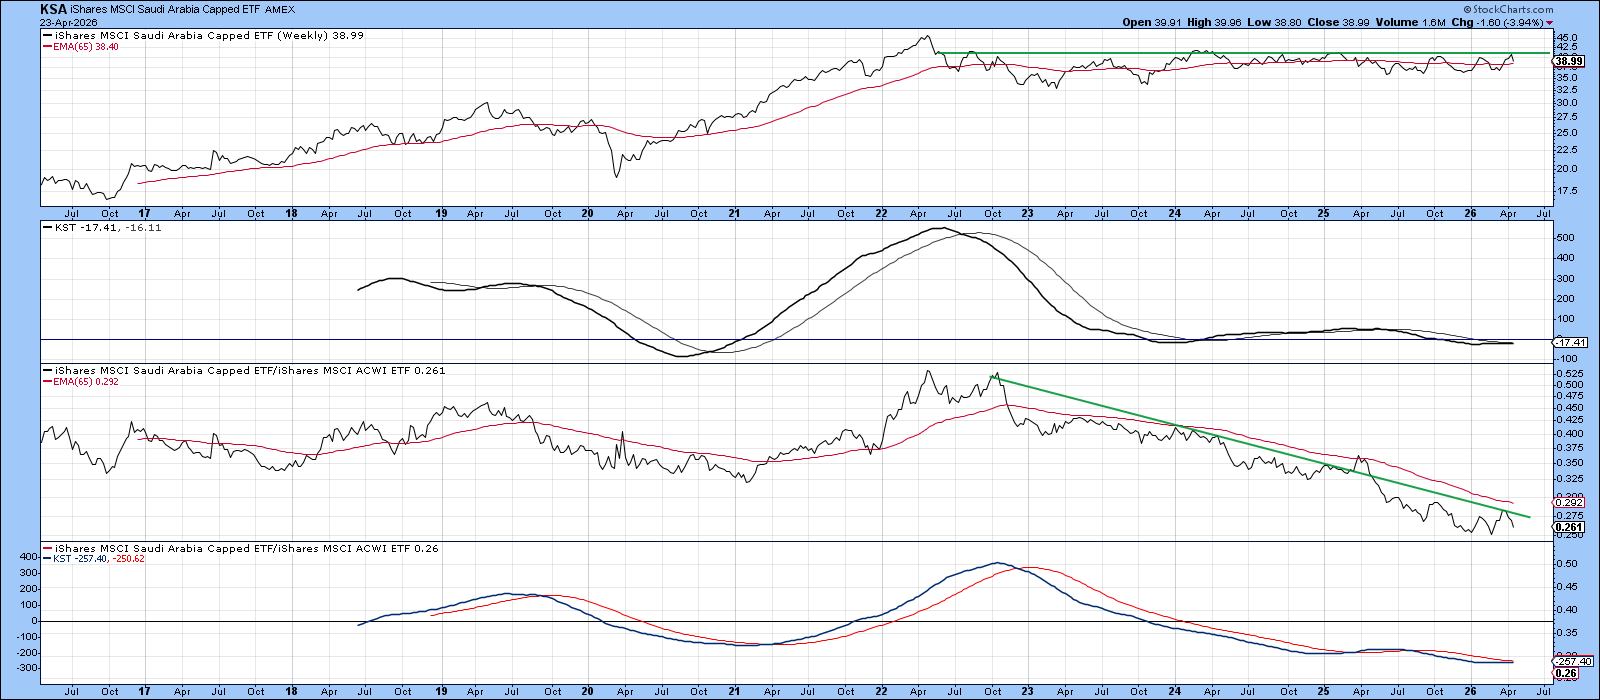
Saudi Arabia
KSA is also trapped in a trading range, but its technical underpinning looks somewhat stronger. Both momentum indicators have flattened and are beginning to firm, and the RS line has essentially moved sideways over the past six months. A decisive rally above the horizontal green resistance trendline would likely be the catalyst that improves the overall technical picture.
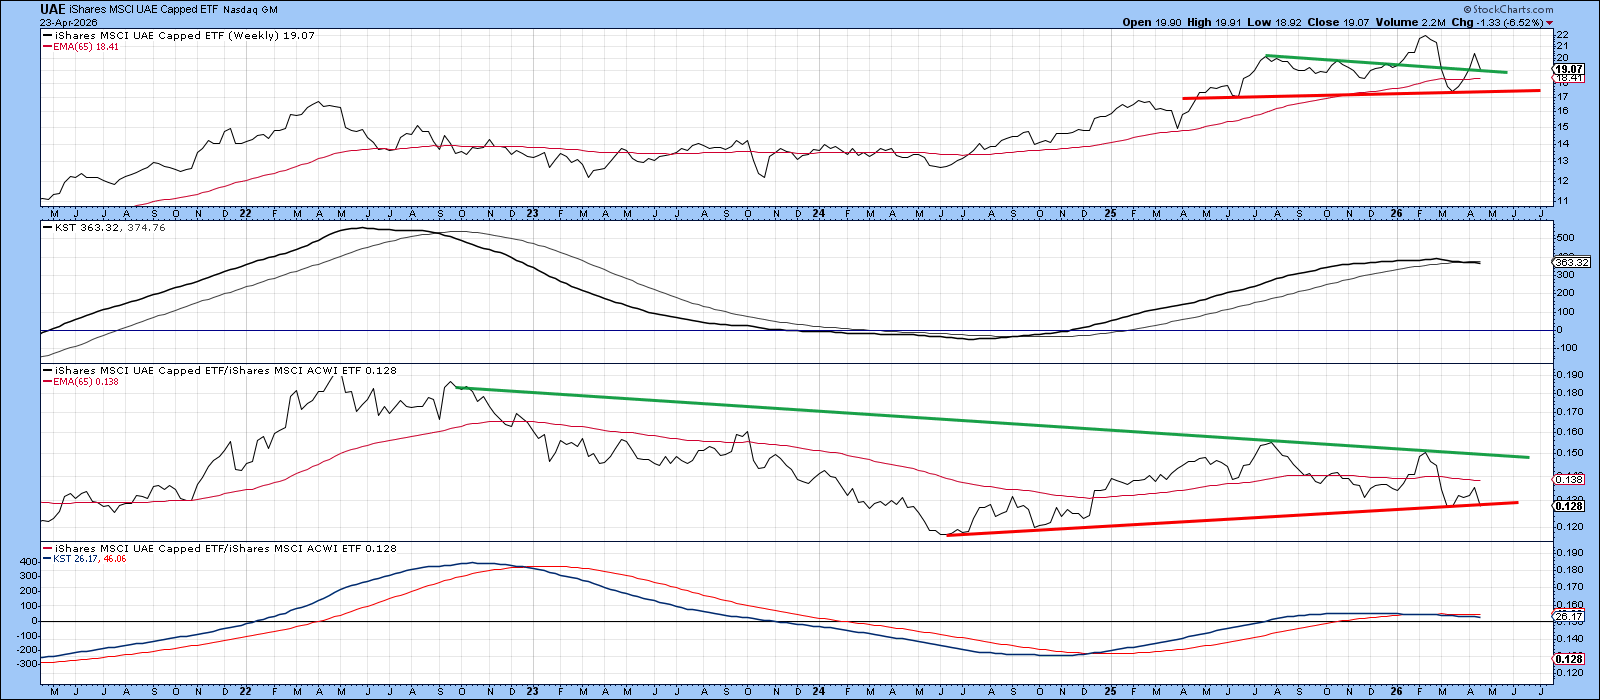
The UAE
The UAE, as noted earlier, has been the strongest performer among the Gulf markets over the past 1,300 days. However, that leadership may be at risk. Both KSTs have begun to roll over, and the RS line is now uncomfortably close to the neckline of a potential consolidation head‑and‑shoulders pattern. A break below that neckline would materially weaken the technical picture.
Turkey
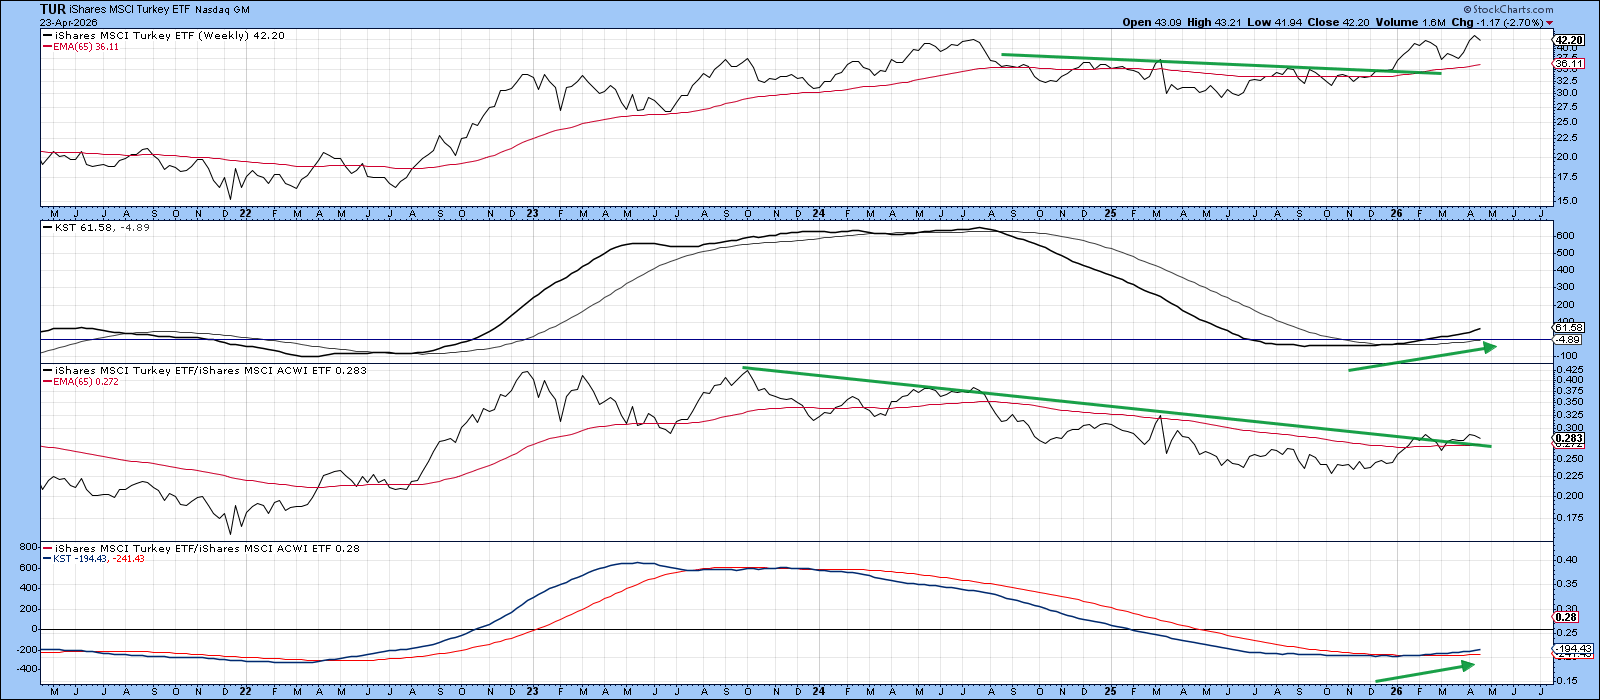
Finally, Chart 6 brings us to the iShares MSCI Turkey Fund (TUR). While Turkey is not a Gulf country, it is geographically close, and its technical position warrants attention. The absolute price sold off on the initial war news but has since recovered to a new post‑war high. The RS line has also broken slightly to the upside. Most importantly, both long‑term KSTs have turned decisively higher, leaving little doubt about the improving momentum backdrop.
Bottom Line
Price action for the individual Gulf‑state ETFs can best be described as rangebound, hardly the behavior of markets bracing for severe economic fallout from a neighboring conflict. At the same time, there is little evidence that investors are pricing in an imminent end to hostilities. The message from the charts is one of neutrality rather than stress or optimism. For that, we have to head slightly north to Istanbul, where the picture looks a little brighter.
Good luck and good charting,
Martin J. Pring
The views expressed in this article are those of the author and do not necessarily reflect the position or opinion of Pring Turner Capital Group of Walnut Creek or its affiliates. The Six Stages of the Business Cycle are followed each month in Martin Pring’s Intermarket Review.