Is This a Market Top or a Rotation Away From Big Tech?
How can we differentiate a major rotation in leadership from a broader topping pattern that could lead to a painful breakdown situation for investors? In the end, it comes down to our process for measuring relative strength and leadership themes.
In a recent mailbag episode of our daily market recap show, a viewer mentioned specifically the disconnect between the Nasdaq's daily action versus market breadth indicators we follow. One day in particular, the Nasdaq was down over 2% even though 67% of the NYSE was higher.
That perceived disconnect between market breadth and mega-cap technology tells me this is a leadership rotation, which could result in meaningful risk to our growth-oriented benchmarks. Let’s review the evidence together!
The S&P 500 Remains in a Consolidation Phase
Friday’s selloff on heightened concerns about the AI trade pushed the S&P 500 ($SPX) just below our “line in the sand” at 7600. For now, the S&P 500 remains within a consolidation phase going back to early August. In fact, Friday’s close was just slightly off the close from the first trading day in August!
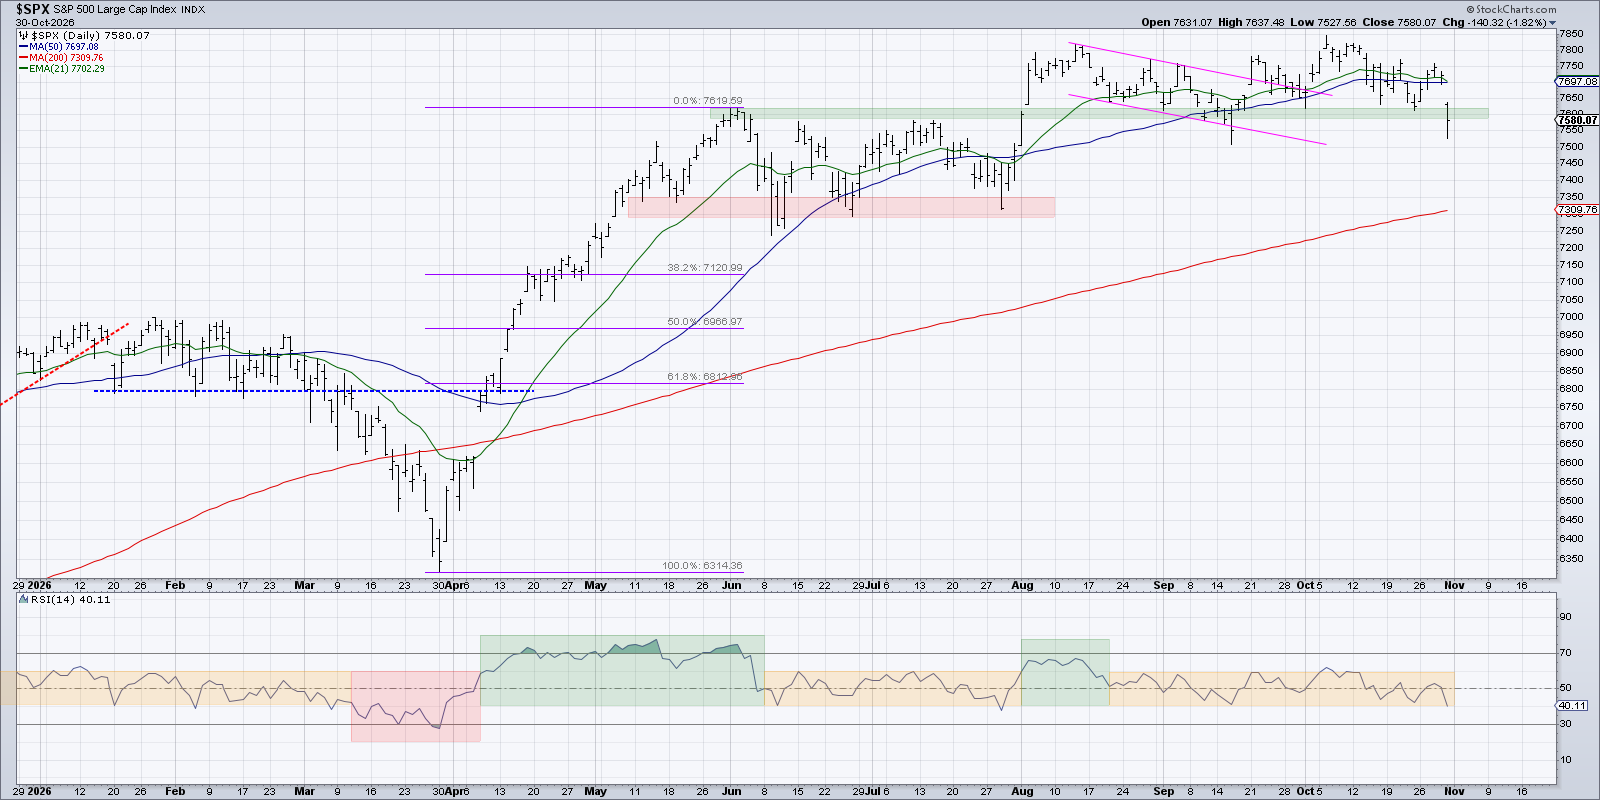
With the S&P pushing below key support, it’s worth remembering that any significant breakdown basically has three important moments to identify. First, we have an intraday break below the level in question, and Friday’s intraday move below 7600 definitely caused our own StockCharts price alert to fire off!
Second, we need a close below that support level, because often we’ll observe an intraday violation but the close ends back above support. Finally, we’re looking for a “follow through” day, where the price moves a little further in the new direction on the next trading day.
Monday will be an absolutely crucial session, because a bearish follow-through day could signal an end to the consolidation phase and the beginning of a new distribution phase.
Market Breadth Implies Underlying Strength
Now, while our benchmarks are showing clear signs of weakness, the Invesco S&P 500 Equal Weight ETF (RSP) remains in a tactical uptrend phase.
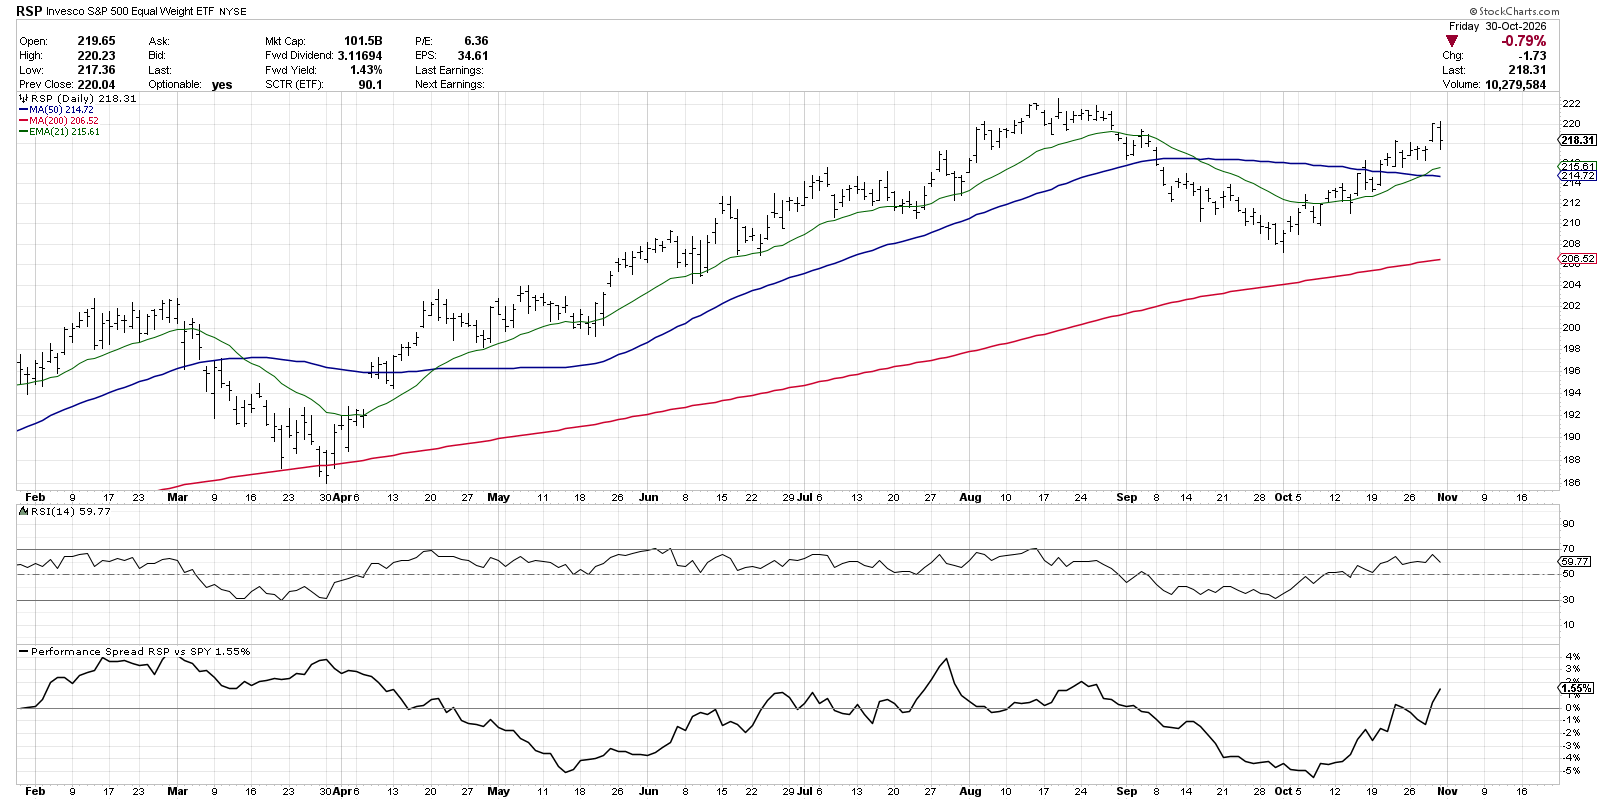
This divergence between the equal-weighted and cap-weighted indexes serves to validate the thesis that this remains more of a leadership rotation as opposed to a broad decline in equities. And as long as RSP continues to make higher highs and higher lows, we’re inclined to consider the general environment to be favorable for stocks.
Moving average breadth indicators seem to echo this positive sentiment, showing that over 60% of S&P 500 remain above their 200-day moving averages through Friday’s close. Also, over 60% currently sit above their 50-day moving averages, suggesting that while mega cap growth stocks are struggling, there are still plenty of stocks in positive trends.
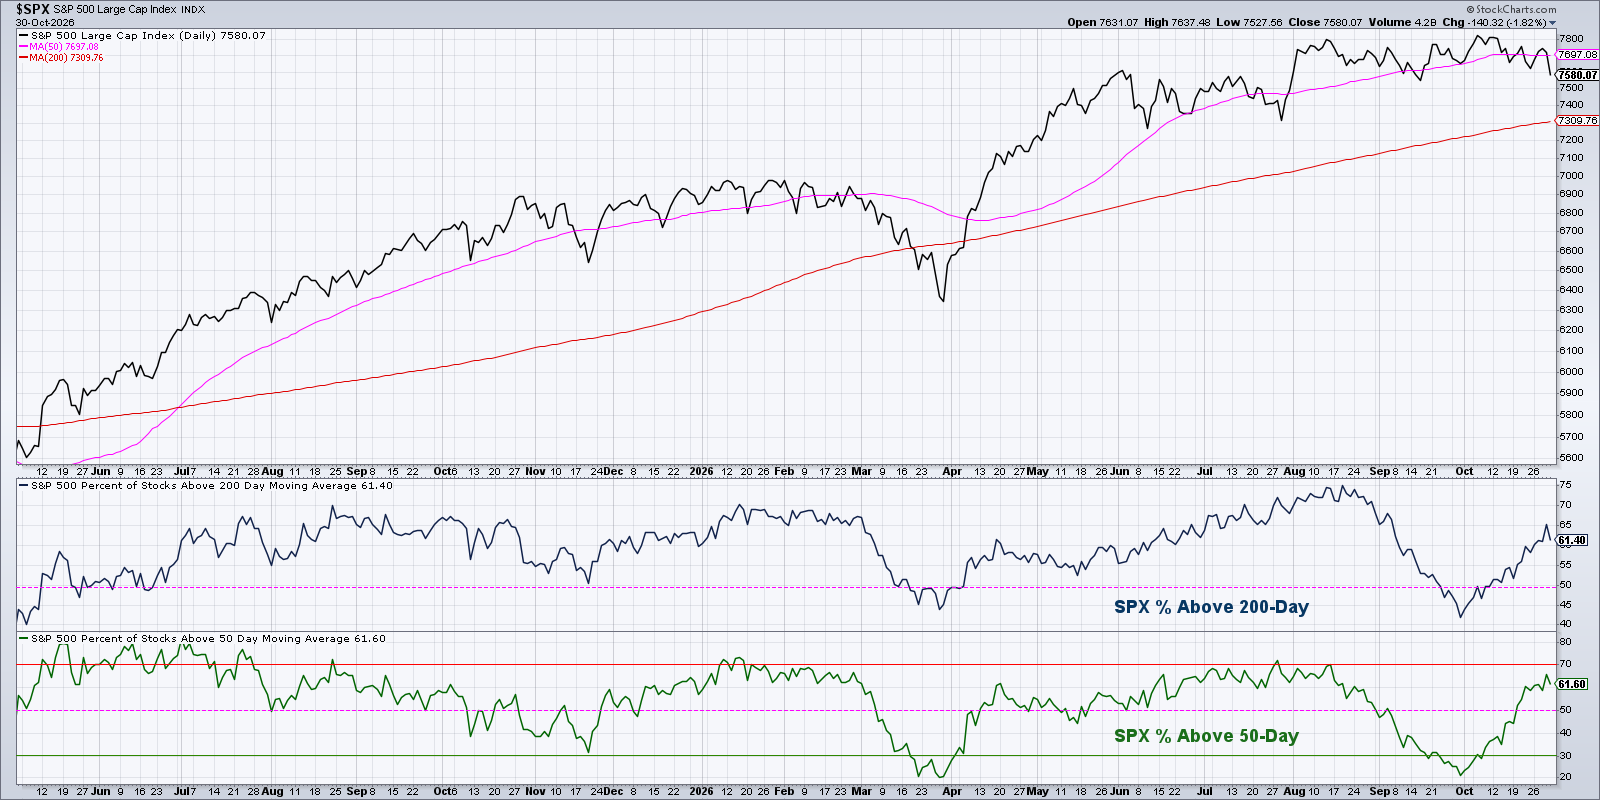
As long as these moving average breadth indicators remain above the important 50% level, we’re inclined to think of this market as a “growth stocks coming down to earth” market, as opposed to an “everything is going down” environment.
It’s Always a Good Time to Own Good Charts
None of the above points change the fact that leading growth stocks that I call “Dave’s Dirty Dozen” are flashing some concerning technical setups in recent weeks. Meta Platforms (META) began breaking down through support earlier this month, but the gap lower followed by additional distribution days shows what happens when investors decide aggressive AI spending may no longer be justifiable.
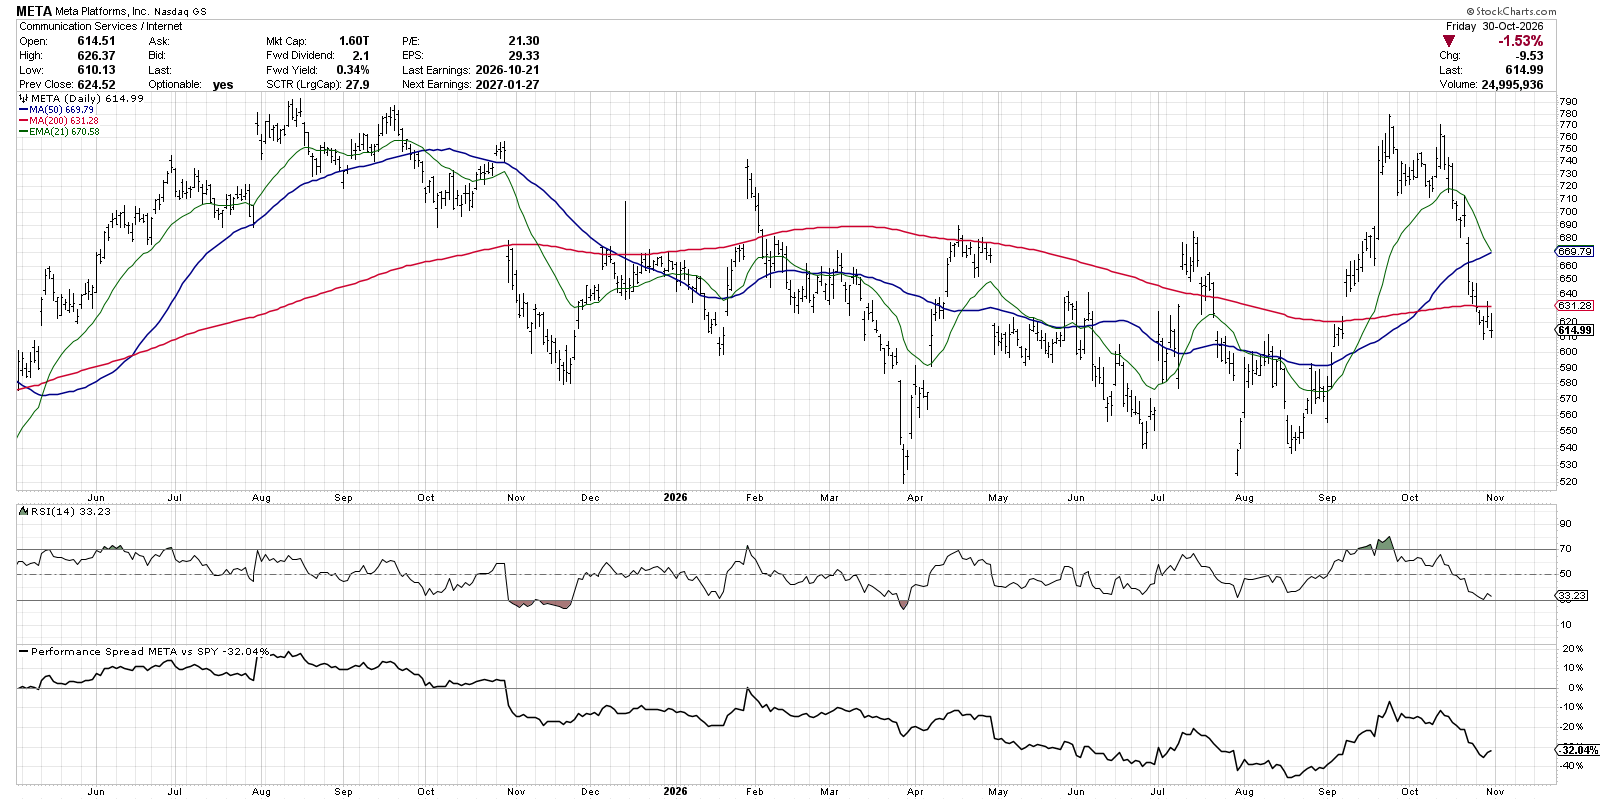
META has managed to break down each moving average in succession, with this week’s drop below the 200-day moving average providing the final confirmation of a true distribution phase. Until the price can regain this crucial long-term trend barometer, we’re looking elsewhere.
Alphabet (GOOGL) gapped lower on Thursday after earnings. Despite strong results in the cloud business, the weak results for search ad revenue and the staggering amounts of spending on the AI buildout really weighed on the price.
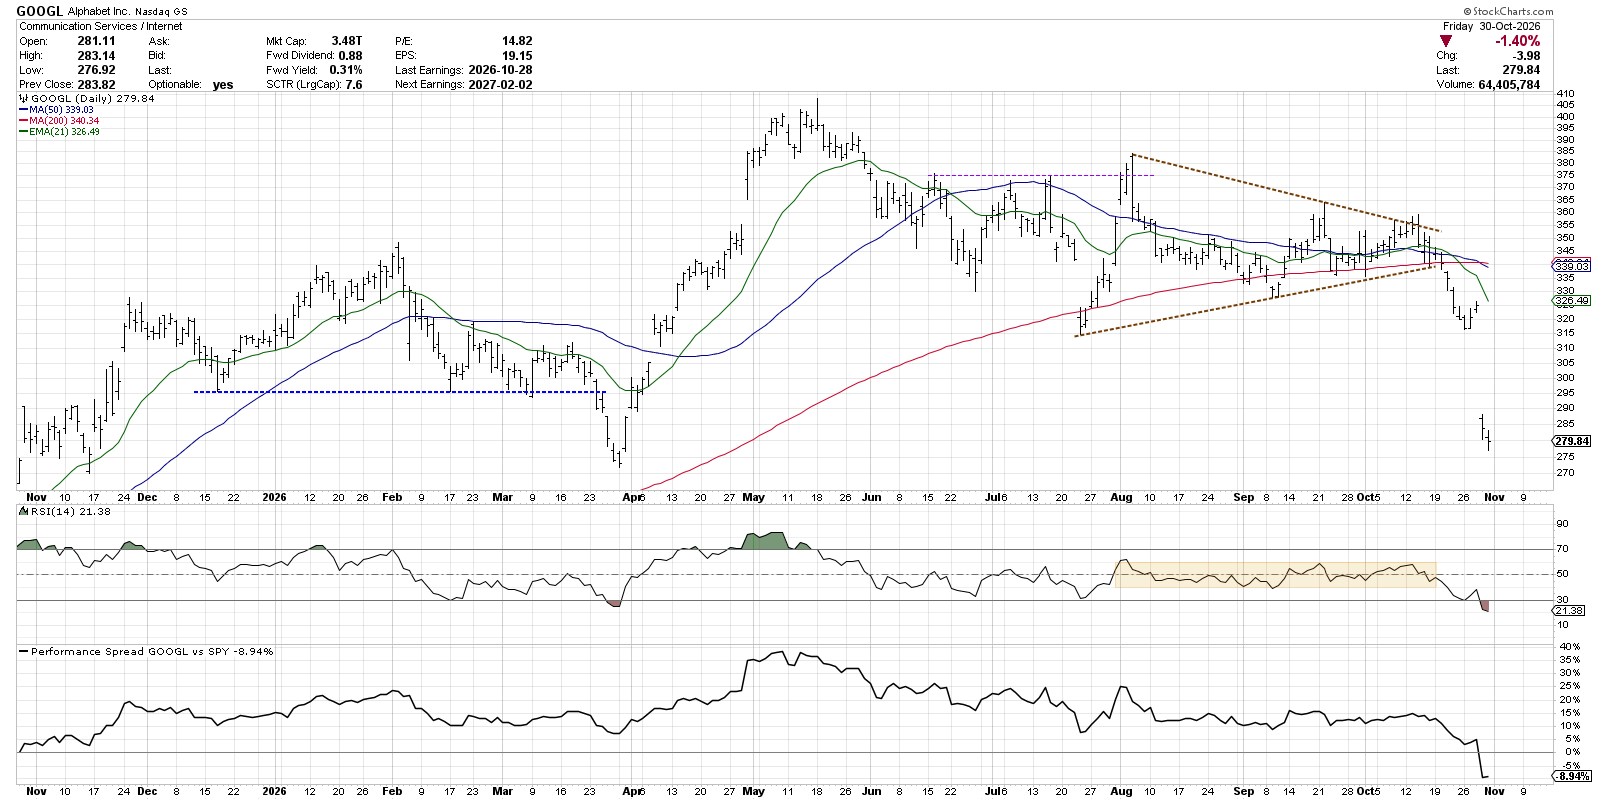
I think Friday was a telling day here, because after a big gap lower we’ll often see value-oriented investors basically have a 20% coupon on a leading growth stock. But the lack of buying power on Friday was evident as the price closed near the lows of the day.
So if Mag 7 names like META and GOOGL aren’t working here, where are investors able to find constructive technical setups? The good news is that there remain plenty of charts out there in primary uptrends, and tools like the StockCharts Screener can help you identify compelling charts like Visa (V).
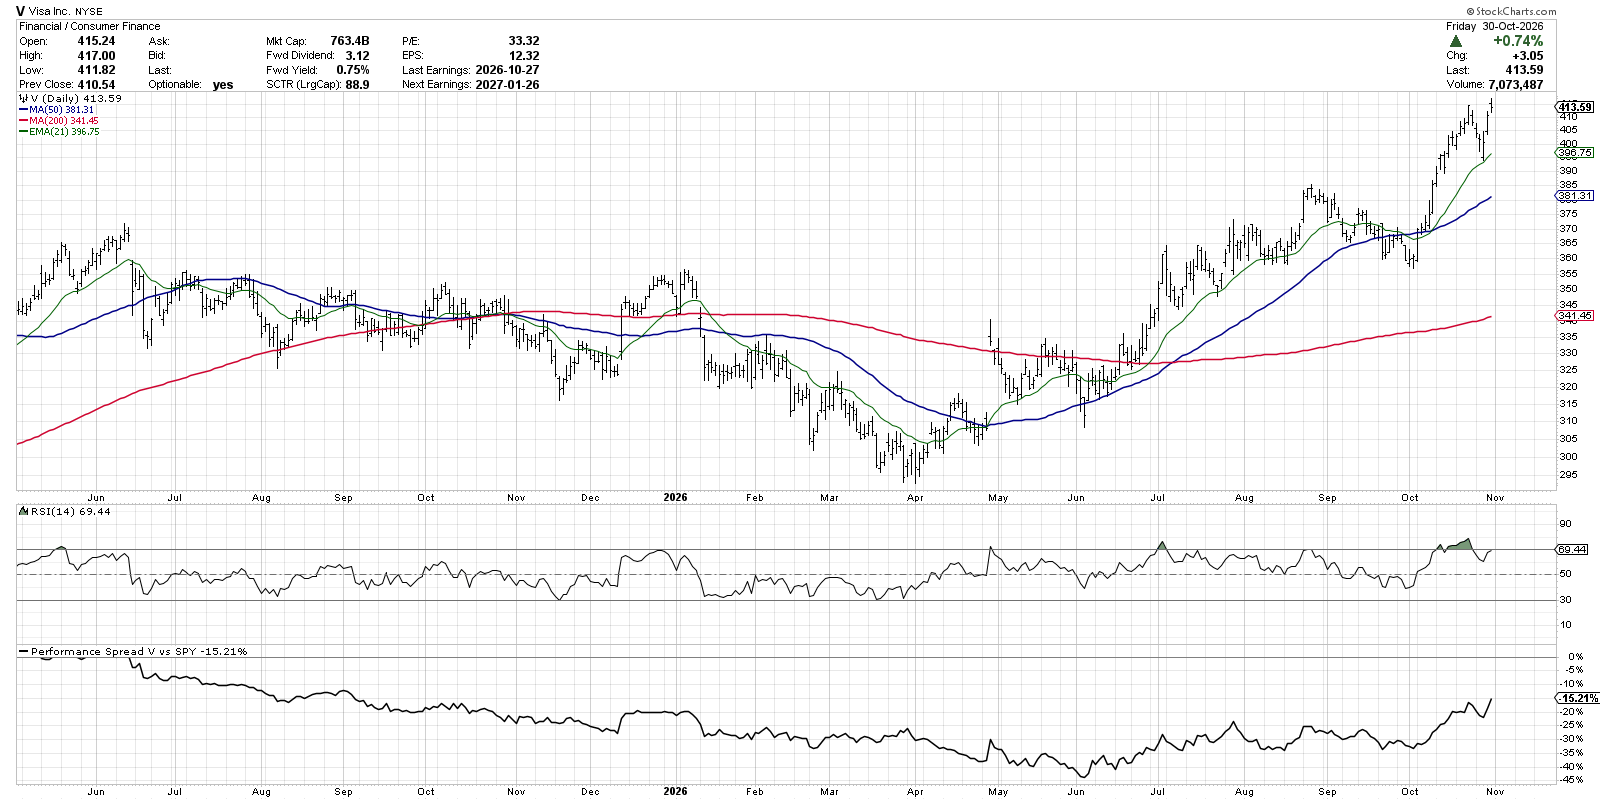
Visa recently pulled back to an ascending 21-day moving average after earnings, but then dip buyers seemed to jump in to push the stock to a new 52-week high on Friday. Higher highs and higher lows are bullish, so while leading growth stocks are mostly struggling, charts like V remind me that it’s always a good time to own good charts!
The Great Bull Market of 2026 has been dominated by sky high expectations for the AI trade. And while growth stocks have generated incredible returns so far in 2026, this earnings season is providing investors the opportunity to differentiate companies based on whether extreme expectations are still warranted.
We’re honestly expecting further downside for the S&P 500 before this corrective phase is complete. In the meantime, we’ll stay focused on finding good charts that remain in a position of strength despite weaker macro conditions for equities.
As a reminder, this article was derived from a viewer question on our Friday mailbag show. Check out the latest episodes on our YouTube channel!

RR#6,
Dave
P.S. Ready to upgrade your investment process? Check out my free behavioral investing course!
David Keller, CMT
President and Chief Strategist
Sierra Alpha Research LLC
marketmisbehavior.com
https://www.youtube.com/@DKellerCMT
Disclaimer: This blog is for educational purposes only and should not be construed as financial advice. The ideas and strategies should never be used without first assessing your own personal and financial situation, or without consulting a financial professional.
The author does not have a position in mentioned securities at the time of publication. Any opinions expressed herein are solely those of the author and do not in any way represent the views or opinions of any other person or entity.