Three Charts that Keep Me Awake at Night

Sometimes market conditions begin to align in a way that hints at a perfect storm. We are not there yet, but the warning signs are becoming increasingly difficult to ignore.
Chart 1 shows that Brent crude is sitting right on the neckline of a potential inverse head-and-shoulders pattern. Any meaningful advance from current levels would complete the formation and signal higher oil prices.
At first glance, that may not seem especially troubling. However, the lower panel tells an equally important story. It, too, is on the verge of an upside breakout. The catch is that the series plotted in that panel is the S&P Composite inverted. In other words, a breakout in crude oil would likely be accompanied by a corresponding breakout in the inverse S&P series, implying renewed weakness in the overall market.
And it doesn't stop there.
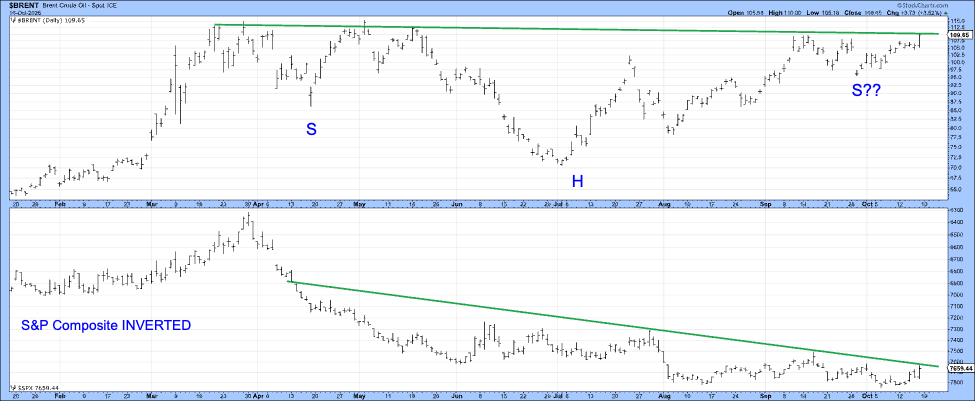
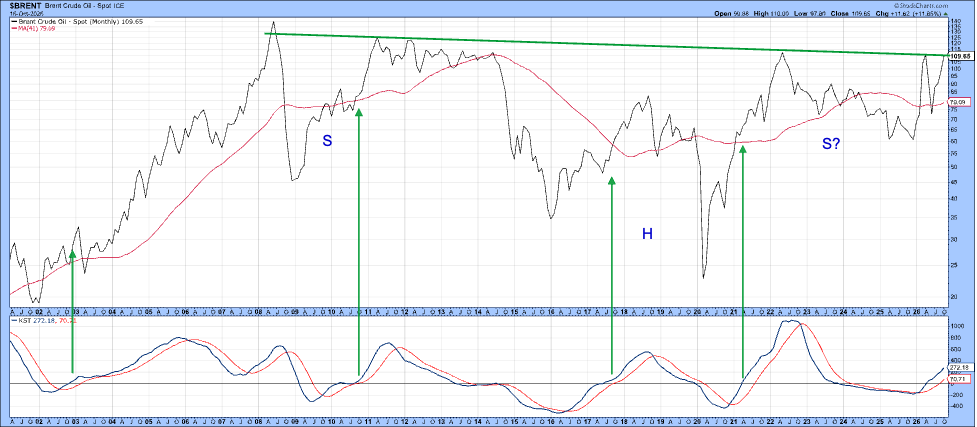
Chart 1 shows that crude oil has spent most of 2026 tracing out a potential continuation pattern. Chart 2 places that development in a much broader context by taking the analysis back to the start of the century. From that perspective, crude is confronting an even more formidable barrier: the multi-decade trendline emanating close to the 2008 peak.
A breakout above that trendline would be significant in its own right, but there is potentially much more at stake. The pattern may also be interpreted as the neckline of a potential 18-year inverse head-and-shoulders continuation formation. A decisive violation of that resistance would complete the pattern and imply a very substantial upside objective, raising the possibility that a secular advance in energy prices is about to enter a new phase. I should also add a note of caution: similar breakouts in other commodity markets have often failed to achieve their implied minimum upside objectives. Consequently, it would be a mistake to interpret this pattern as signaling an armageddon-like outcome involving a tripling or quadrupling of crude prices.
Even so, the technical implications remain significant. A successful breakout would likely be followed by substantially higher prices, even if they ultimately fall short of the pattern's theoretical target. Nor should we assume that any such advance would prove permanent. Markets frequently overshoot, consolidate, and then retrace a portion of their gains. Nevertheless, the message from the chart would be clear: the path of least resistance for crude oil would be higher, with potentially important implications for inflation, interest rates, and financial markets.
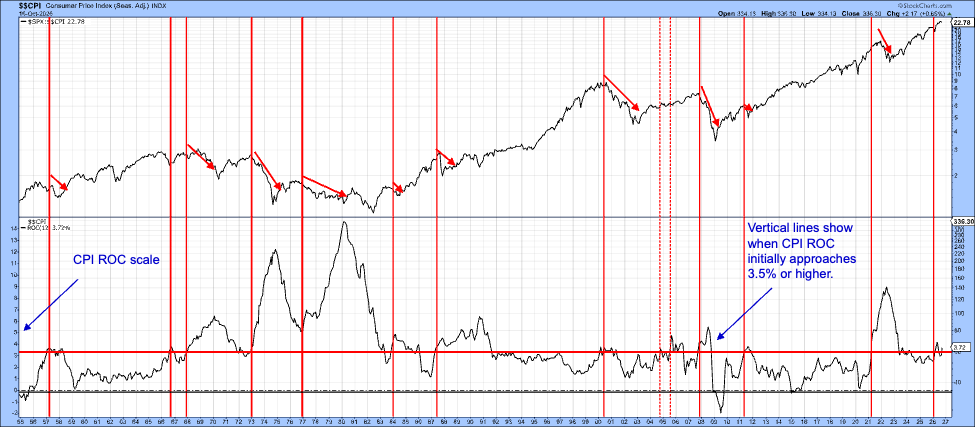
Crude oil does not operate in isolation. Higher energy prices work their way into the CPI through both direct and indirect channels, so a decisive upside breakout in crude would almost certainly place renewed upward pressure on inflation. Chart 3 suggests that would not be welcome news for equities.
The chart compares the inflation-adjusted S&P Composite with the 12-month rate of change in the CPI. One message stands out: equities have generally been able to tolerate inflation as long as the CPI's annual rate of change remains below the horizontal red line at 3.5%, or is at a high number but in a declining trend. Indeed, peaks in the ROC have often represented great buying opportunities.
Even when inflation has very slightly exceeded that threshold, stocks have often held up reasonably well. (Note that the CPI scale is plotted on the left axis, not the right.) Earlier this year, the CPI moved above the 3.5% threshold before subsequently retreating below it. However, the latest September data show that it has once again crossed into the danger zone.
History suggests that serious and sustained equity-market damage does not typically occur merely because the CPI briefly exceeds 3.5%. Rather, the problem arises when inflation establishes a persistent rising trend above that level, as appeared to be developing earlier in the year. If crude oil does break to materially higher ground, it is difficult to envision a scenario in which the CPI does not follow. Should that occur, the inflation backdrop facing equities would become considerably less favorable.
Bottom Line
Crude oil could be on the verge of a major upside breakout. If it does break higher and the signal proves valid, substantially higher prices are likely to follow. Those gains would almost certainly feed into the CPI, increasing inflationary pressures at a time when the indicator has already moved back into the danger zone. In that event, equity investors could find themselves facing one of the key ingredients of a potential financial-market perfect storm: rising inflation accompanied by falling stock prices.
Good luck and good charting,
Martin J. Pring
The views expressed in this article are those of the author and do not necessarily reflect the position or opinion of Pring Turner Capital Group of Walnut Creek or its affiliates. The Six Stages of the Business Cycle are followed each month in Martin Pring’s Intermarket Review.