'Tis the Season To Be Bullish

Yes, I know that our major indices struggled to close out October, but November is a brand new month, and if history is any guide, it'll likely be a good one for the bulls.
Here's how the S&P 500 ($SPX) has performed on average, by calendar month, over the past 47 years.
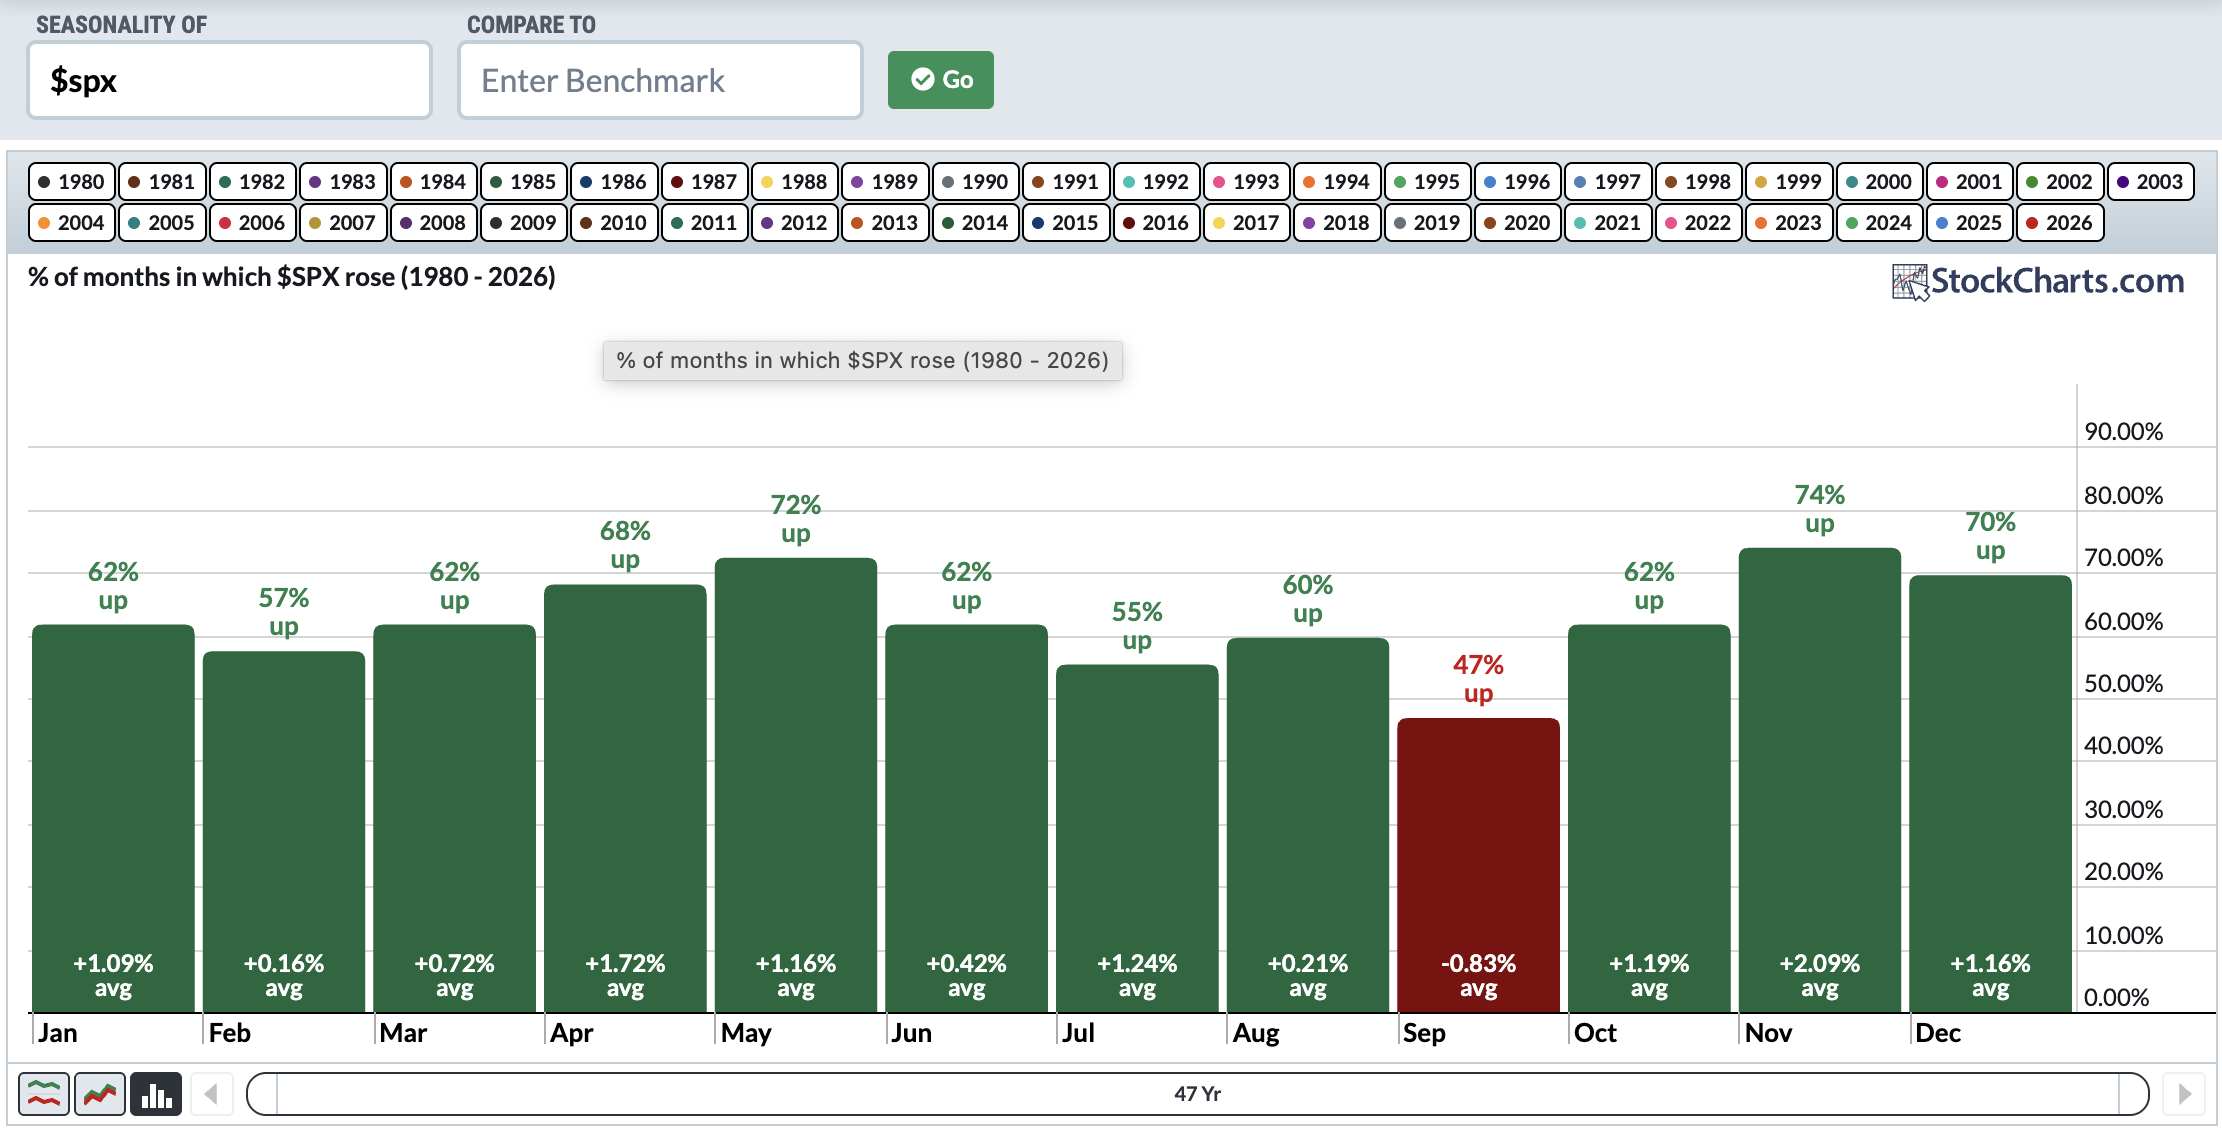
Over this 47-year period, November has been higher more often (74%) than any other month and its average return of 2.09% is also higher than any other month.
Now for the interesting part. Technology has easily been the best-performing sector over the years, as its representation in the S&P 500 keeps growing and growing. But during this secular bull market advance, since the S&P 500 cleared its 2000 and 2007 tops in 2013, technology has performed worst, on a relative basis, during Q4. Check out this relative seasonality performance by the XLK.
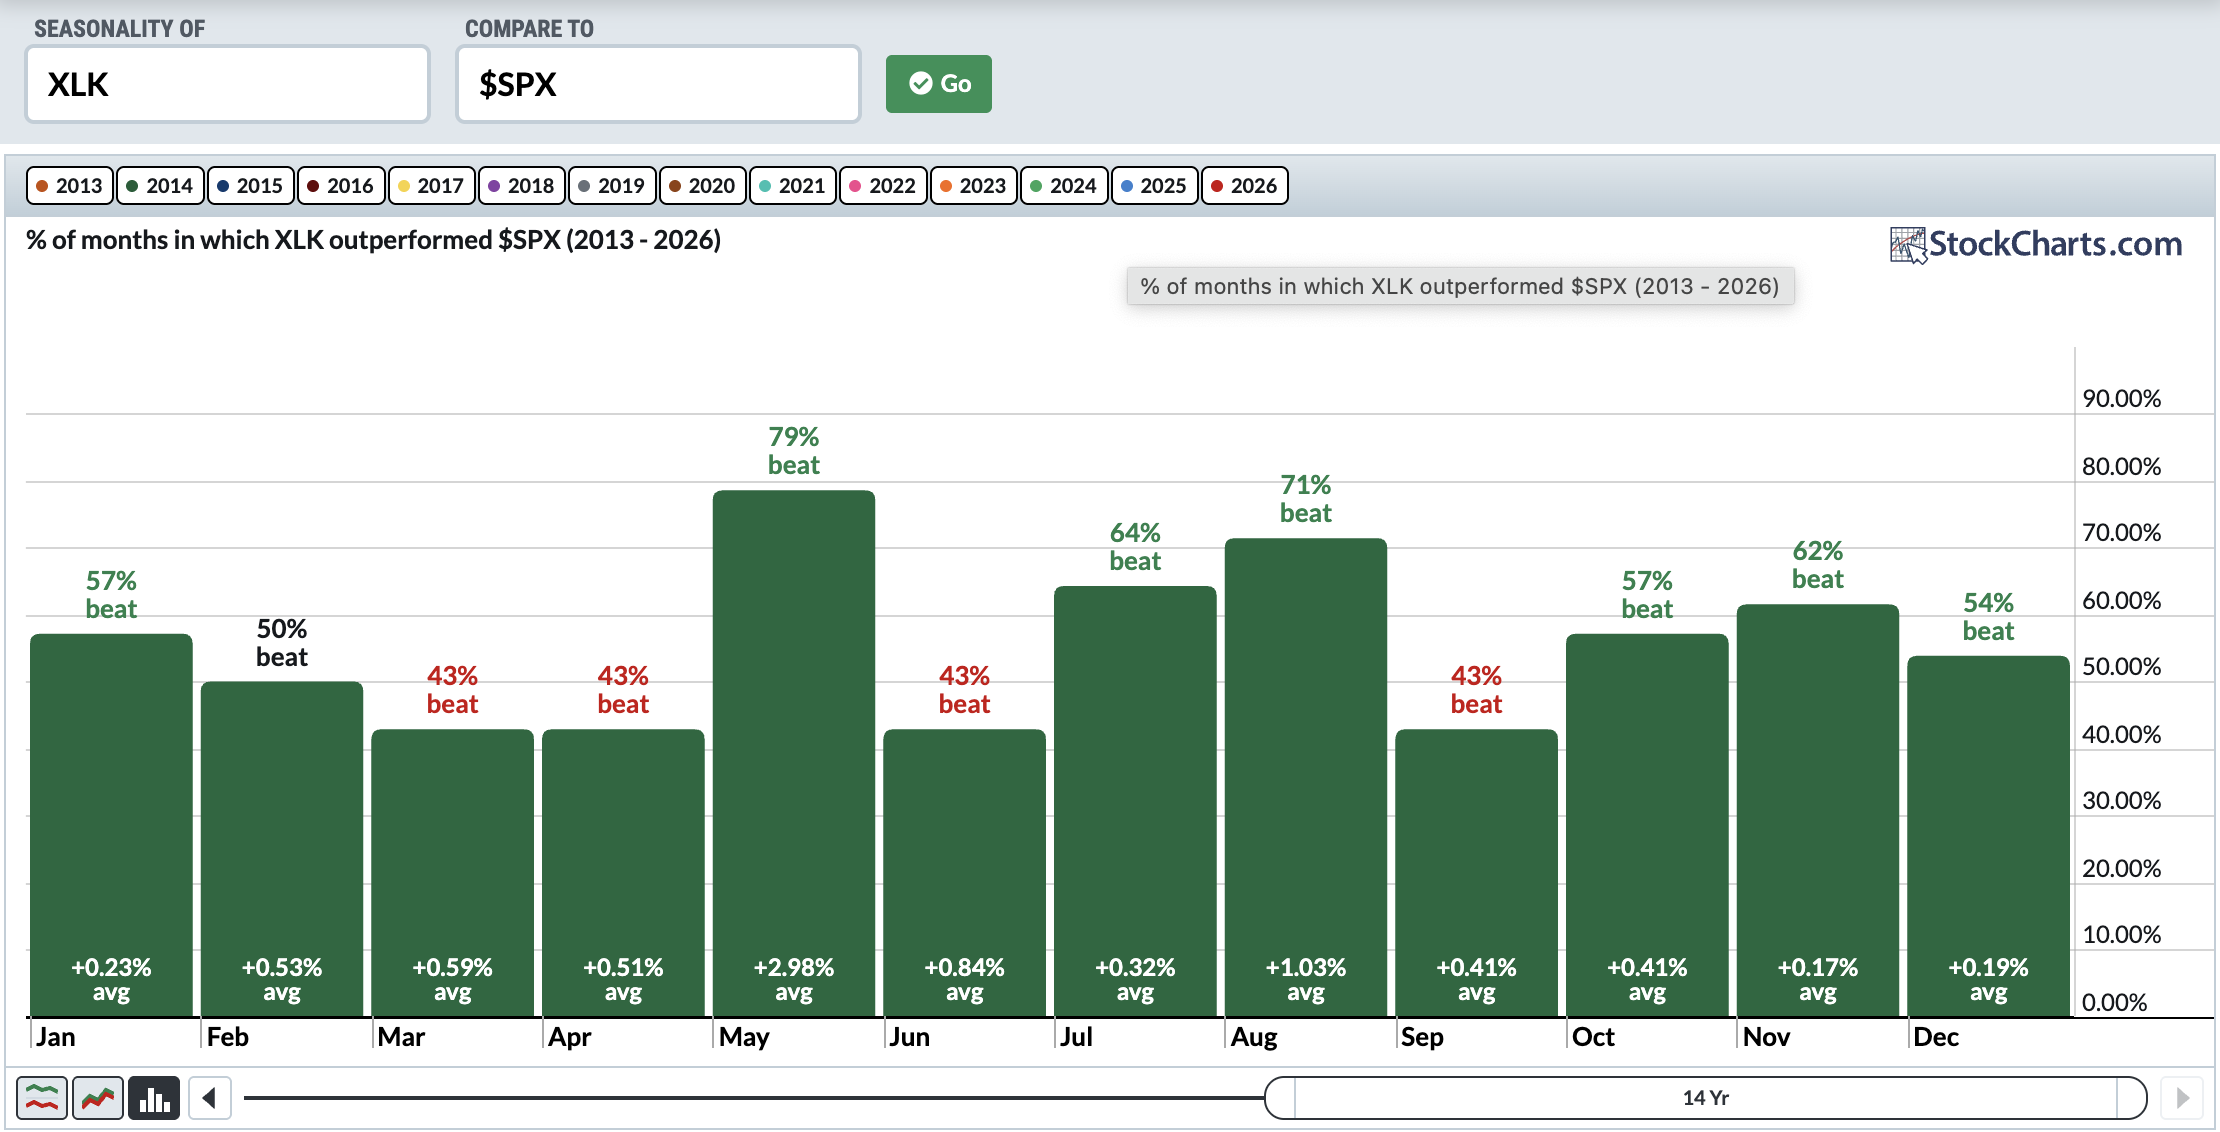
First, note that the XLK has outperformed the benchmark S&P 500, on average, in every single month. That's the mark of a true leader. However, if you add up the average monthly outperformance in each calendar quarter, you'll come up with technology's average quarterly outperformance as follows:
- Q1: +1.35% (+0.23%+0.53%+0.59%)
- Q2: +4.33%
- Q3: +1.76%
- Q4: +0.67%
The takeaway here is that it's not at all unusual to see leadership in other areas during Q4. In fact, one sector that loves Q4 (and November) is Financials (XLF). Check out the XLF's relative performance by calendar month since 2013.
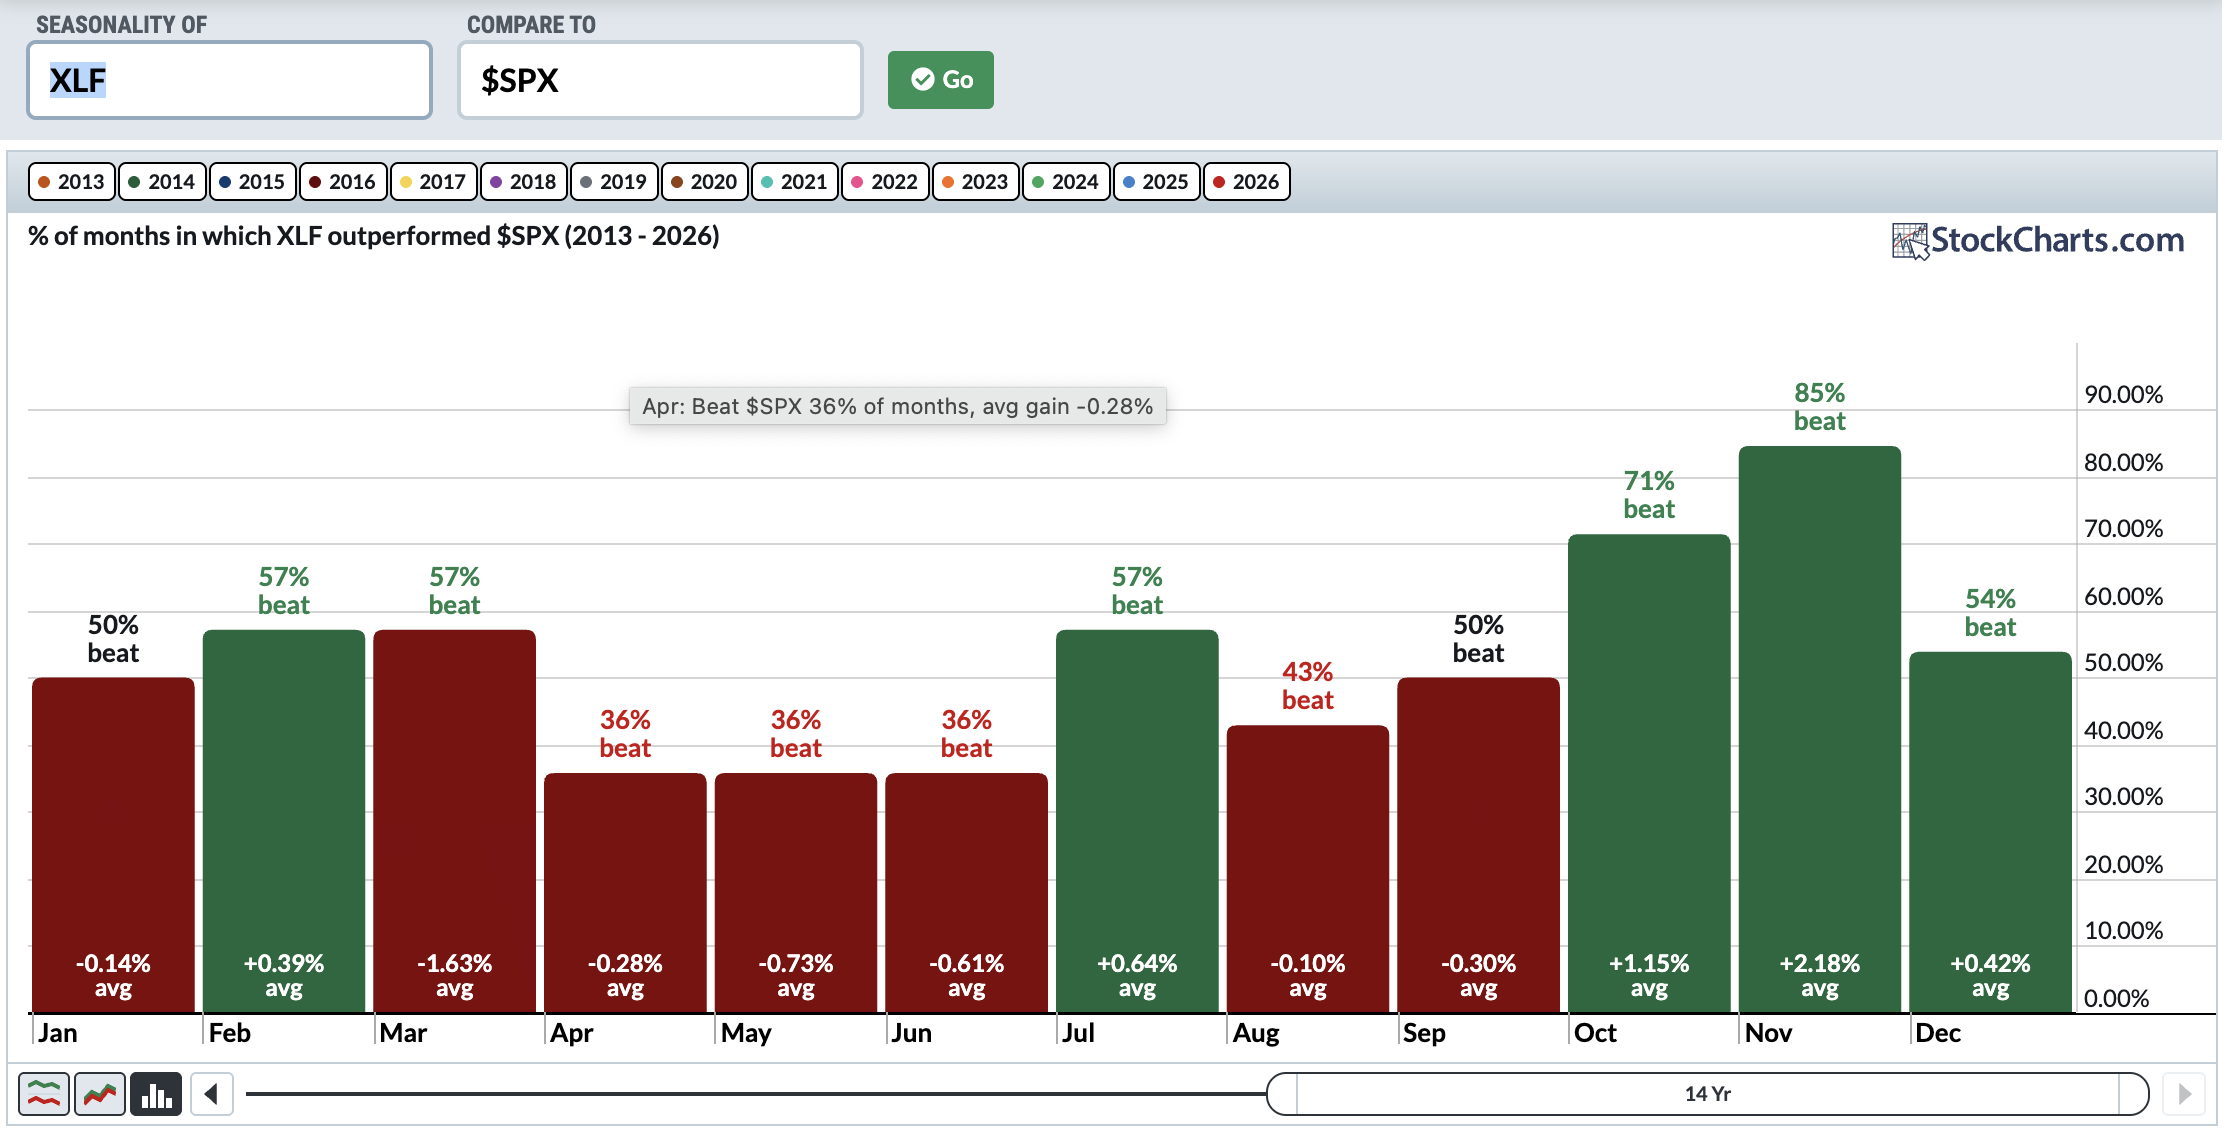
The XLF's Q4 outperformance is rather obvious and November is easily its best month. Apparently, Wall Street is repositioning into Financials as we head into November.
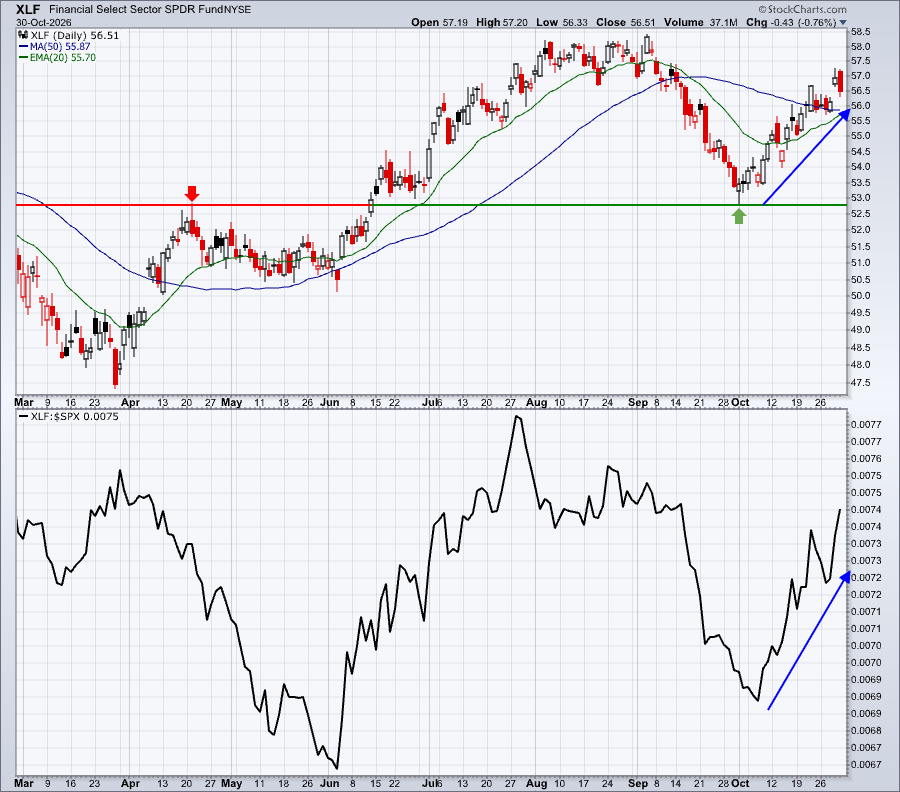
Every month, we look at the upcoming month for seasonal trends and our November Seasonality Report is now available. In addition to the historical breakdown of the S&P 500's performance throughout November, this report also provides the key sectors and industries that have a history of performing well in the upcoming month. Furthermore, I'm providing two stocks in this report that have gained ground in November during each of the past 14 Novembers and they're both set up technically to move higher in November 2026.
If you'd like a copy of this November Seasonality Report for FREE this weekend, and check out those two strong November stocks, simply CLICK HERE and provide your name and email address. There is no credit card required.
Happy trading!
Tom