Go U.S. or Go Global? The Technical Evidence Favors America

Of late, the U.S. Dollar Index ($USD) has been strong. And one trend that often accompanies that strength is the relative performance of the U.S. stock market versus the rest of the world, two relationships that have a habit of reinforcing one another.
SPY vs. EFA
Relative performance, in this case, is measured by dividing the U.S. market ($SPX) by the Europe, Australia, and Far East Index, or in ETF terms, comparing the SPY to the EFA. Chart 1 provides the long-term perspective.
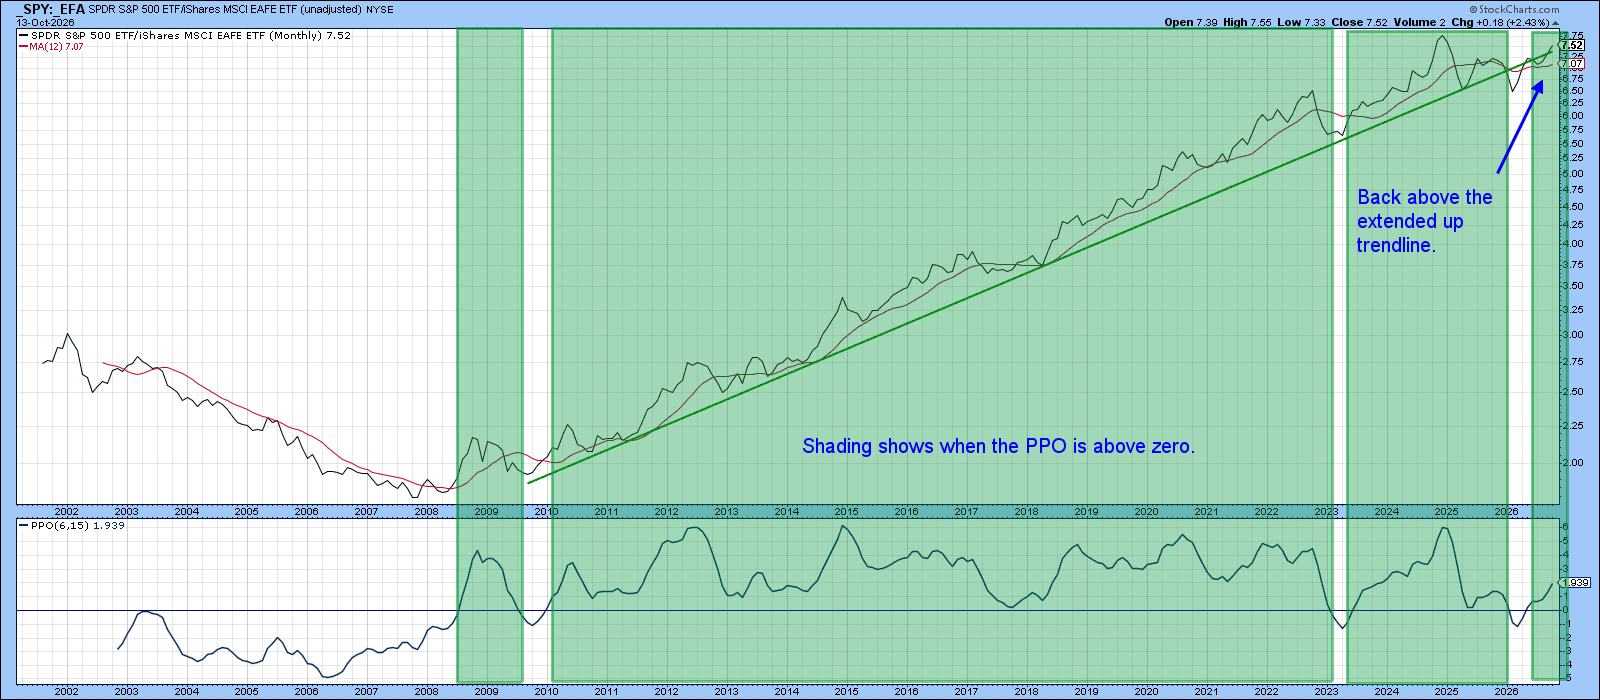
The U.S. reached a low point in this relationship in 2007 following a lengthy decline. Early indications of a trend reversal came when the ratio surged above its 12-month moving average and the Percentage Price Oscillator (PPO), using 6- and 15-month parameters, climbed above zero for the first time in many years. What followed was nothing short of spectacular: A powerful multi-year uptrend that lasted until late 2024.
In early 2025, this relationship looked like it was beginning to reverse. The ratio fell decisively below its 12-month moving average, a move that was accompanied by a negative PPO zero-line crossover. However, 2026 has been far more favorable for U.S. equities, as both benchmarks have been recaptured. Moreover, the ratio has tentatively broken back above what had been major resistance in the form of a long-standing secular uptrend line.
I use the word "tentatively" because last month's penetration was only marginal, and there's no guarantee the ratio will remain at current levels through month-end, when October's final reading is recorded. Nevertheless, the recent action suggests that U.S. equities may once again be assuming a leadership role relative to their international counterparts.
SPY vs. ACWI
Chart 2 shows the current situation in greater detail. In this case, SPY is compared with the iShares MSCI World ETF (ACWI). The ratio broke down from a well-defined head-and-shoulders top in early 2026; however, there was no meaningful downside follow-through. Instead, the ratio began zigzagging higher, recapturing its 65-week EMA and subsequently breaking above the green downtrend line.
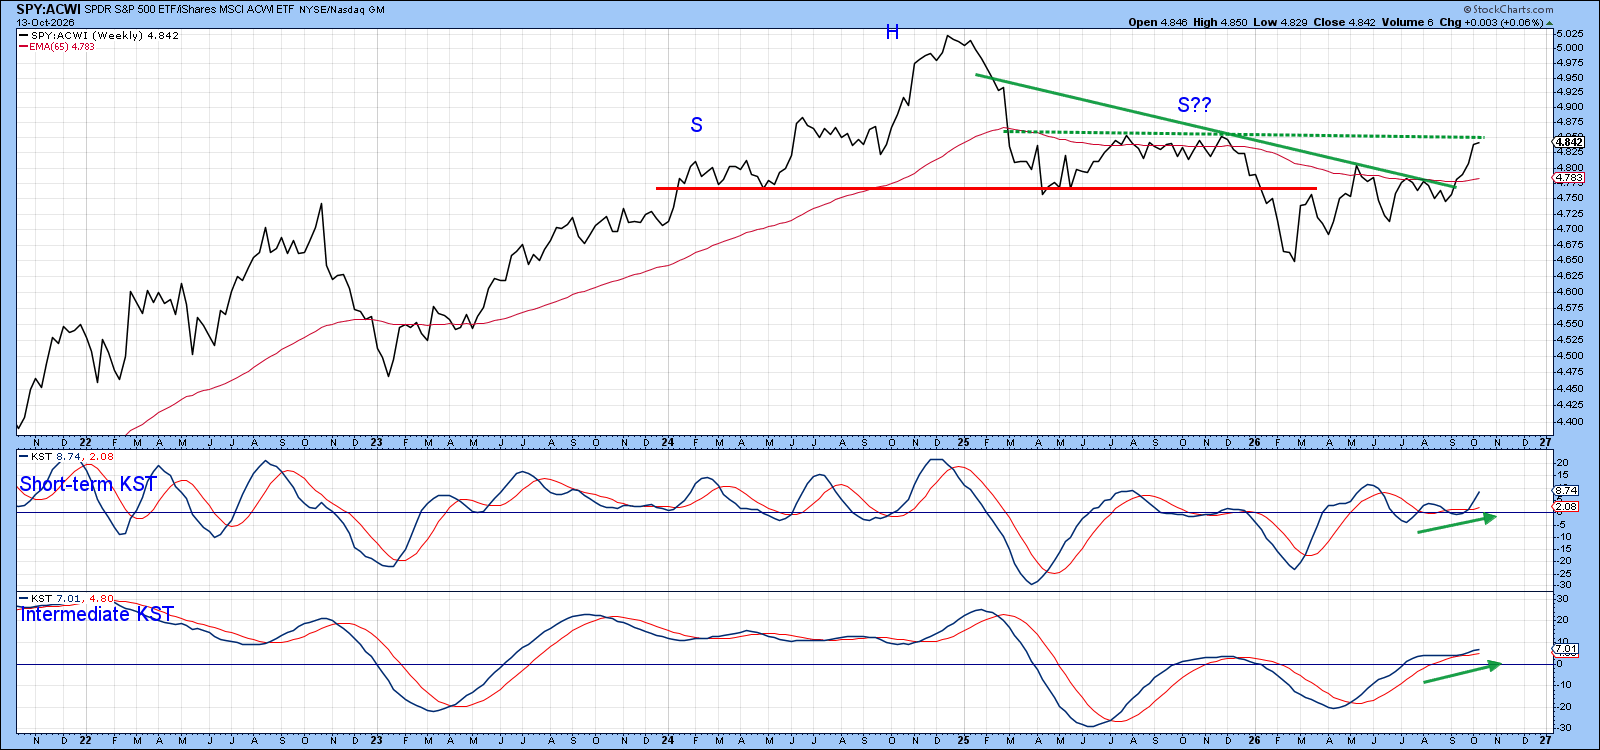
Now, both Know Sure Thing (KST) indicators are in bullish territory, and neither appears overextended. Consequently, the path of least resistance still appears to be higher. At a minimum, the ratio seems capable of holding at the green-dashed resistance line and consolidating its recent gains within the range defined by the two diverging lines.
It’s important to remember that when a head-and-shoulders pattern fails, as seems to be the case now, the subsequent advance is often stronger than expected. That’s because traders who positioned themselves for a breakdown are forced to reverse course and scramble back to the bullish side of the market. As a result, failed bearish patterns frequently act as catalysts for above-average upside moves.
An Alternative Comparison
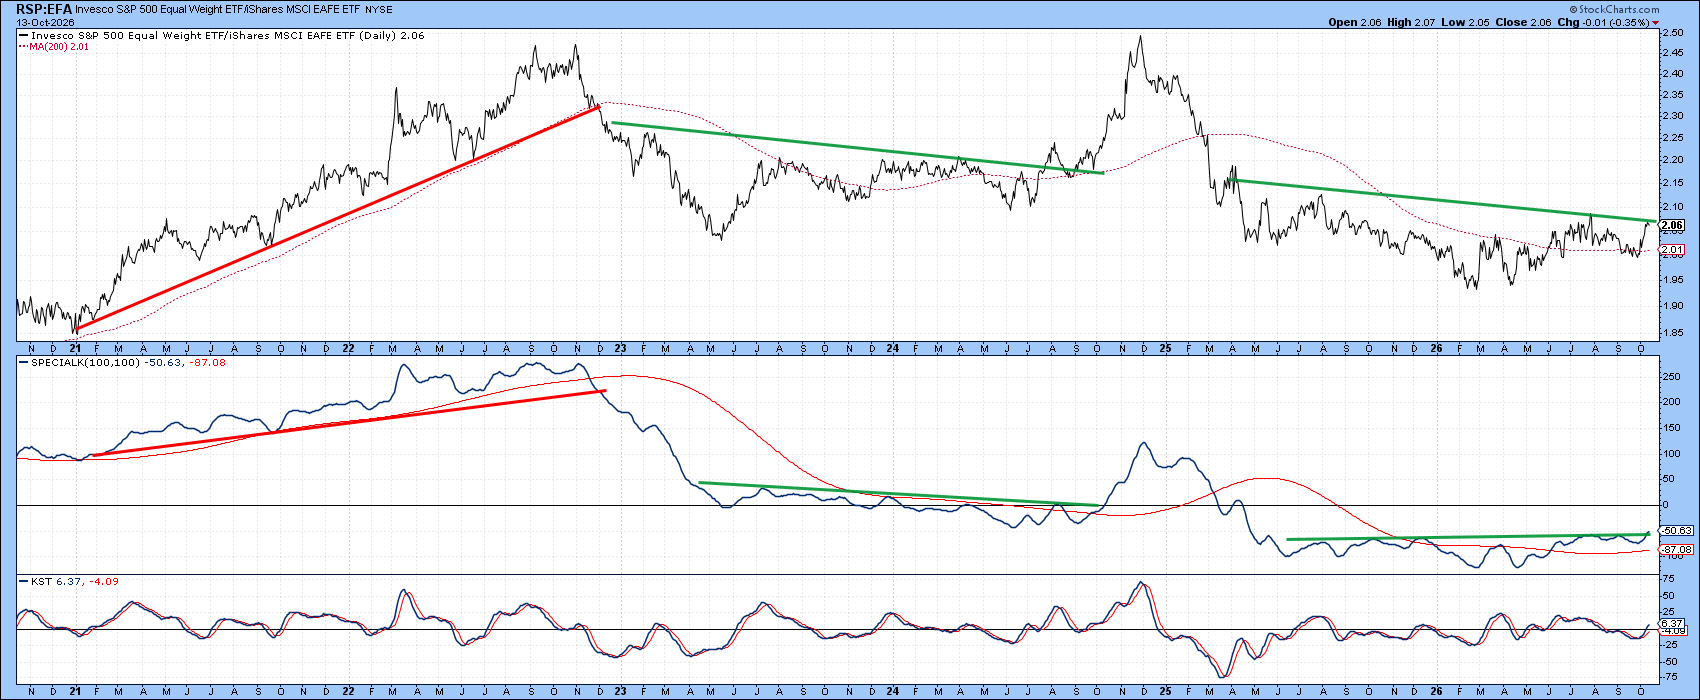
The S&P 500 may be the flagship U.S. equity benchmark, but that status comes with a significant technology bias. For that reason, you can argue that the Invesco S&P 500 Equal Weight ETF (RSP) offers a better reflection of the broad market when making relative strength comparisons.
From that perspective, Chart 3 shows that the RSP/EFA ratio broke down from a double-top formation late last year. In the interim, however, that breakdown has turned out to be spurious. Even so, the recovery has not yet progressed to the point where we can point to a decisive move above the 65-week EMA and completion of the potential base defined by the green trendline.
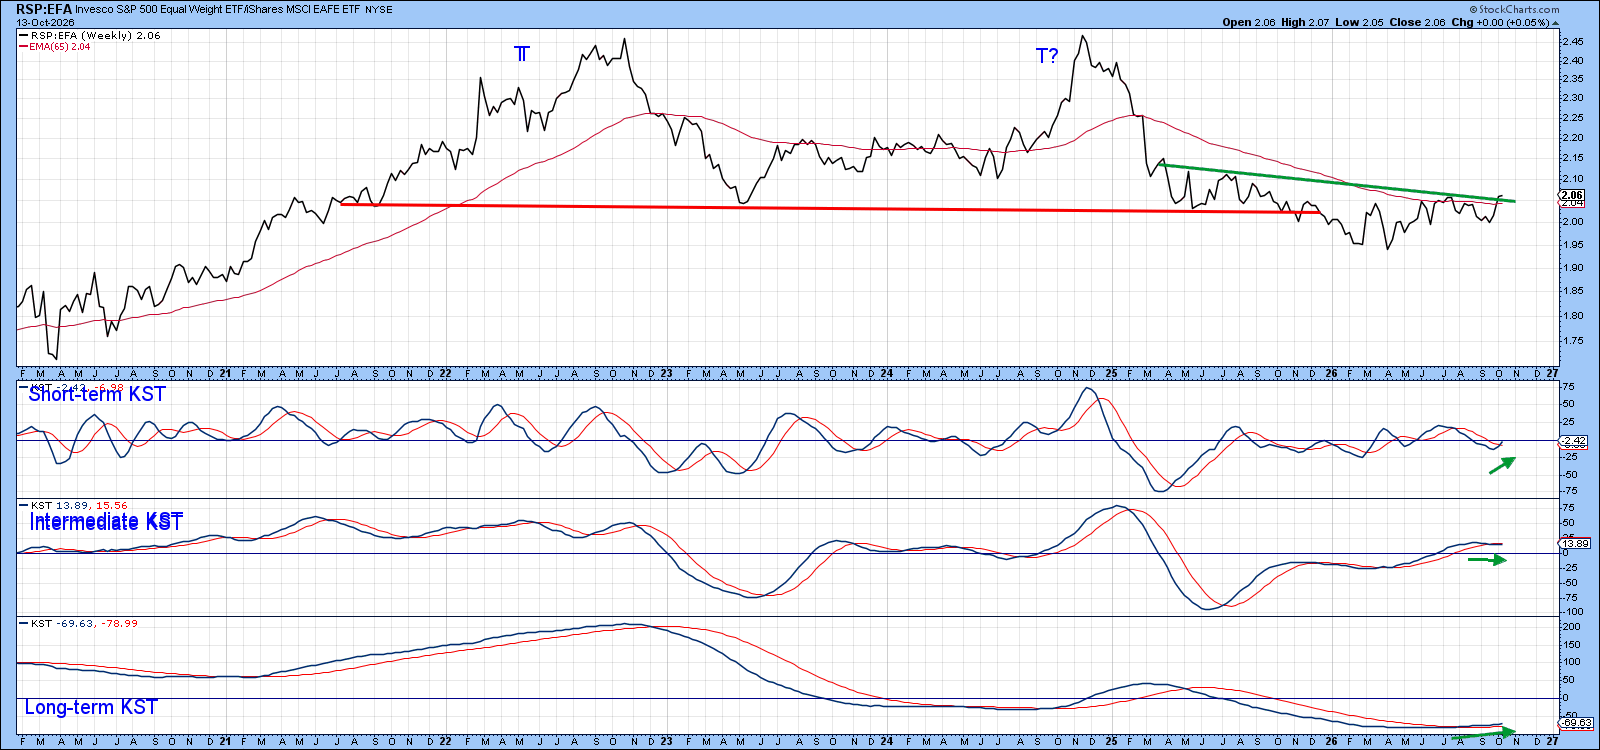
The momentum characteristics, however, suggest that an upside breakout is the more likely outcome. Both the short- and intermediate-term KSTs are in bullish territory, indicating that upside pressure continues to build. A successful breakout would not only complete the base but also provide further evidence that U.S. equities are reasserting their leadership relative to international markets.
Finally, Chart 4 shows that the Special K indicator has already crossed decisively above its signal line and is now approaching a breakout above the green resistance trendline. The pattern closely resembles the setup that preceded the mid-2024 breakout, a development that ushered in a renewed phase of U.S. equity leadership. If history is any guide, the current configuration points to further gains in the relative performance of U.S. stocks versus their international counterparts.
The Bottom Line
Just under a year ago, it appeared that the secular uptrend favoring U.S. equities over the rest of the world had come to an end. Recent technical action, however, has rescued the ratio from what appeared to be a decisive downside break. After an extended pause, the U.S. now appears poised to reassert its leadership and resume its long-term trend of outperformance.
Whether that leadership remains confined to the capitalization-weighted S&P 500 or is joined by its equal-weight counterpart could prove decisive in the weeks ahead. A breakout by the equal-weight measure would signal that U.S. strength is broadening beyond a handful of large-cap stocks, thereby lending greater credibility and durability to the relative-performance advance.
Good luck and good charting,
Martin J. Pring
Ready to analyze global market performance? Head to the Market Summary page and dive into the Country Funds tab in the Equities panel.
The views expressed in this article are those of the author and do not necessarily reflect the position or opinion of Pring Turner Capital Group of Walnut Creek or its affiliates. The Six Stages of the Business Cycle are followed each month in Martin Pring’s Intermarket Review.