It’s Crunch Time for the Transports

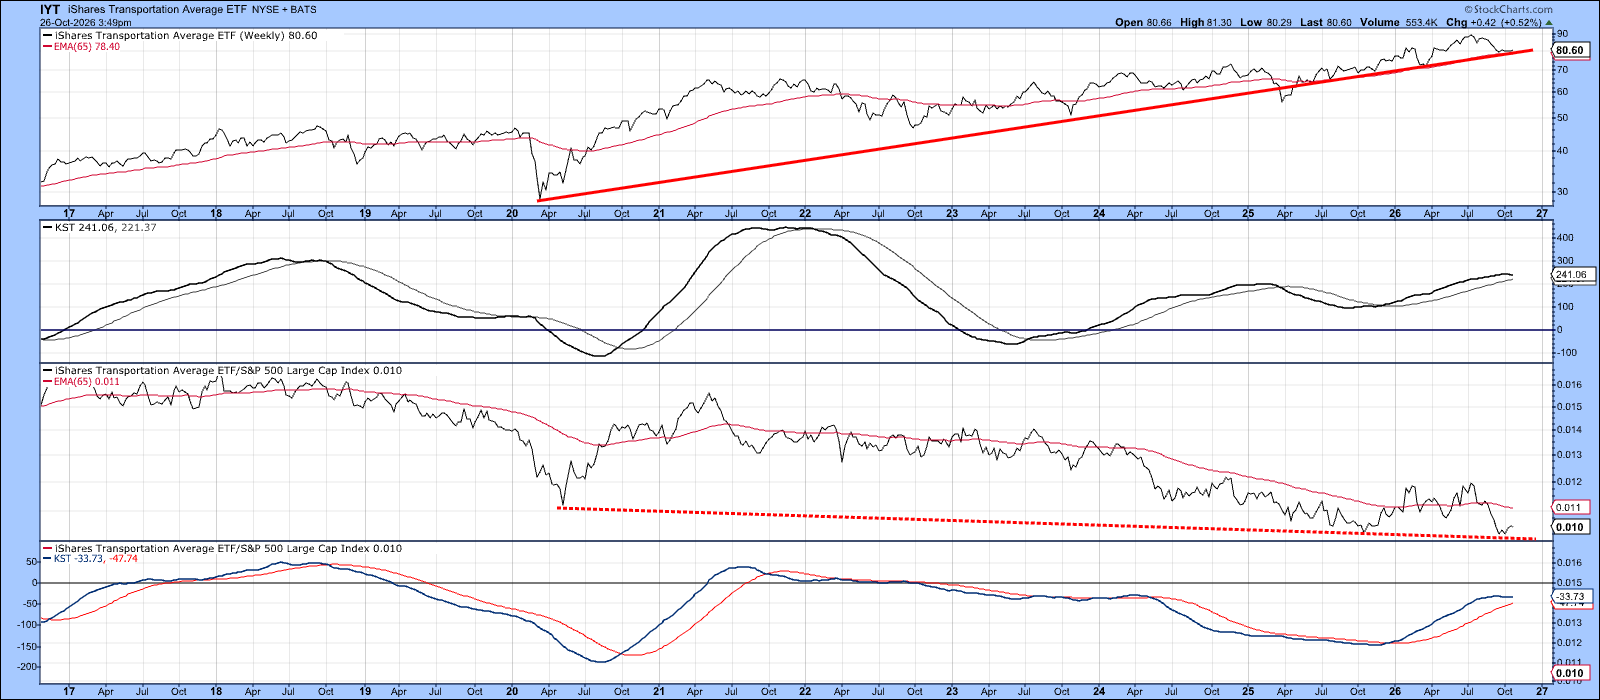
Transportation stocks have performed well in absolute terms since 2020 but have lagged the broader market on a relative basis for much of the last decade. Nonetheless, both the price of the iShares Transportation Average ETF (IYT) and its relative strength line have recently fallen to important long-term trendline support, with the ETF also finding support at its 12‑month moving average. Because these key technical benchmarks are holding and the long-term KST remains in a rising trend, the evidence continues to favor an intact bull market.
A Key Inter-Asset Relationship
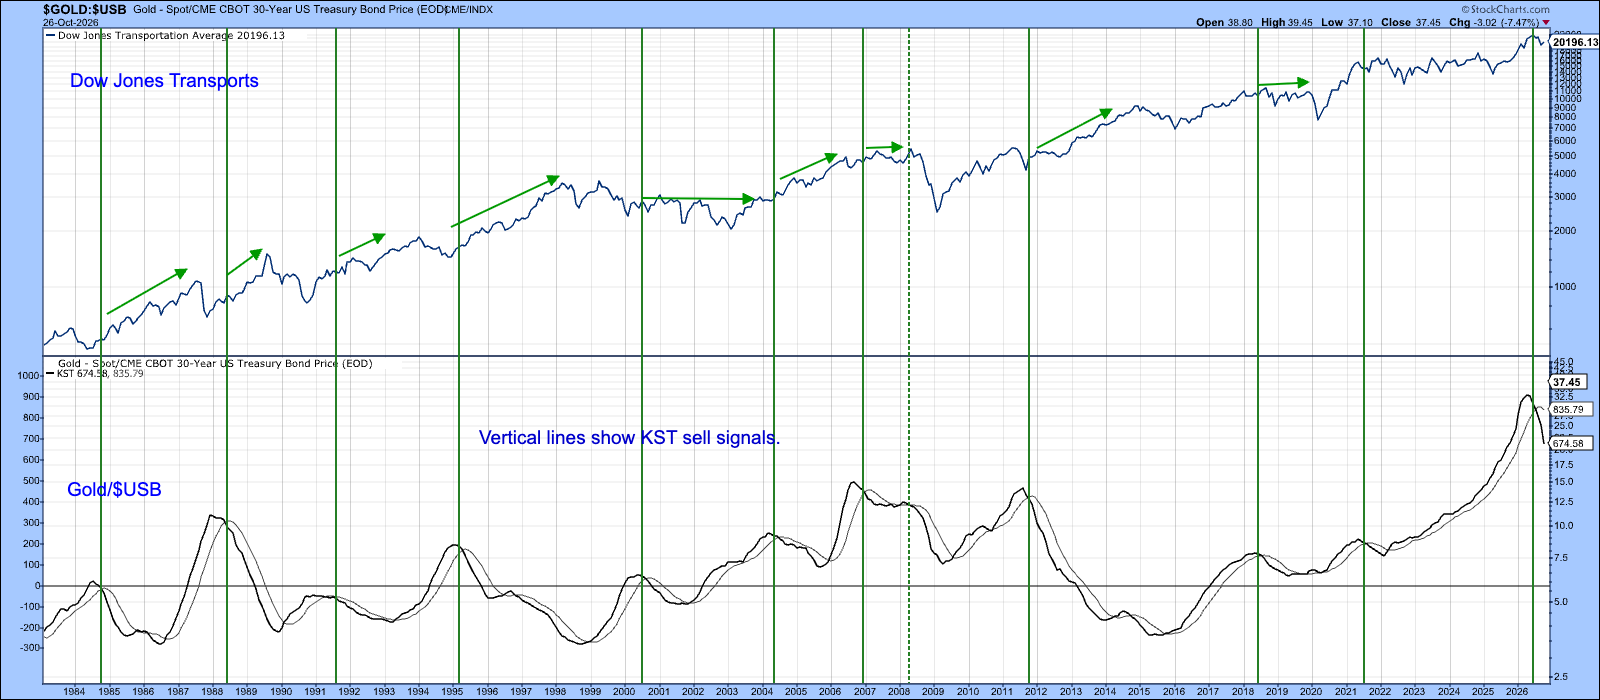
Chart 2 compares the Dow Jones Transportation Average with a long-term Know Sure Thing (KST) calculated from the Gold/Bond ($GOLD:$USB) ratio. At first glance, the connection between this ratio and transportation stocks may not be obvious, but it can be viewed as a three-stage process.
First, gold begins to outperform bonds as investors anticipate rising inflation and bid up gold relative to fixed-income securities.
Second, as that inflation-discounting process matures, the momentum of the Gold/Bond ratio peaks and the KST begins to roll over.
Third, investors in transportation stocks recognize that the inflationary forces reflected in the ratio are likely to moderate over time, paving the way for a more disinflationary environment that has historically been favorable for the sector.
Transportation stocks tend to benefit when inflation pressures begin to recede because their earnings are particularly sensitive to fuel costs, interest rates, and other inflation-related expenses. Importantly, investors don’t wait for these improvements to appear in the economic data. Instead, they anticipate them, often accumulating transportation shares as the Gold/Bond ratio's momentum peaks and begins to reverse.
Historically, as indicated by the vertical lines, these momentum peaks have frequently coincided with the early stages of significant advances in transportation stocks, suggesting that the Gold/Bond KST serves as a useful guide to important turning points in the sector.
The Short-Term Technical Picture
Turning to the shorter-term technical picture, Charts 3 and 4 compare the transportation sector with two market breadth indicators. Both suggest that the group has become oversold. Chart 3 focuses on the Bullish Percentage Index (BPI), but because the underlying data are quite volatile, the indicator has been smoothed using a 30-day moving average. The vertical lines identify the points at which this smoothed measure first falls below its green oversold threshold. Since 2017, every such occurrence has been followed by a rally in transportation stocks, indicating that excessive pessimism has often created attractive buying opportunities.
While this track record is encouraging, the indicator has an important limitation: It signals the likelihood of a rebound but provides little guidance regarding its eventual size or duration. Some signals have preceded only modest recoveries, while others have marked the beginning of much more substantial advances. Consequently, the oversold condition suggests that downside risk may be limited and a rally is probable, but additional technical evidence is required to assess the likely strength and persistence of any forthcoming advance.
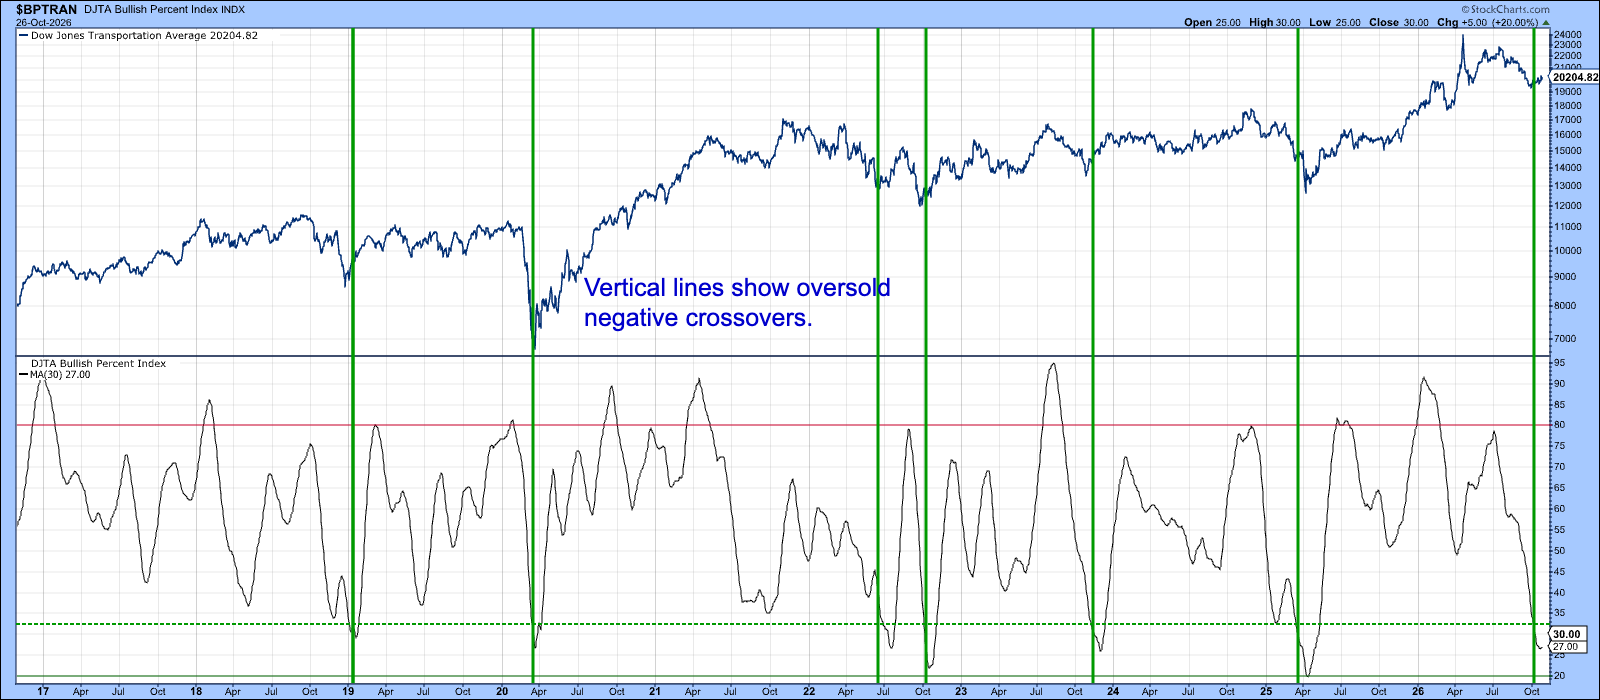
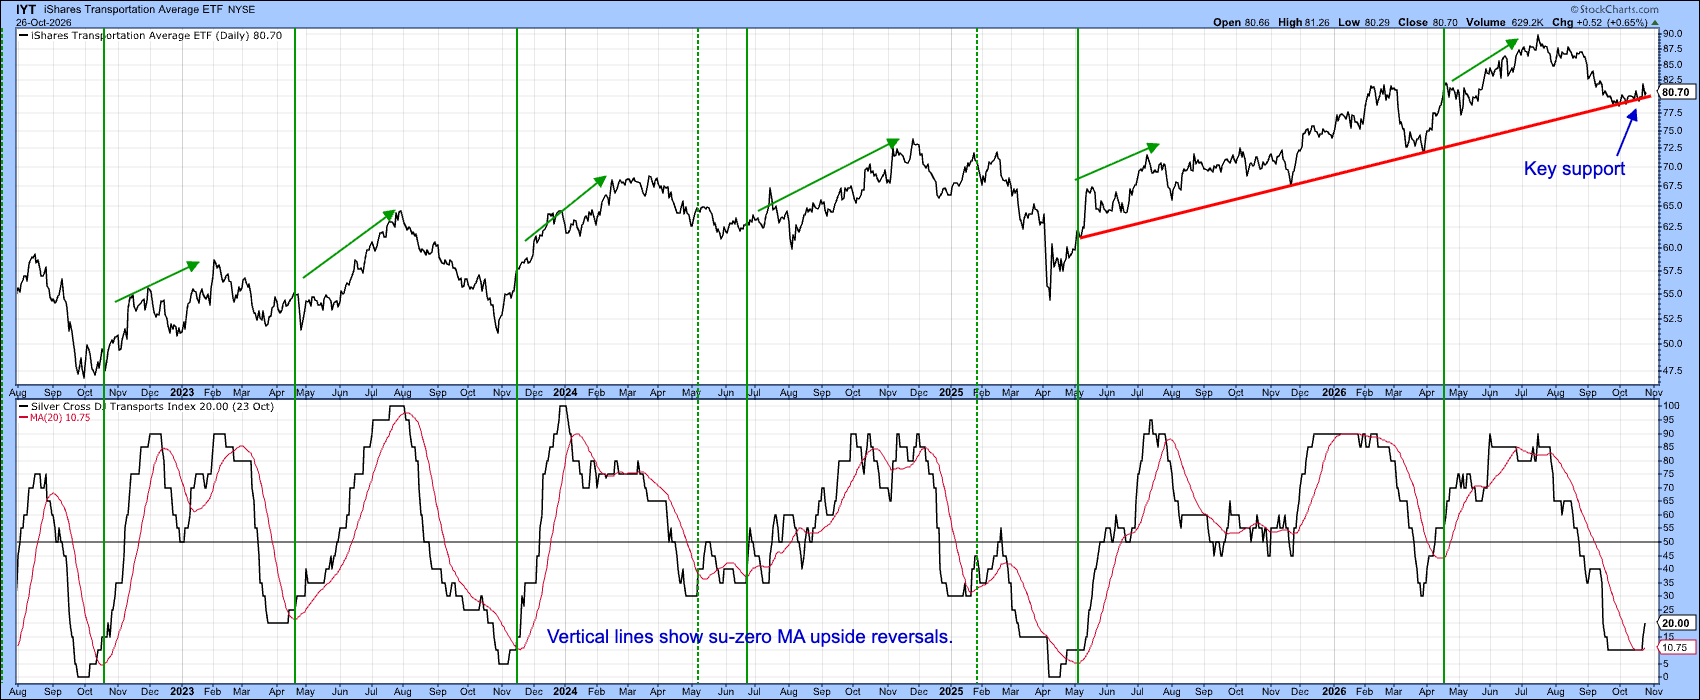
Chart 4 tracks the percentage of transportation stocks experiencing a positive silver cross, a technical condition that occurs when the 20-day moving average rises above the 50-day moving average. To improve signal reliability, the chart uses a red 10-day moving average of this breadth measure. The green vertical lines identify occasions when this smoothed indicator reverses upward from below its equilibrium level of 50, signaling an improvement in internal market strength. The solid lines denote signals that were subsequently validated by higher prices, while the dashed lines mark false positives that failed to generate a meaningful advance.
The message from the chart is that breadth within the transportation sector may be in the process of turning upward from an oversold condition. At the same time, the Dow Jones Transportation Average is resting on its rising 2025–2026 uptrend line, placing the sector at an important technical crossroads. This convergence of improving breadth and key price support suggests that the transports are approaching a "crunch time" moment, where a successful rebound could reinforce the existing bull trend, while a decisive breakdown would raise the risk of a more significant correction.
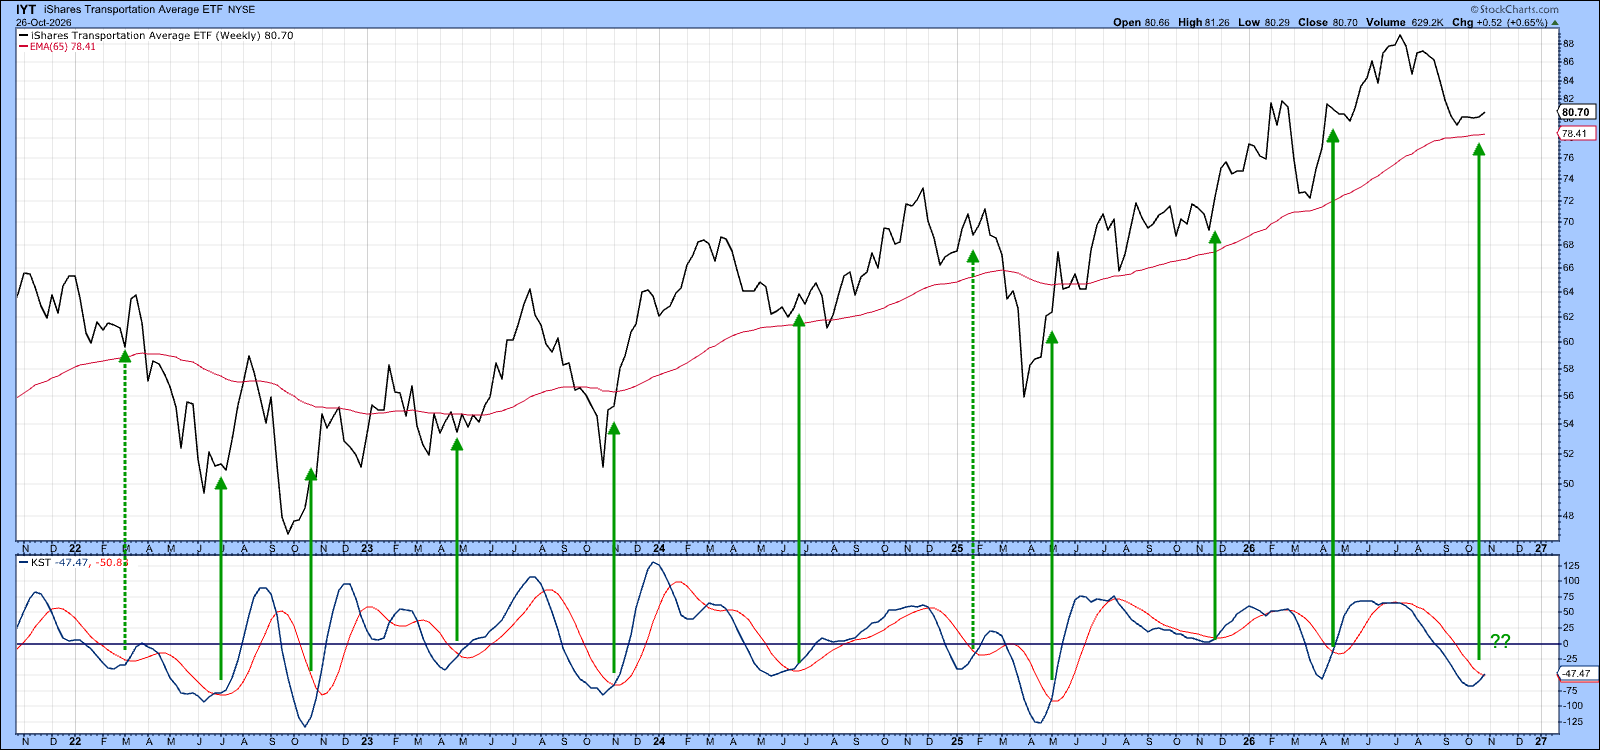
Finally, Chart 5 shows that the short-term KST has turned positive, indicating that near-term momentum has shifted in favor of the bulls. History suggests this is an encouraging development, as eight of the previous 10 positive KST signals were followed by at least a short-term rally. While no indicator is infallible and there's no guarantee that the current signal will prove successful, the historical record suggests that the odds favor some additional upside. At a minimum, the recent momentum reversal increases the likelihood of a rally that retests the spring high, even if a more significant advance has yet to be confirmed.
The Bottom Line
The long-term evidence continues to support the view that transportation stocks remain in a primary bull market. The iShares Transportation ETF (IYT) is still holding above important long-term trend gauges. In addition, the recent reversal in the Gold/Bond ratio's long-term KST suggests the market may have reached the stage of the cycle where investors start to look beyond current economic concerns and start discounting improved conditions ahead.
From a tactical perspective, the recent weakness has pushed transportation stocks into an oversold condition while they continue to rest on important support levels. In a primary bull market, such periods of excessive pessimism often create attractive buying opportunities rather than signaling the start of a major decline. Whether support holds and leads to a renewed advance should become apparent soon, making this a true "crunch time" period for the sector.
Good luck and good charting,
Martin J. Pring
The views expressed in this article are those of the author and do not necessarily reflect the position or opinion of Pring Turner Capital Group of Walnut Creek or its affiliates. The Six Stages of the Business Cycle are followed each month in Martin Pring’s Intermarket Review