The Stock Market Keeps Changing. Here’s How to Stay One Step Ahead.

Key Takeaways
- Prepare for changing stock market conditions by building a collection of stock scans.
- Use scans to identify strength in sectors and asset groups to follow the market's shifting leadership.
- Use the AI Scan Wizard, Screener, ChartLists, and alerts to find opportunities, save time, and make more informed investing decisions.
The stock market dances to a different tune every day. Some days, it moves higher at the leisurely pace of a foxtrot. Other days, it drops as quickly as a samba beat. And just when you think you’ve figured out the rhythm, the market changes the music.
That’s what makes trading and investing challenging and interesting. You never know what the market will do next. But as a self-directed investor or trader, you can be better prepared by having different trading setups ready for different market conditions.
When volatility picks up, you may want to focus on stocks showing strong momentum. When the market settles into a steady trend, trend-following strategies may offer better opportunities. And when money starts rotating from one sector to another, you want to recognize that shift early enough to take advantage of it. Then there’s earnings season, which always brings a few surprises.
The challenge is that each change in market direction can call for a different approach. You may need to adjust your strategy, explore another sector, or look at a different asset group.
Making frequent changes can become stressful, especially when the market changes direction without warning. But if you build a collection of scans designed for different market conditions, the process becomes less cumbersome.
Scans For Different Occasions
Think of building a scan collection as diversifying your trading toolbox. Instead of relying on one scan to uncover every opportunity, create several that serve different purposes.
A momentum scan can help you find stocks making strong moves during volatile periods. A trend-following scan can identify stocks moving steadily higher. A pullback scan can find stocks that may be ready to resume an uptrend. And when small-cap stocks start outperforming, you’ll have a scan ready to find those with upside potential.
What’s the Stock Market Whispering?
Let’s start with the daily chart of the S&P 500 ($SPX). Since August, the index has traded in a range. This week’s three consecutive white candles, along with a close above the 20-day simple moving average (SMA), appear bullish. But Thursday’s pullback reminded us that the bulls may not have full control. The index held on to the 50-day SMA support.
A similar pattern developed in late July and early August, but the candlestick bodies were much larger, which suggests stronger buying pressure. The rally stalled, and the index worked its way to a high before settling into the sideways movement we’ve seen since then.
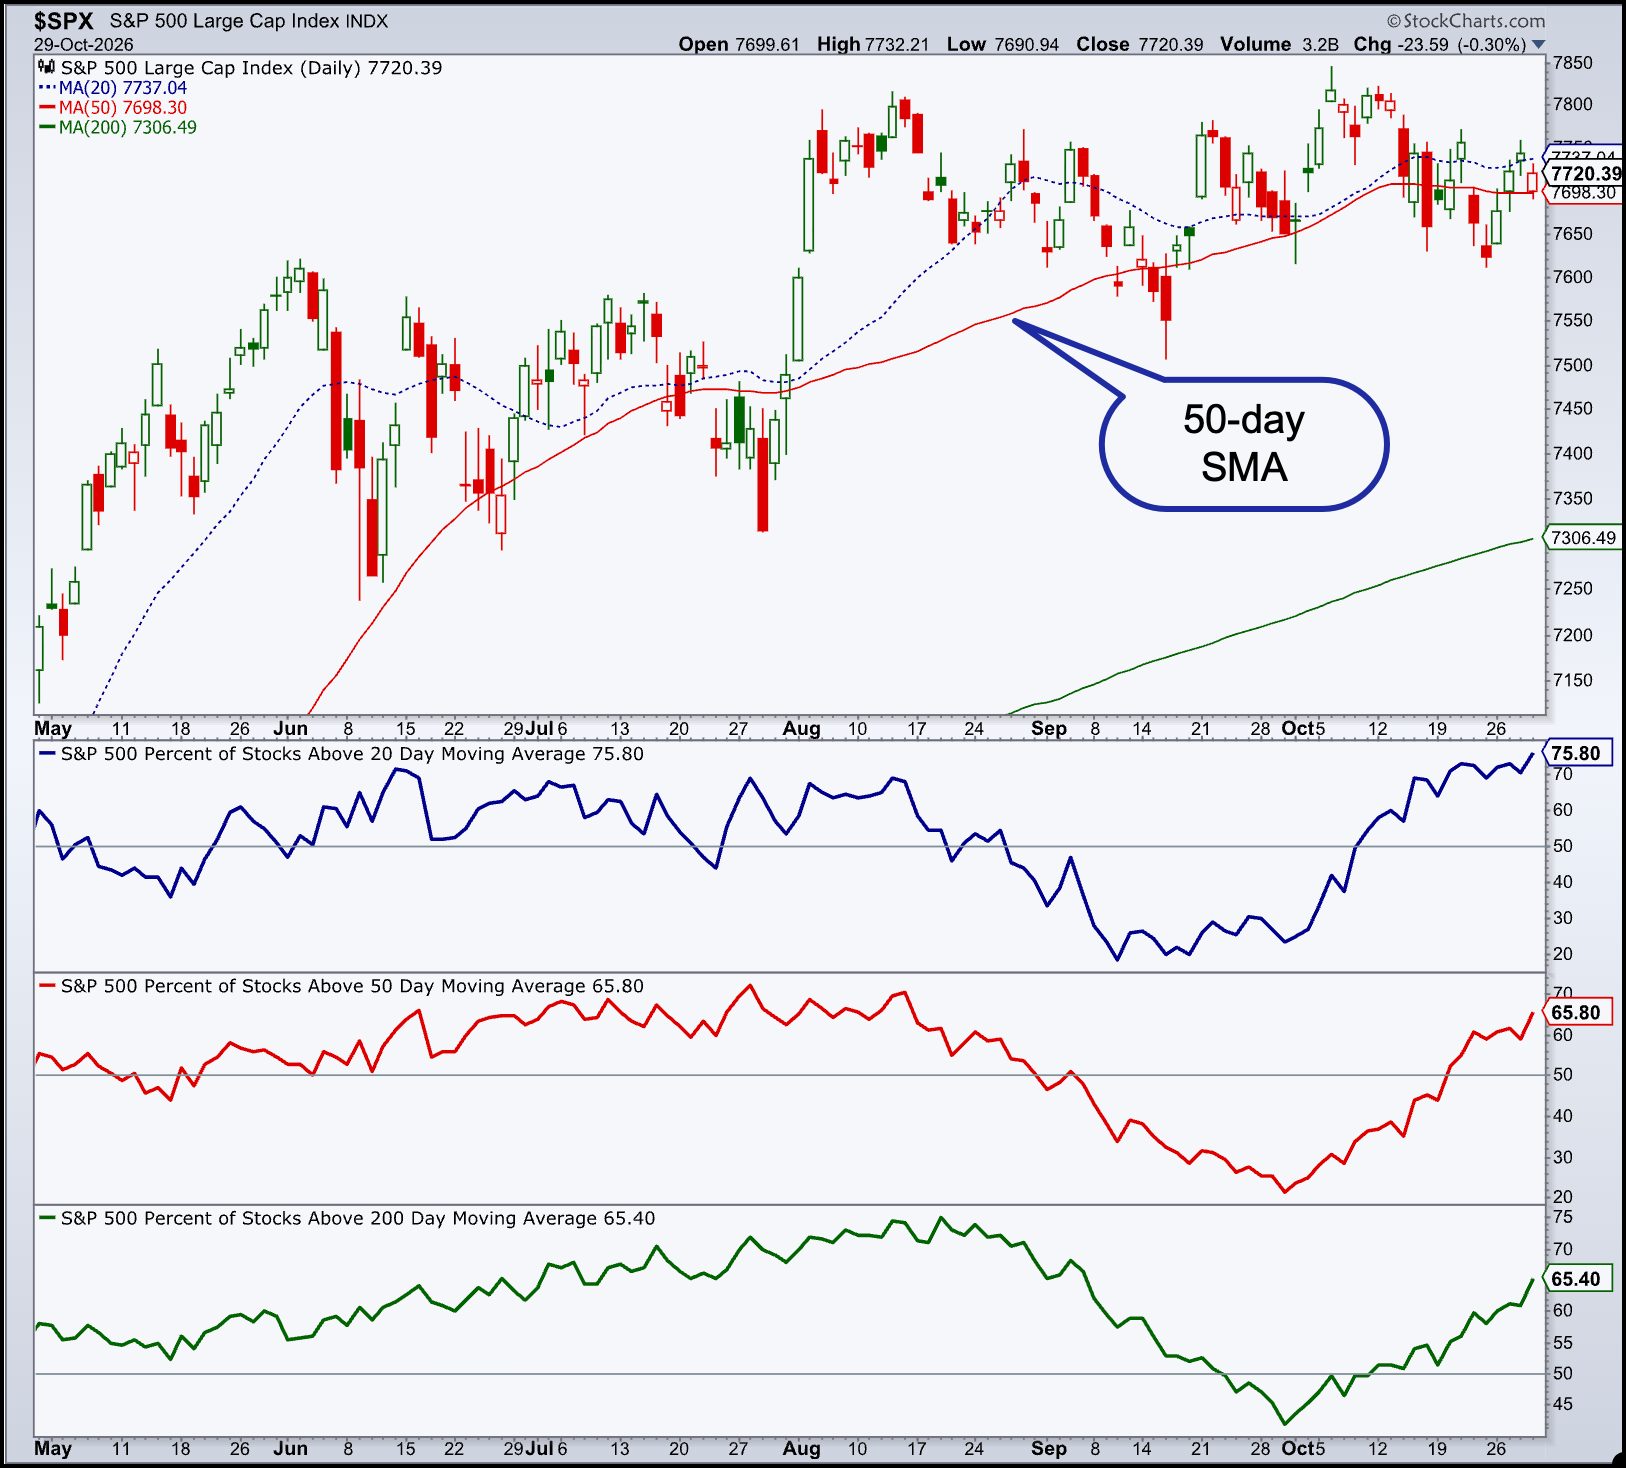
This time, the candlestick bodies are smaller, suggesting buyers may not be as enthusiastic. This makes me cautious about the potential for a sustained advance, although, if I see a break above the descending channel with upside follow-through, my outlook may change.
Market breadth adds another perspective. Since late September, the percentage of S&P 500 stocks trading above the 20-, 50-, and 200-day moving averages has been trending higher. That’s encouraging because it means more stocks are participating, and broader participation while the S&P 500 is stalling means other asset groups are gaining ground.
Will this trend continue or will it stall? Nobody knows, which is why preparation matters. Instead of trying to predict the market’s next move, you can have scans ready to identify opportunities.
Follow the Strength: Health Care Is Making a Move
One of the benefits of running scans regularly is that they can reveal changes in market leadership before those changes become obvious.
On Thursday Health Care and Real Estate were the leading sectors, whereas Technology and Communication Services were the laggards.
The chart of the Health Care Select Sector ETF (XLV) shows the ETF has broken above its August high and moved to new highs, something the S&P 500 is still struggling to accomplish.
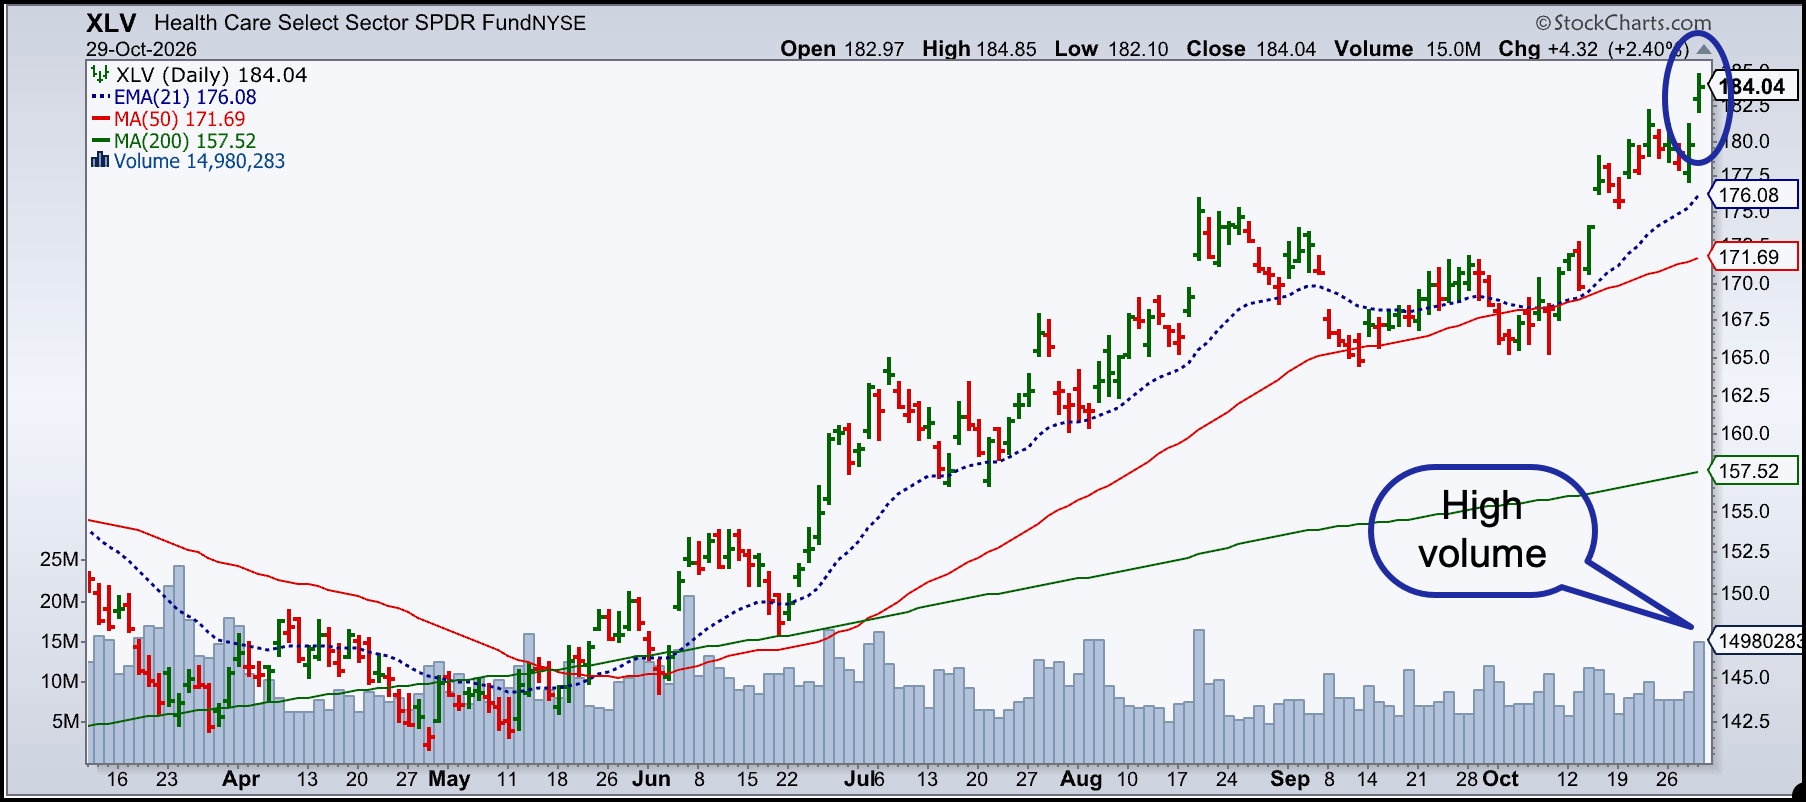
This price action helps explain something I’ve noticed in my scans. Several of the bullish scans I run after the close have been turning up Health Care stocks. AbbVie (ABBV), Abbott Laboratories (ABT), Eli Lilly (LLY), Gilead Sciences (GLD) are a few examples.
When stocks from the same sector repeatedly appear in your scan results, it’s telling you that money is flowing into that area of the market. This gives you an indication that strength is building in that sector.
If you already own Health Care stocks, you may want to maintain or increase your exposure. If you don’t own stocks in this asset group, it may be something to consider.
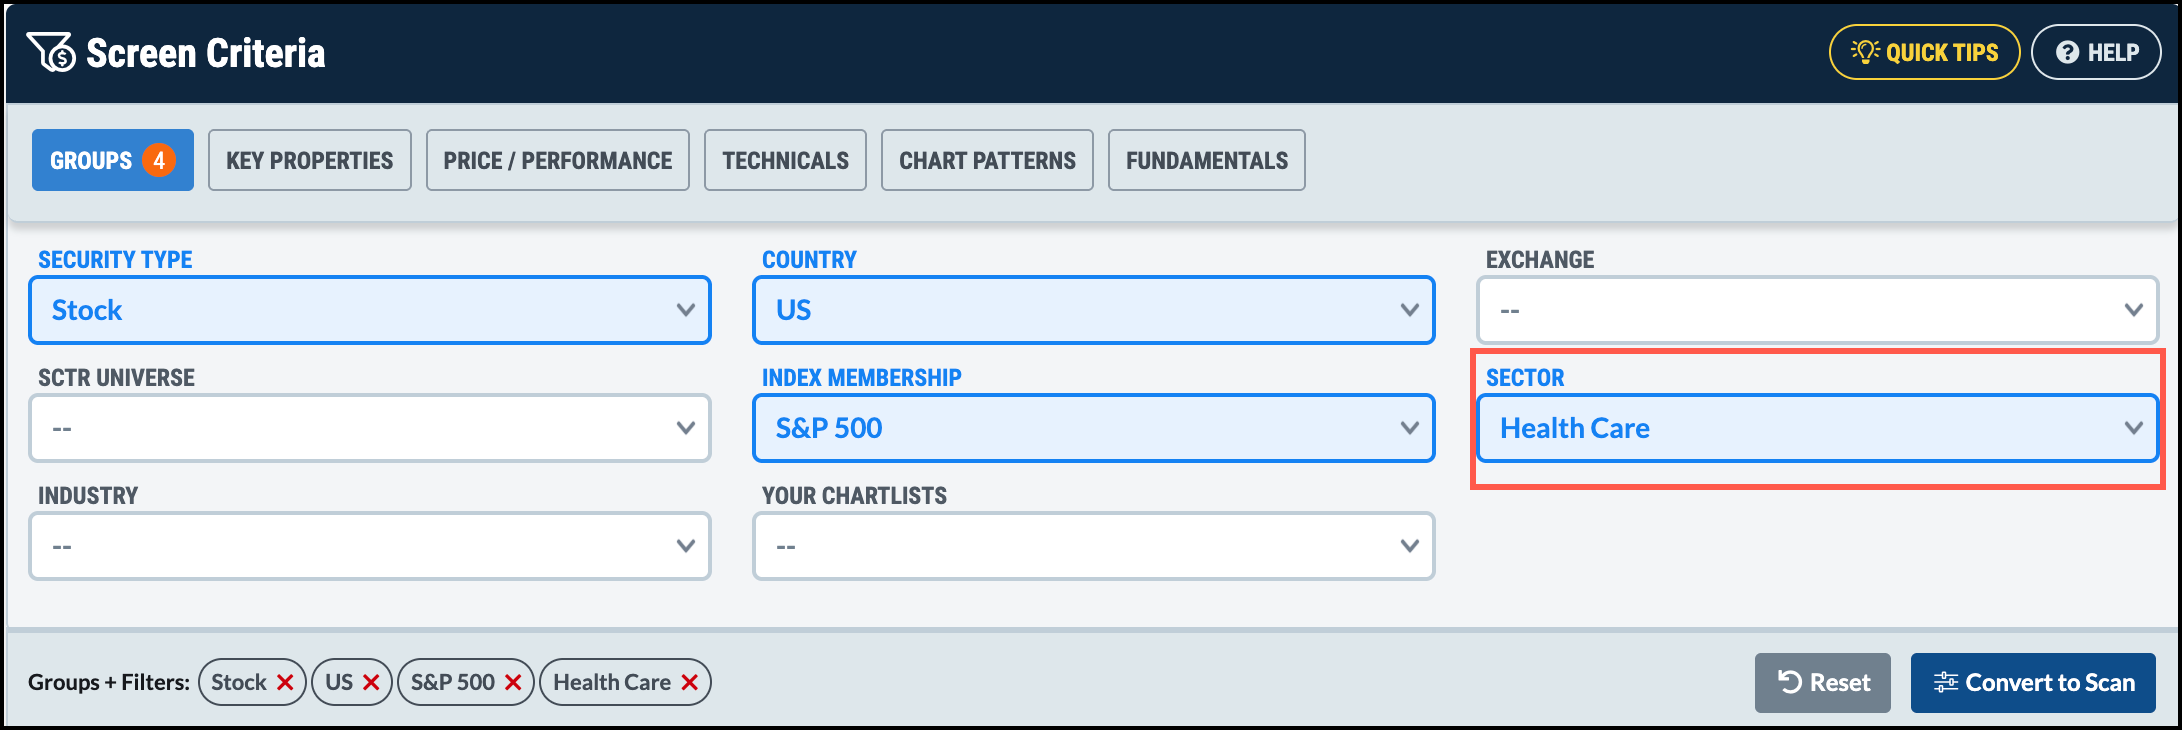
The StockCharts Screener and scanning tools let you filter stocks by sector and industry group.
Small-Cap Stocks Gain Ground
If you regularly check your Dashboard, you would have noticed the S&P 600 Small-Cap Index ($SML) gaining strength. If your portfolio includes small-cap stocks, you may be benefiting from the move. If not, this could be a good time to start looking for small-cap stocks that are establishing healthy uptrends.
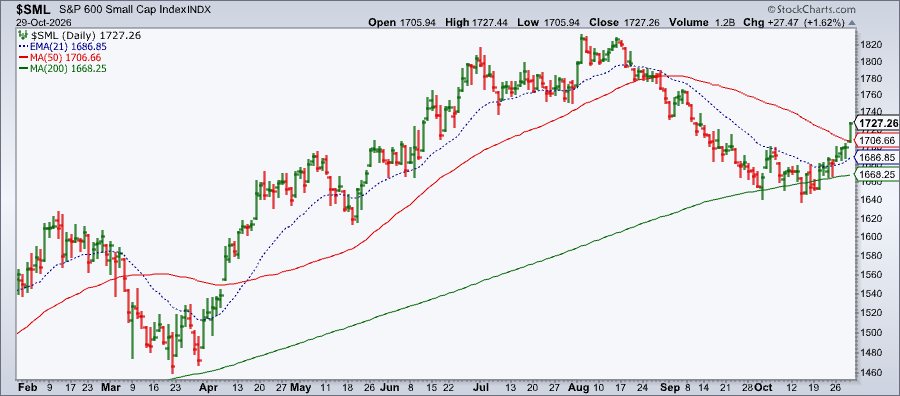
Instead of going through hundreds of small-cap charts, why not create a scan that does the leg work?
This is where the StockCharts AI Scan Wizard can save you time.
Build a Small-Cap Scan
Head over to the Advanced Scan Workbench in the Scans & Alerts tab.
Click the AI Wizard on the top right of the right-hand panel. Then ask it to find small-cap stocks with a market cap greater than $1 billion that are trading above their 21-day EMA, 50-day and 200-day SMAs with an RSI > 50.
These conditions narrow your search to small-cap stocks showing positive price momentum and trading above several important moving averages.
The AI Scan Wizard will generate the scan for you. You can refine the results by asking it to add, remove, or change conditions. There’s no need to rewrite the scan yourself.
Once you’re happy with your scan criteria, click the Apply button to copy the code into the Scan Criteria panel. Save the scan, run it, and save the results in a ChartList. You don’t have to rebuild this scan the next time small-cap stocks show strength.
You’ve now added another useful scan to your trading toolbox.
Here’s the scan the AI Scan Wizard created for me.
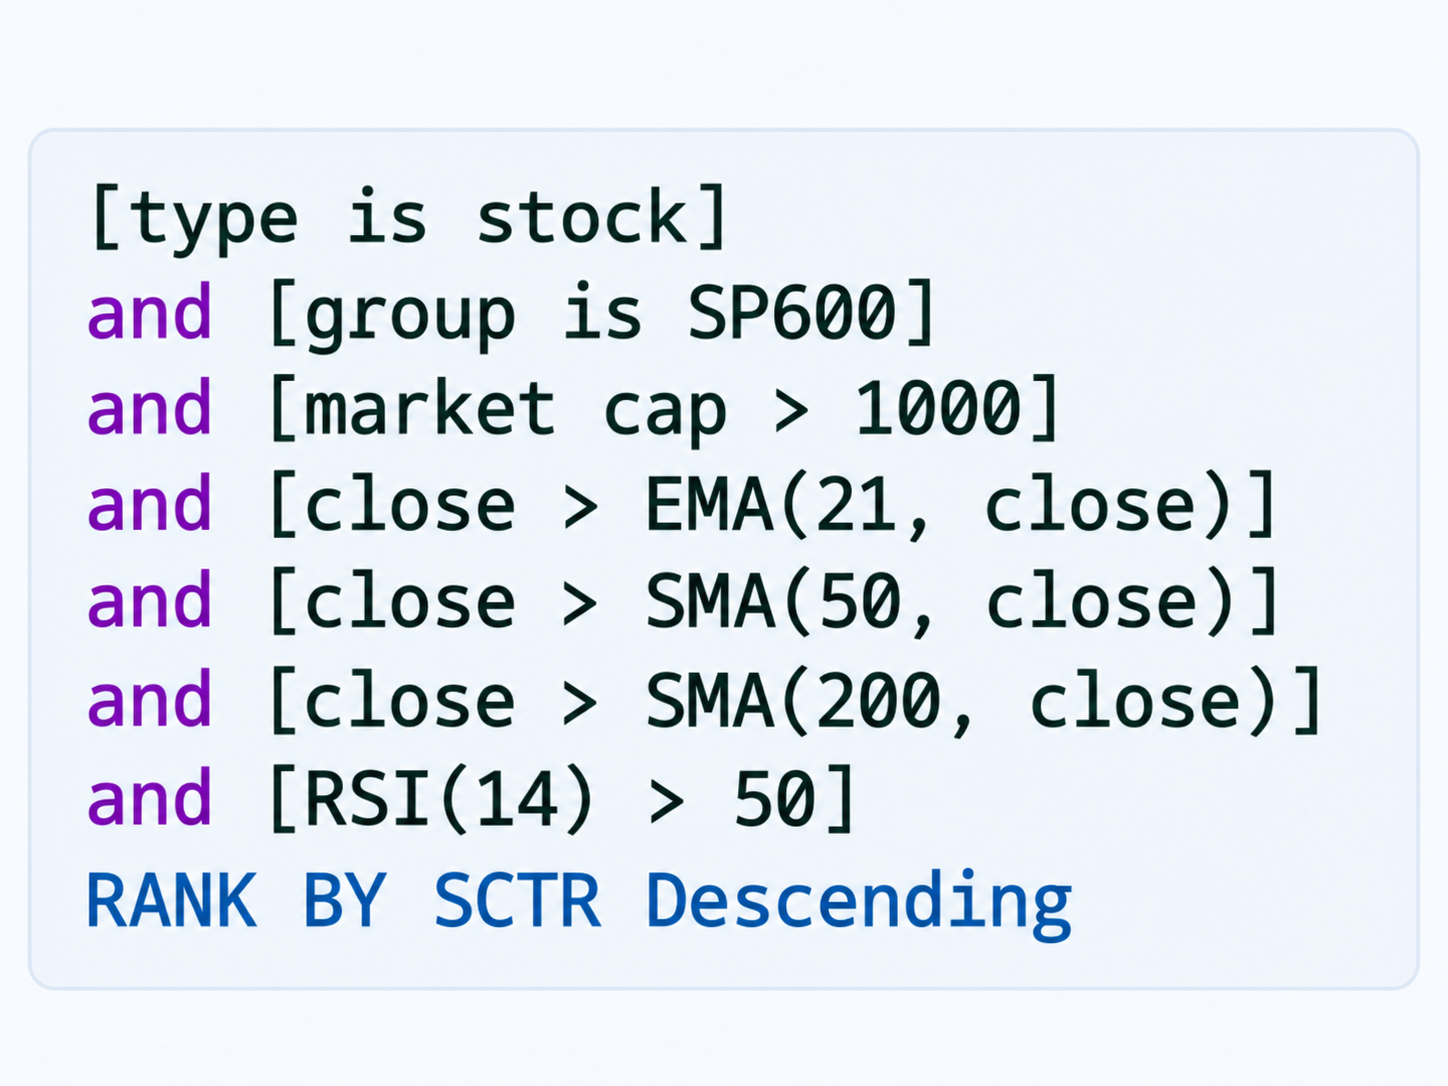
The final line ranks the results by their StockCharts Technical Rank (SCTR) scores. This will help you identify the technically strong stocks.
Start Your Scan Collection
Having a well-rounded collection of scans for different market conditions makes managing your portfolio more systematic.
I have scans that look for stocks with rising SCTR scores, stocks in bullish and bearish trends, and stocks that are oversold or overbought. Each of these scans work in different conditions.
Think about the situations you are confronted with when it comes to your investments. Do you look for pullbacks in uptrends, breakouts from consolidation patterns, or sectors that are outperforming the broader market?
All you need is a handful of thoughtfully designed scans to help you identify trading of investment opportunities without having to manually search through charts.
Fortunately, the StockCharts Screener and the AI Scan Wizard make building scans much simpler. Once you’ve created and saved your scans, you can run them manually or schedule them to run automatically. Save the results in ChartLists, review the charts, and set alerts for important price levels or technical conditions.
If you find that fewer stocks are making it to the bullish scan list, momentum may be weakening. If you suddenly see stocks from a different sector dominating your scan results, leadership may be shifting.
The Bottom Line
Building a diversified scan collection helps you adapt to changing market conditions, identify emerging strengths or weaknesses, and manage your portfolio with confidence. So when the stock market changes its rhythm from a slow foxtrot to a fast-paced samba, you won’t have to scramble to find your next move. You’ll have the tools to keep up with the rhythm.
Make Your Scans Work Harder. Creating multiple scans, scheduling them to run automatically, and setting alerts are some of the valuable benefits available with the StockCharts Extra and Pro memberships. Take a moment to review your current membership and consider how additional scans, screens, and alerts could help you spot emerging opportunities and make objective decisions.
Disclaimer: This blog is for educational purposes only and should not be construed as financial advice. The ideas and strategies should never be used without first assessing your own personal and financial situation, or without consulting a financial professional.