Fed Tricks, AI Volatility Treats, and Tech Earnings: Can Microsoft and Alphabet Rebound?

Key Takeaways
- The Fed is expected to hold its policy rate ahead of the midterms, shifting investors' focus to a pivotal week of corporate earnings.
- Visa continues to climb toward a $460 technical target, while Microsoft faces key resistance near $550.
- Alphabet's bearish chart breakdown signals further downside risk, with $340–$345 emerging as a critical resistance zone.
Will the Fed deliver a Halloween Week trick for investors? Unlikely. The futures market prices in a near-certain hold come Wednesday at 2 p.m. ET, despite troubling September inflation data that hit earlier in the month.
There may be hawkish dissents, assuming a hold, potentially teeing up a December hike. Fed Chair Warsh might keep the afternoon presser short and sweet, too, not offering the media and market participants much insight into the presumed pre-election pause.
A Fed Snoozer, but the Bond Market Spins a Different Yarn
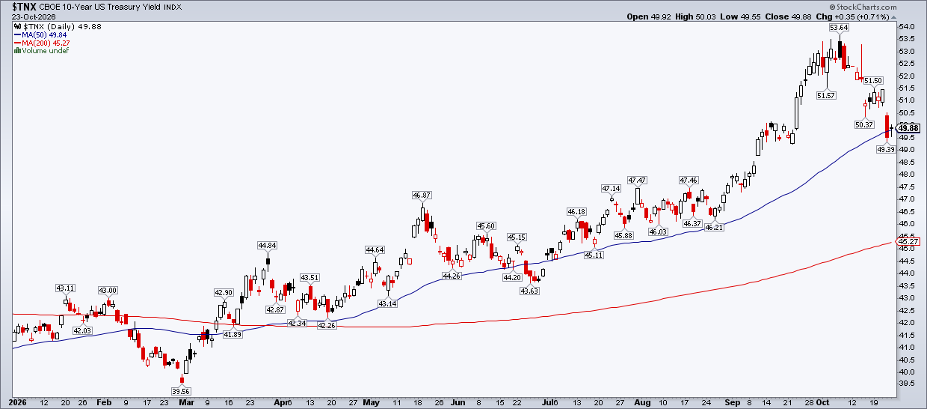
The charts have more to say. The yield on the benchmark 10-year Treasury note plunged from 5.364% on October 7 to briefly below 4.95% last Friday. Inflation data obviously matter, but traders appear more focused on developments with the AI trade and the megatrend's financing.
Neoclouds are seen as the possible canary in the coal mine, while credit default swaps on the largest hyperscalers have stair-stepped higher since midyear.
Many moving parts remain as the AI story plays out and the Fed outlines its path ahead. But investors have other things on their minds. The busiest week of Q3 earnings is upon us, and I have three names on my radar.
Visa Keeps Swiping Higher
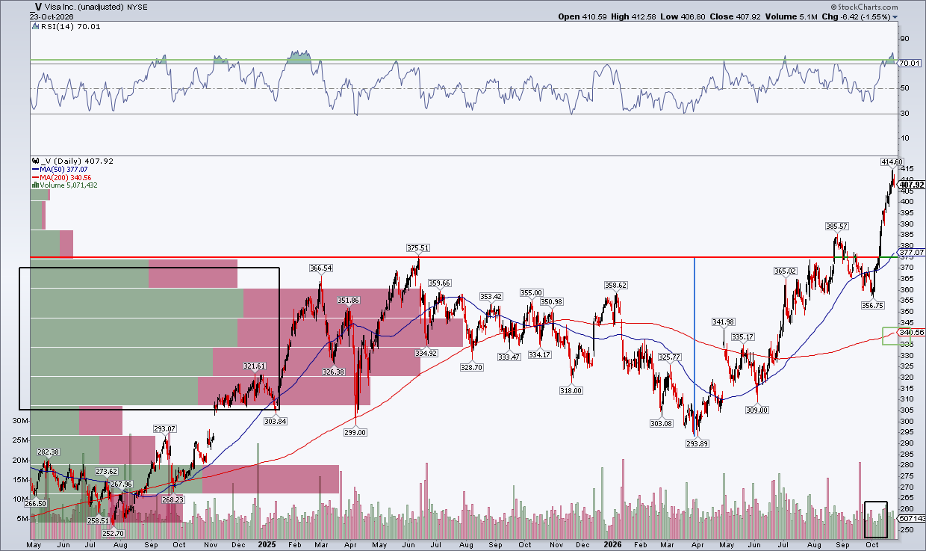
First up is a quick refresh. Earlier in October, I called out bullish action in two of the major credit card stocks. Visa (V) and Mastercard (MA) shot to record highs amid a flurry of concerning consumer headlines: stubbornly high gas prices, falling real wages, dismal UMich sentiment, and the latest hit coming from early reads on Halloween candy spending. Nevertheless, V has soared from $359 at its September settle to an all-time high of $414.60 tagged last Thursday.
A $460 price target remains in play, suggesting another 13% of upside. That could absolutely come by 2026's close, given typical bullish market-wide trends in the final 10 weeks of the year. In the here and now, the options market prices in a small 3% post-reporting swing this time around, according to the at-the-money straddle. You can view Visa's fundamental earnings information on the Symbol Summary page and options data within the OptionsPlay Strategy Center.
Visa reports Tuesday after the bell, and eyes then focus on a pair of Mag 7 stalwarts. Microsoft (MSFT) and Alphabet (GOOGL) serve up fiscal Q1 and Q3 reports, respectively, Wednesday AMC.
Microsoft: Are There Really Triple Tops?
What's the word on MSFT? Shares excelled since the midyear low but recently encountered a technical roadblock. Notice in the chart below that the stock put in a rare triple top near the $550 mark. Some traders assert that there are no "triple tops," suggesting that the third try should be a breakout, lest a major failure unfold.
I say we must respect price, and MSFT now finds itself under resistance and above support in the $484 to $492 range. It's a neutral look heading into the mid-week print.
Also look at the long-term 200-day moving average. It has inflected upward, boosting the case for an ultimate price breakout now that the bulls control the primary trend. The RSI momentum oscillator at the top of the SharpChart begs to differ; it reveals a bearish divergence amid the steep price ascent in the past four months.
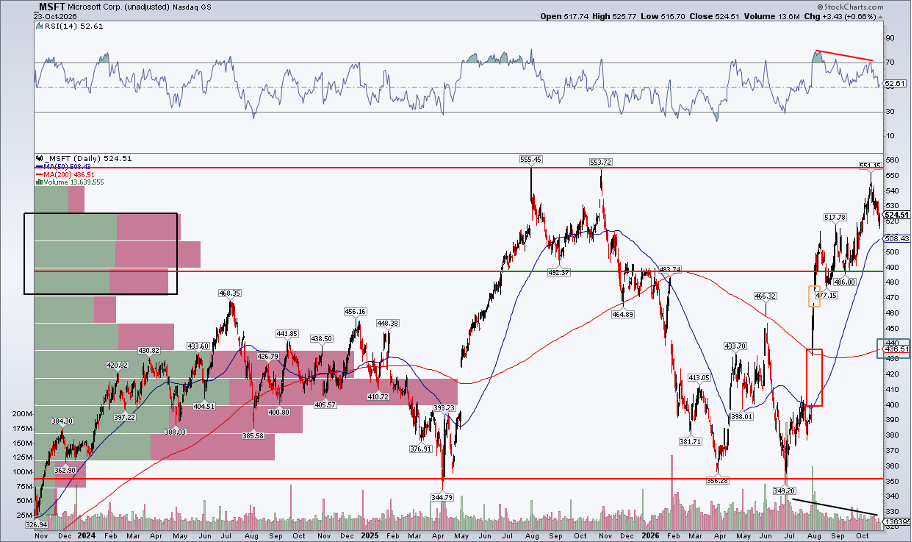
Options price in a 4.5% earnings-related move this week, so chances are that Mr. Softy will stay in its range. On the downside, traders must mind the gaps: the first at $465 back on August 3, the second at $391 before the Situational Awareness rally. Finally, volume has turned lower lately, which could mean another leg higher in the trend of larger degree (higher) is primed. Overall, wait for the breakout above $550.
Google's Ghastly Chart
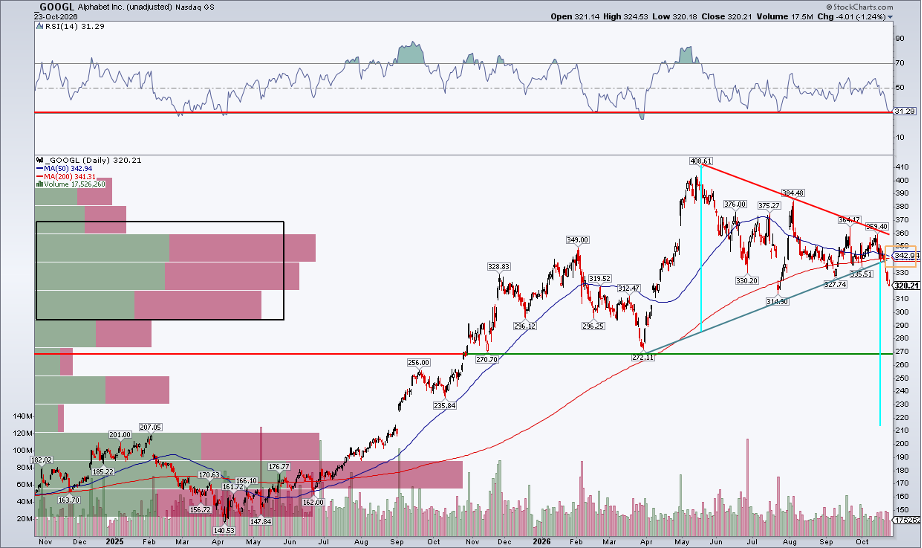
MSFT appears neutral, while GOOGL is searching for bulls. Jumping off the chart below is a bearish symmetrical triangle breakdown. The measured-move price objective, based on the pattern's height and subtracted from the breakdown level, is a downright spooky $210 or so. Before that, I do see some modest polarity close to $270, but even that would be a semi-haunting 15% decline from the current spot. The RSI gauge does the stock few favors, as it confirms the multi-week low in price, now near its most oversold since the March 31 S&P 500 low.
A bearish death cross is also likely on tap ahead of Halloween, with the 50-DMA crossing below the 200-DMA. Those trend-indicator lines are near the triangle's breakdown price, meaning there's a confluence of resistance in the $340–$345 zone. If shares pop to there following Wednesday evening's earnings, booking profits or cutting losses may be prudent.
The small saving grace is there's still a hearty number of shares traded (as measured by the volume-by-price profile on the left side of the chart) down to $296. Ultimately, the bulls want to see GOOGL reclaim $345 before getting aggressively long.
In short, I still like V, MSFT may be rangebound, and GOOGL is a bit ghoulish.
The Bottom Line
I suspect that this week's Fed decision, statement, and press conference will be uneventful. Two of the FOMC's troika have hinted at an October hold, and the Fed Funds futures market has taken that cue. So, all eyes are on earnings. There are winners and losers, with tech hobbling into its crucial stretch. Within the worst S&P 500 sector MTD, MSFT and GOOGL each have something to prove.
Disclaimer: This blog is for educational purposes only and should not be construed as financial advice. The ideas and strategies should never be used without first assessing your own personal and financial situation, or without consulting a financial professional.