Are Gulf Country ETFs Forecasting Another Round of Regional Conflict?

Before Russia invaded Ukraine, the Russian stock market had already been selling off for several months as investors discounted the potential consequences of military action. Chart 1 shows that, by the time the invasion took place, the Russia Stock Market Index ($MOEX) had already reached a significant low.
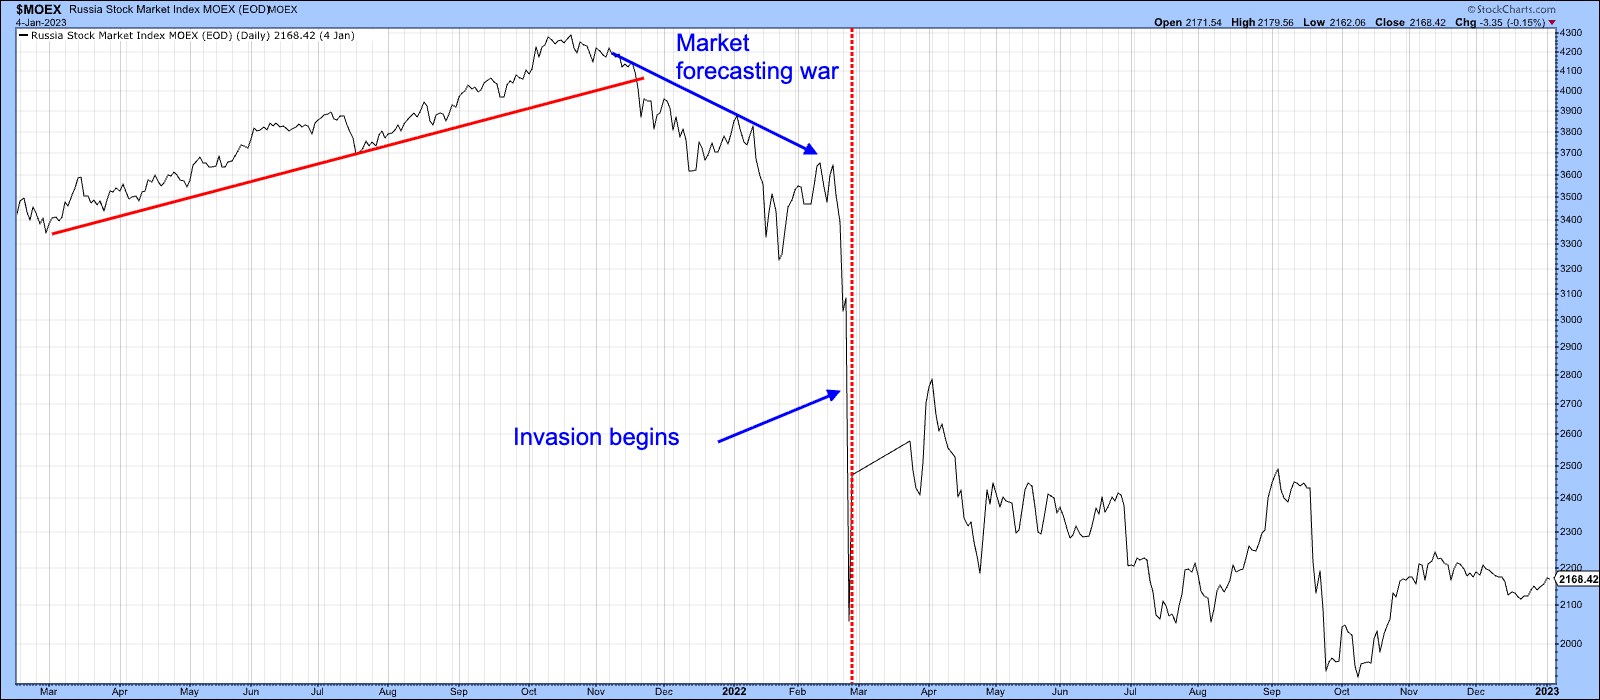
As we will see later, that discounting process didn't take place in the four GCC ETFs before the U.S. launched its war on Iran in late February. Over the last few weeks, however, some have begun to break down technically, while the remainder appear to be on the verge of following suit.
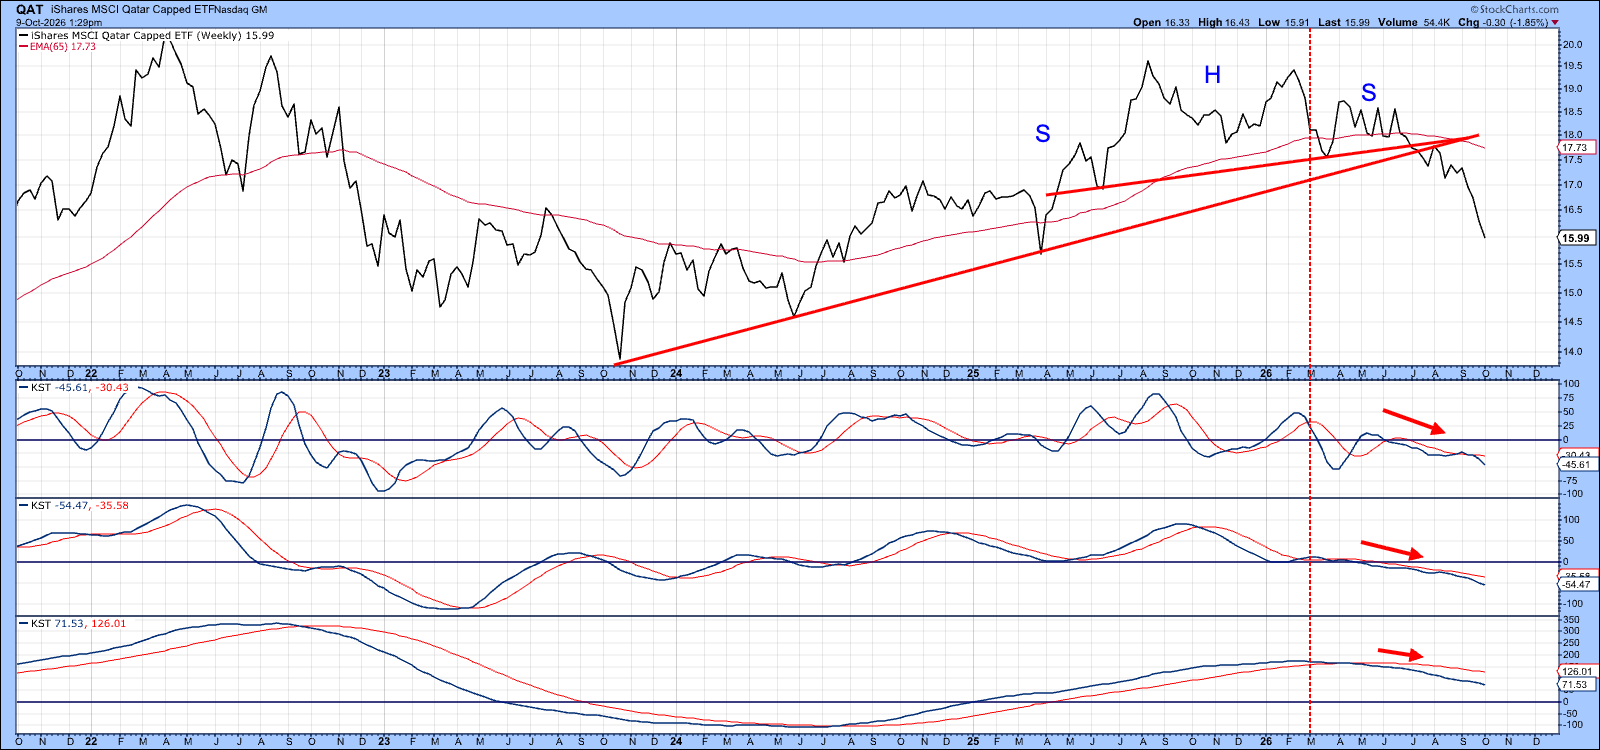
Chart 2, for example, shows that the iShares MSCI Qatar Capped ETF (QAT) has fallen sharply in recent weeks after violating a key uptrend line and completing a small top formation.
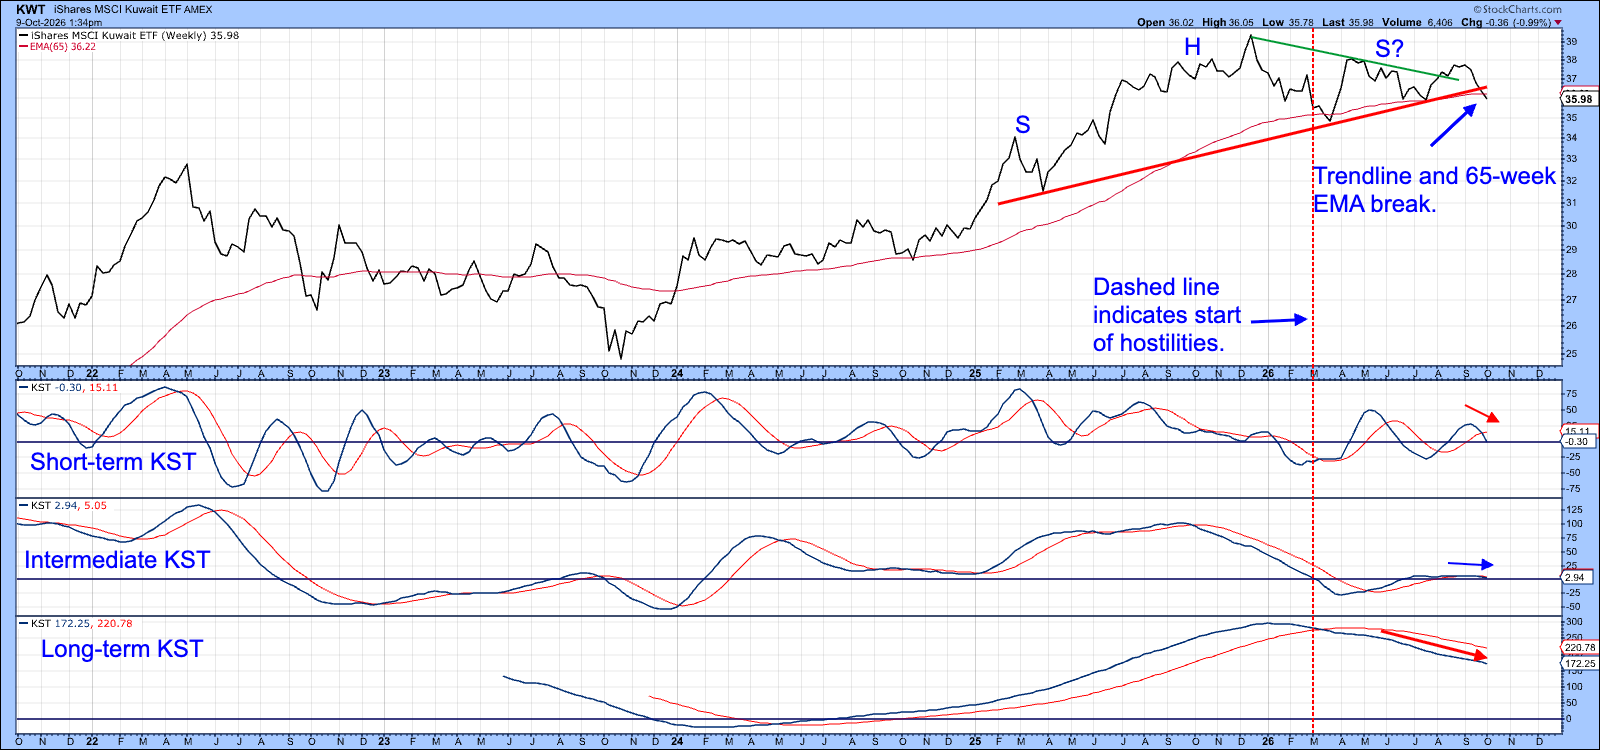
The iShares MSCI Kuwait ETF (KWT) recently experienced a false upside breakout that has since been confirmed by a violation of the neckline of an upward-sloping head-and-shoulders top. In addition, both the short- and long-term Know Sure Thing (KST) indicators are bearish, pointing to lower prices ahead. The chart appears particularly vulnerable because false breakouts are often followed by above-average moves in the opposite direction to the breakout.
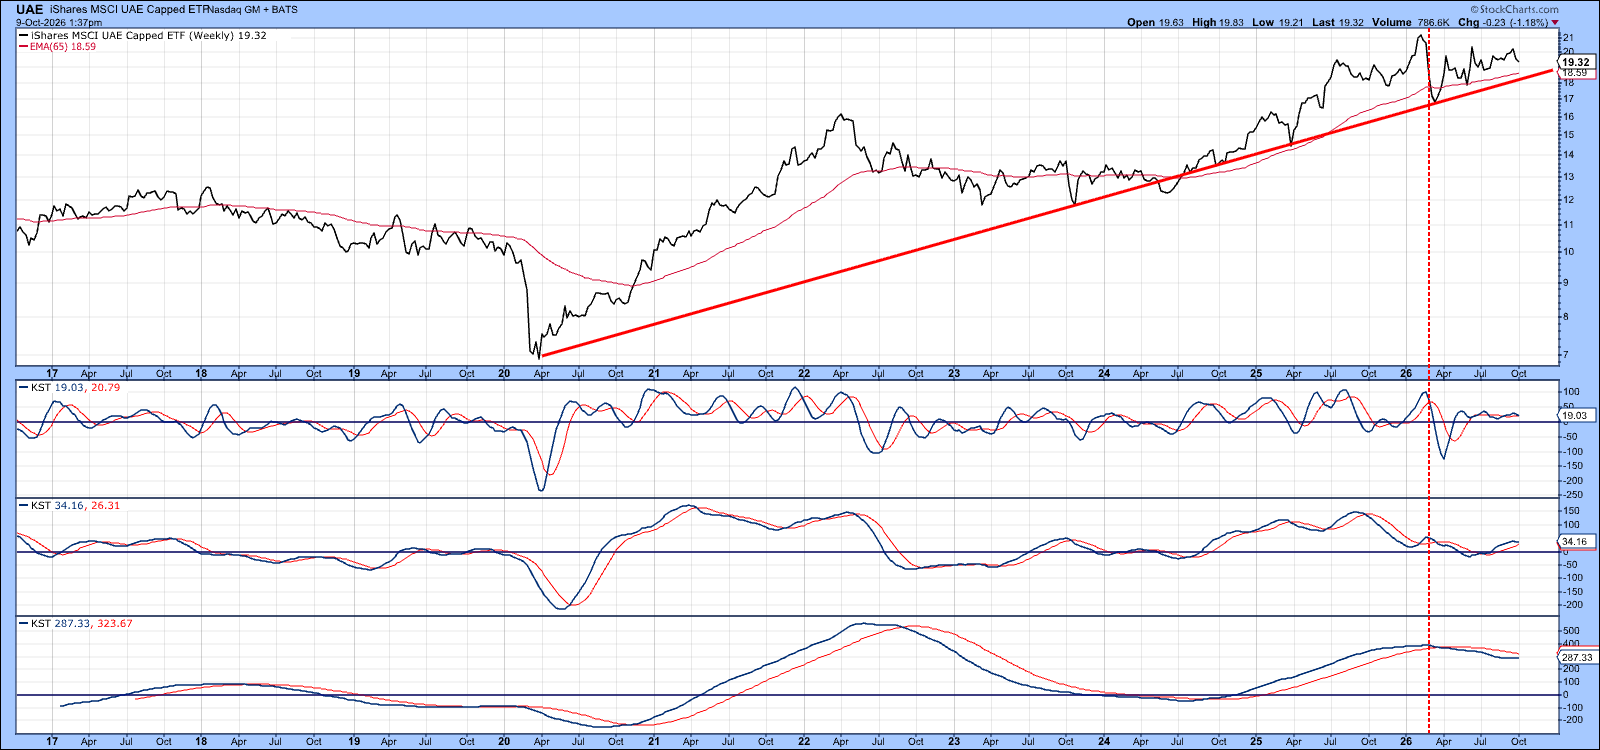
The iShares MSCI UAE Capped ETF (UAE) is the lone holdout among the GCC ETFs. The price remains above both its 65-week EMA and six-year uptrend line, a sign that the primary trend is still intact. Although the long-term KST in the bottom window has turned bearish, the signal is far from decisive. Consequently, as long as price remains above the EMA and uptrend line, currently just above $17.75 (basis Friday close), the weight of the evidence continues to favor the bulls.
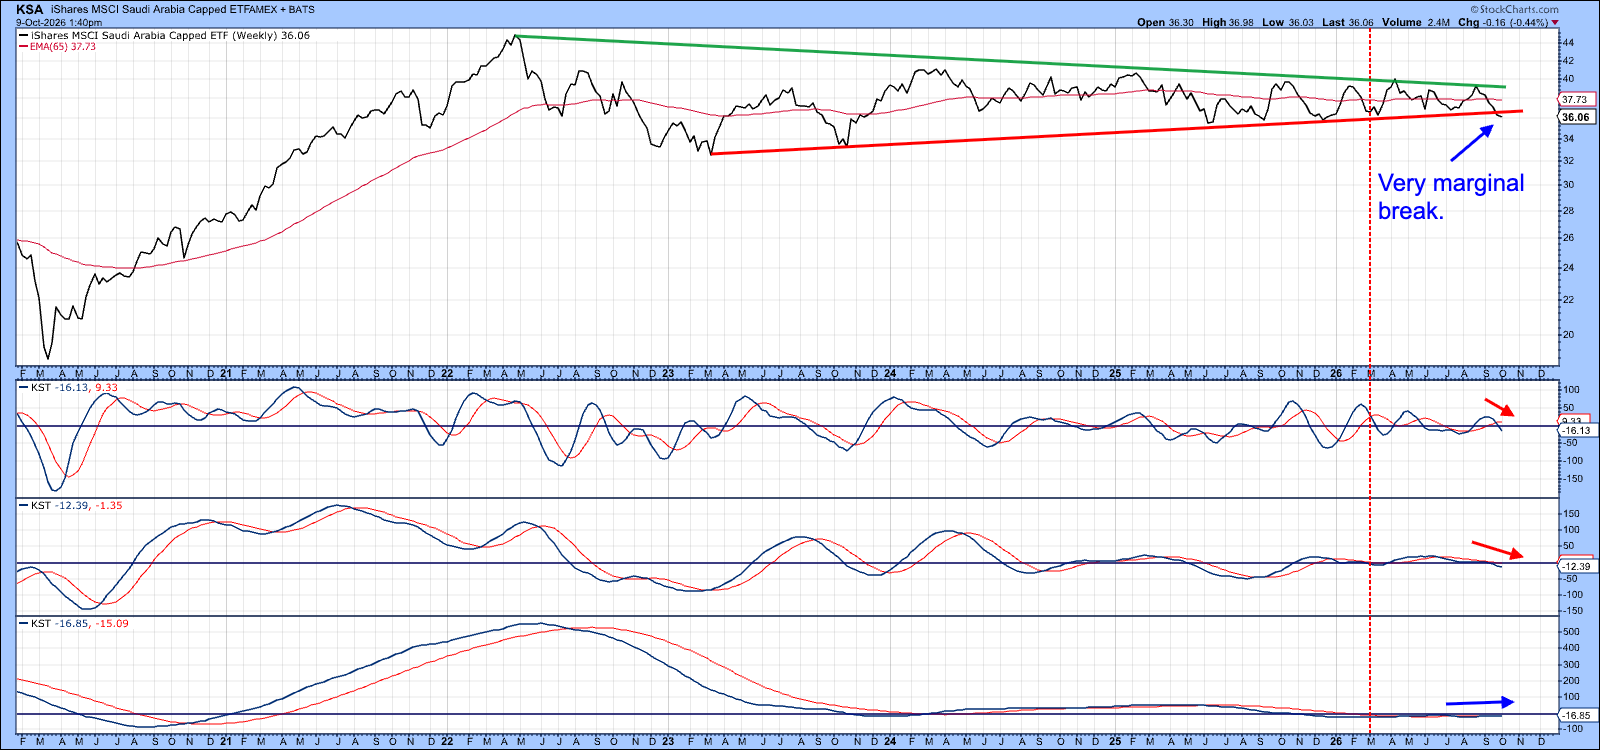
The iShares MSCI Saudi Arabia Capped ETF (KSA) has been declining for about a month and has only marginally violated its red support trendline. However, because the line has been rising at a gentle pace, the breakdown has yet to take out the series of reaction lows that has been in place since mid-2025. As a result, the technical damage remains limited. However, until the line is more decisively violated, there is insufficient evidence at this stage to conclude that prices are headed significantly lower.
GCC Relative Action is Weak
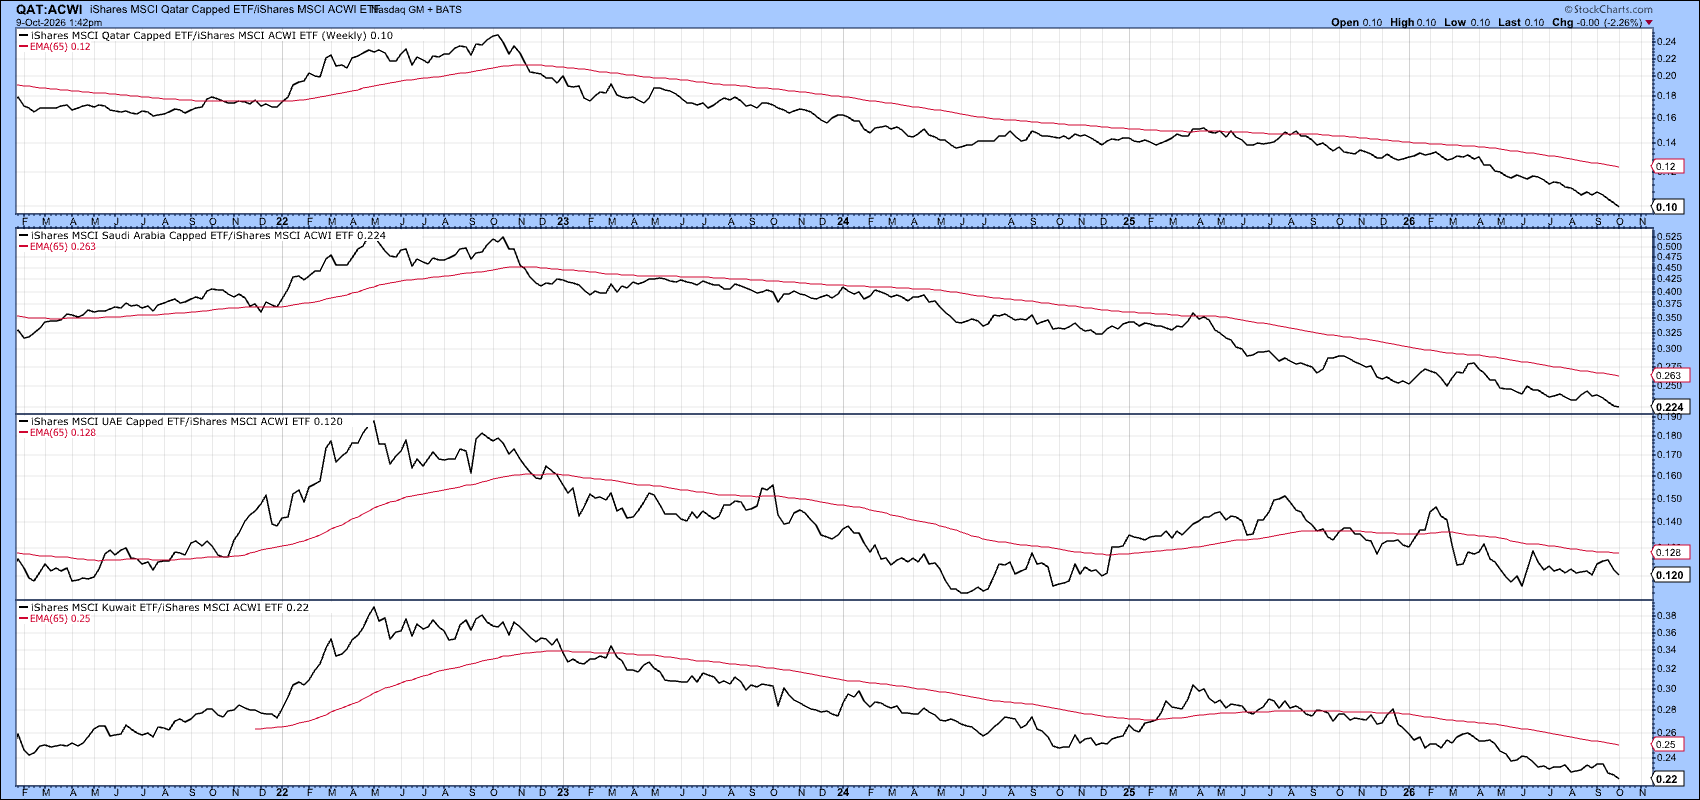
Finally, Chart 6 compares the performance of the four GCC country ETFs with that of the MSCI All Country World ETF (ACWI). All four relative strength lines are in long-term downtrends, indicating persistent underperformance versus global equities. In addition, each RS line is trading well below its 65-week EMA, offering little evidence that a meaningful turnaround is underway.
Israel Turning?
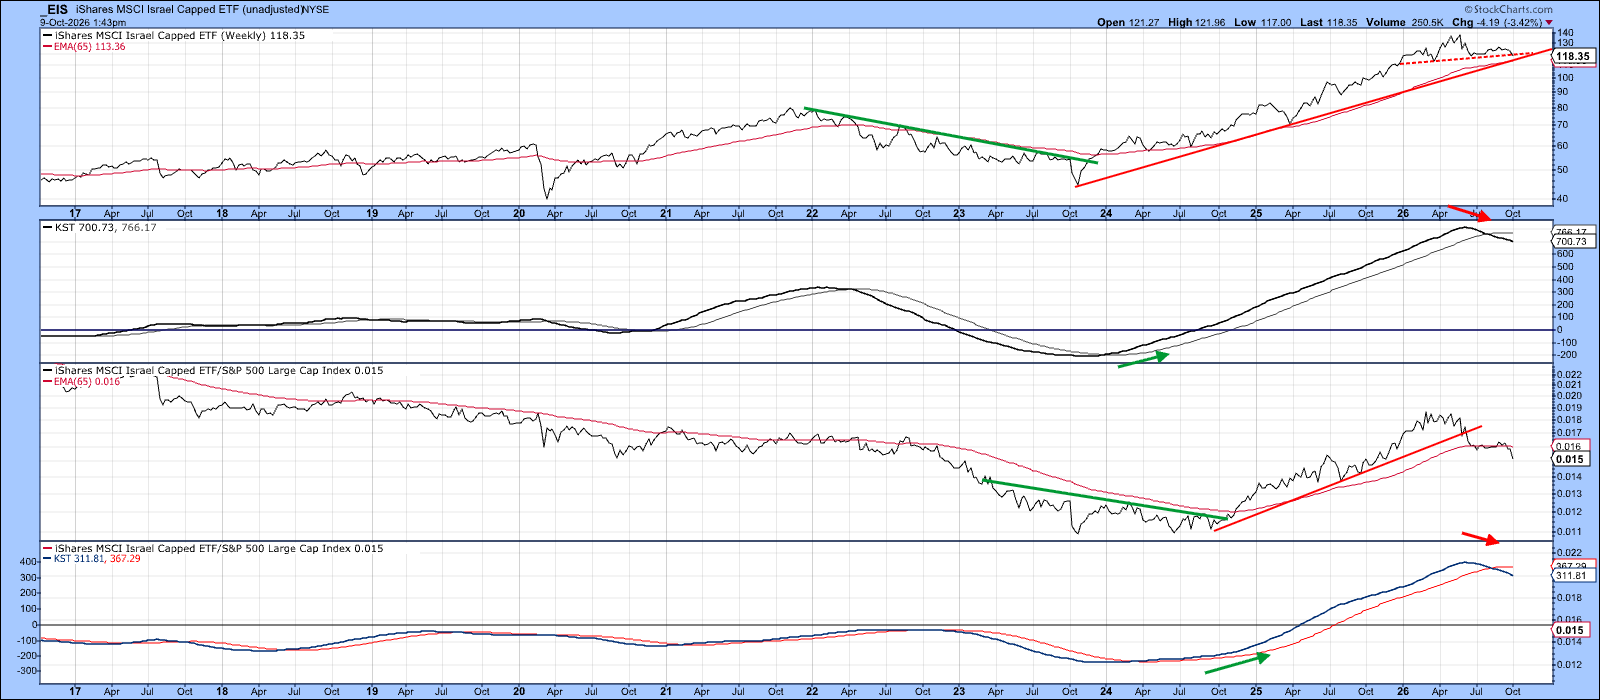
Even the one Middle Eastern ETF that has outperformed the ACWI over the last couple of years, the iShares MSCI Israel Capped ETF (EIS), has begun to show signs of technical deterioration. Its RS line, featured in the third window of Chart 7, has fallen below its 65-week EMA and triggered a long-term KST sell signal. The KST for the absolute price has also turned bearish.
That said, the price itself, which peaked shortly after the onset of the Iran war, has yet to break down. It remains above its 65-week EMA, a potential (dashed) head-and-shoulders neckline, and its post-2023 uptrend line. Given the possibility of an adverse election outcome and renewed regional hostilities, it will be interesting to see whether the ETF can continue to hold these key support levels.
The Bottom Line
The recent breakdowns in several GCC ETFs don’t automatically signal renewed warfare. They could just as easily reflect expectations for slower economic growth, weaker oil prices, or a broader shift away from risk assets. However, markets often discount important developments before they become widely recognized. That several GCC ETFs have begun to weaken simultaneously suggests investors may be reassessing the region's outlook. Whether this reassessment reflects economic concerns, geopolitical risks, or some combination of the two, the relative strength trends suggest investors can find more attractive opportunities elsewhere.
Good luck and good charting,
Martin J. Pring
The views expressed in this article are those of the author and do not necessarily reflect the position or opinion of Pring Turner Capital Group of Walnut Creek or its affiliates. The Six Stages of the Business Cycle are followed each month in Martin Pring’s Intermarket Review.