StockCharts Insider: Every Candlestick Scan in the Library, Ranked (and Why the Popular Ones May Fall Short)
Before We Dive In…
Candlestick charts have been around for centuries in Japan. But it wasn’t until 1989 that Steve Nison introduced them to the West. Since then, they’ve gone from obscure trading-desk jargon to viral social media content. But popular and profitable are two separate things. Some patterns break in the right direction but fizzle out. Others run strong after breaking out but they’re rarely seen. There’s no pattern that nails all three. So, which ones are worth your time and risk?
That’s what we’re going to investigate today. I took every candlestick pattern scan in the StockCharts Sample Scan Library and scored each on three things: how often it breaks in the right direction, whether it tends to follow through, and how often the pattern occurs.
What Source am I Using for the Stats?
Credit where credit’s due: the numbers come from Thomas Bulkowski, whose two books Encyclopedia of Chart Patterns and Encyclopedia of Candlestick Charts are the closest you’ll get to a reference standard. Stats shift over time due to macro changes in market behavior and big picture economic conditions. So, use these well-tested studies as suggestions and not hard rules. If you have another source you trust, check it against the one I used.
How to Read the Scores
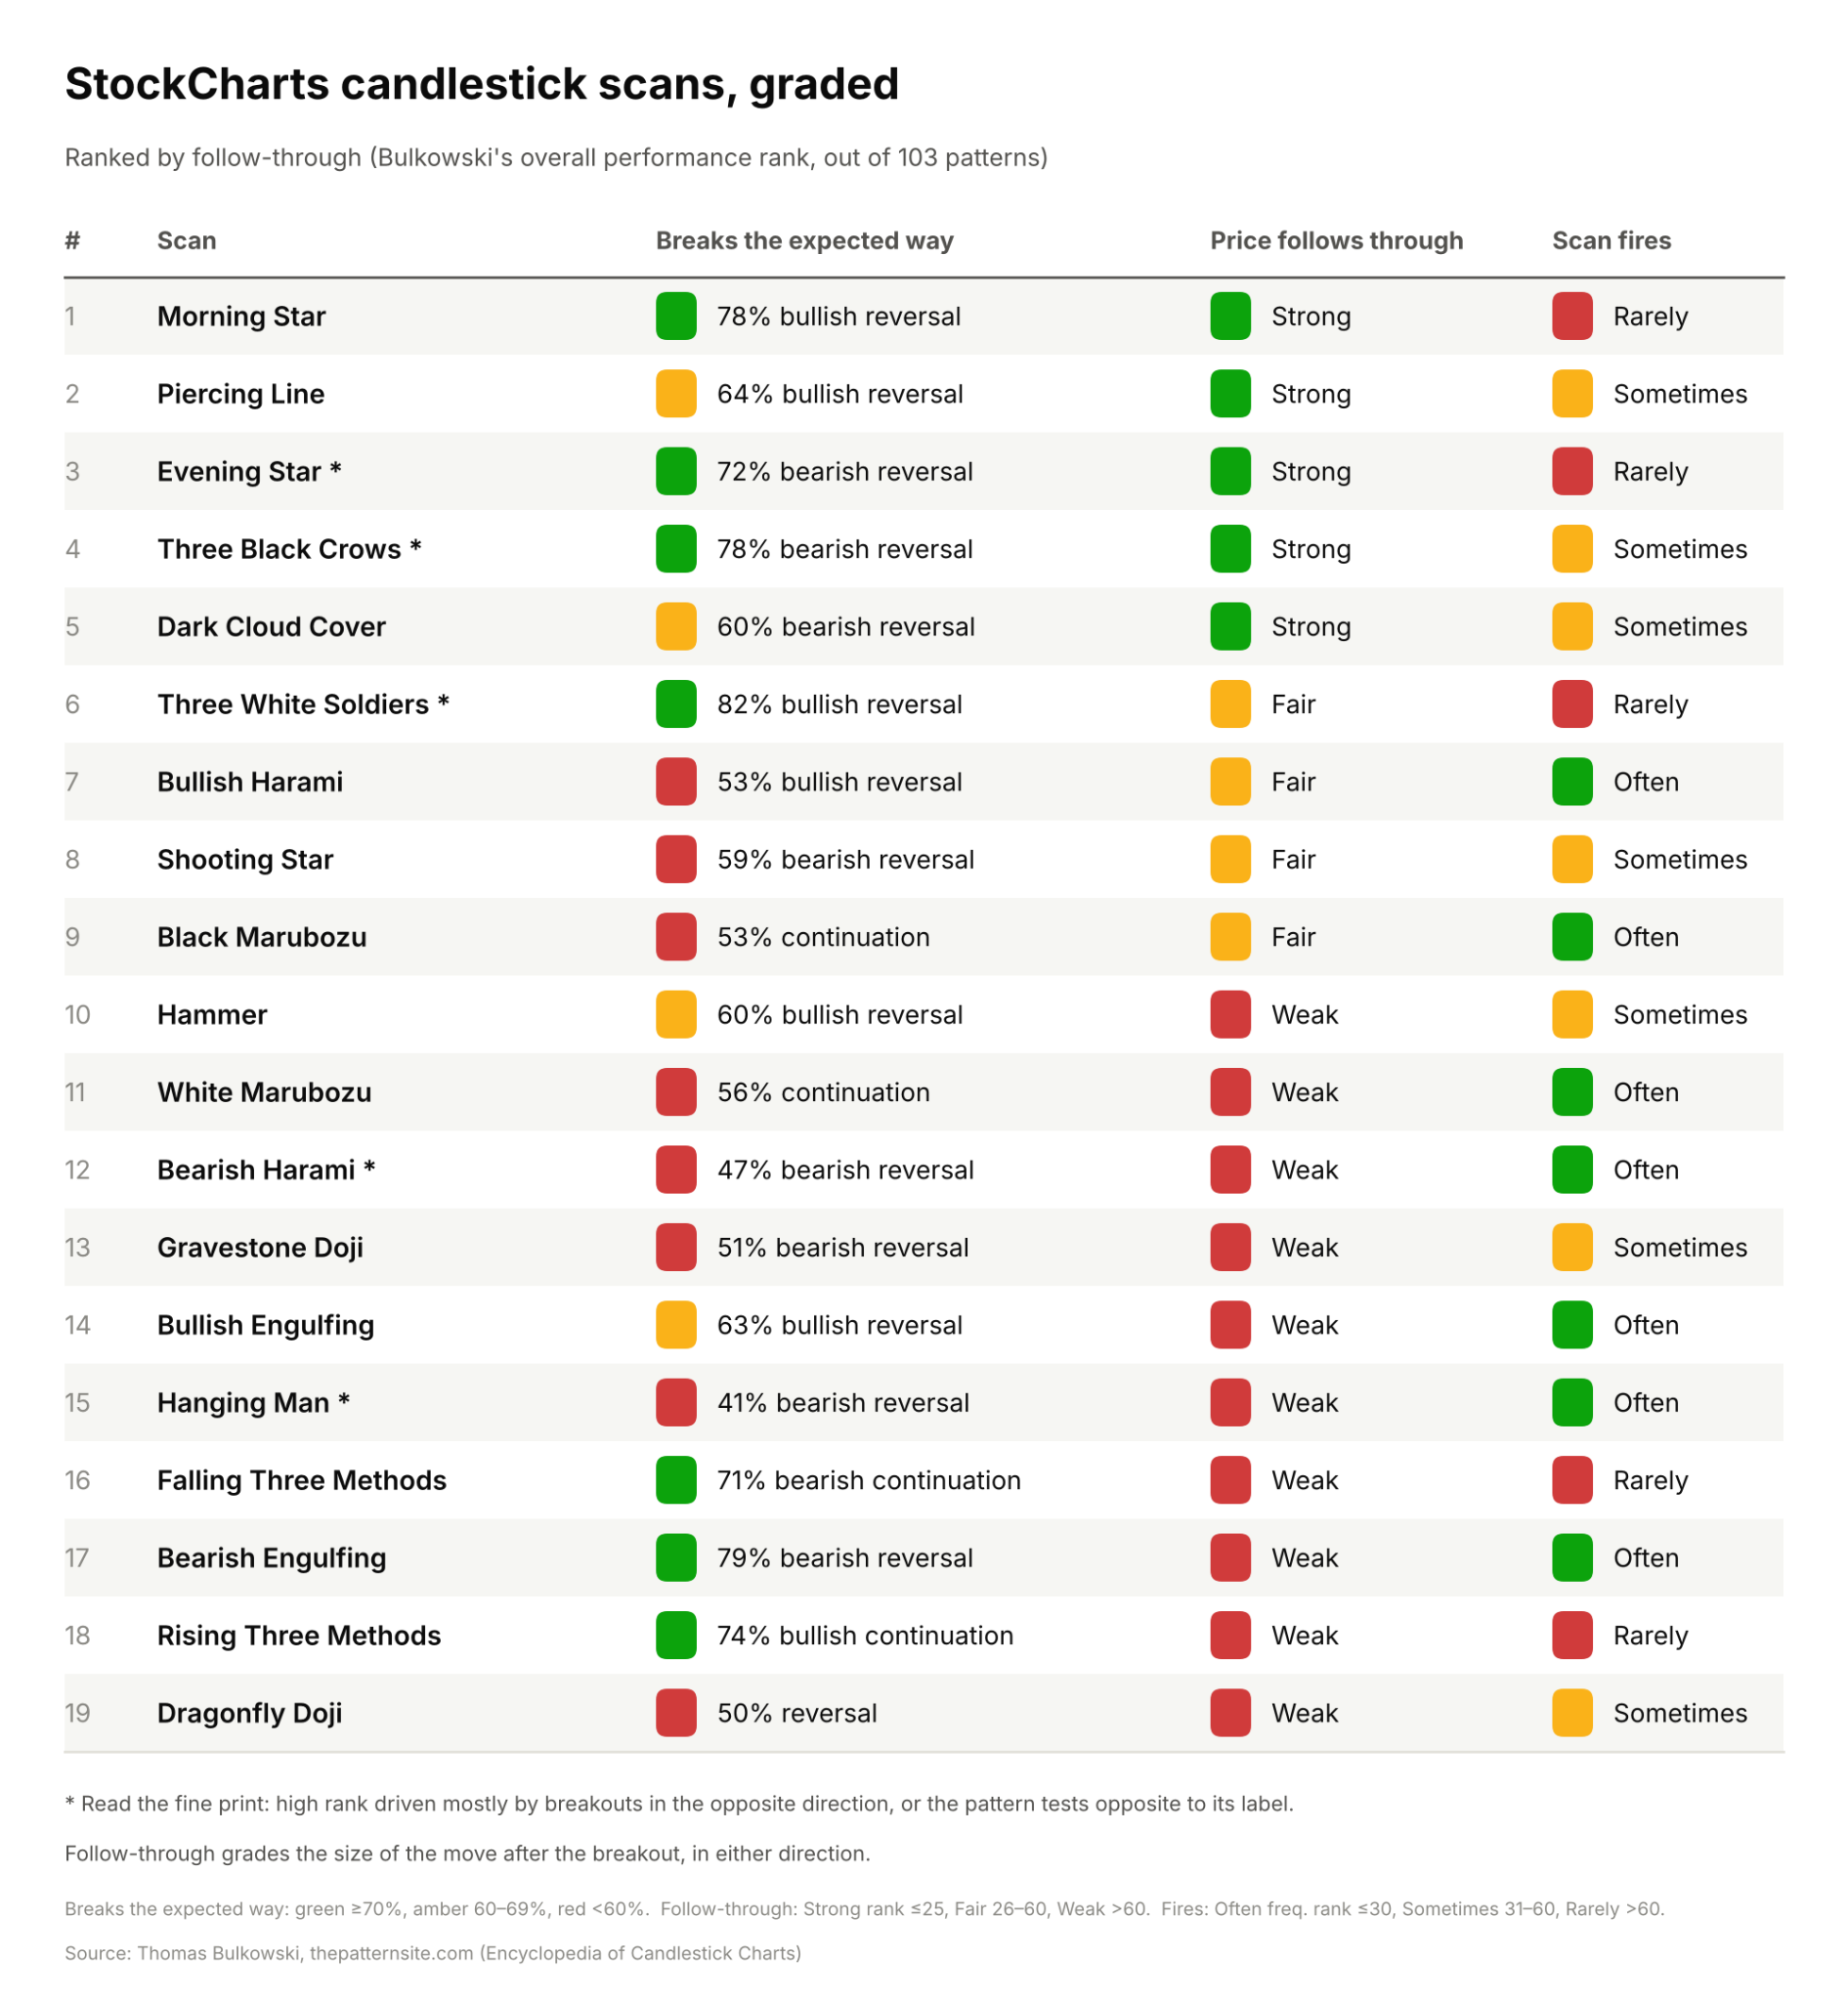
The three measures are simple. One, how well the patterns break in the expected way. Two, how strongly price follows through after the breakout, in either direction. Three, how often the pattern shows up.
Candlestick Scan Scorecard
Maybe you’ve used the candlestick scans or are planning to use them. Here’s some statistical data on what you’re looking for. Remember, the scorecard is a well-tested guide, not gospel.
Insider Tip #1 - Some patterns seem paradoxical until you look at the context
There’s a famous line from a 1970s movie (which I won’t name) that says if you’re too focused on a finger pointing at the moon, you’ll miss all the moon.
Similarly, if you’re too focused on the candlestick pattern, you’ll miss the dynamics driving the market.
Bearish Engulfing patterns are recognizable, frequently occurring patterns that have a 79% success rate in calling breakdowns. Sounds like a winner, right? Well, there’s a twist.
According to Bulkowski’s studies, the bearish move that follows runs out of steam almost immediately. In short, the pattern results in frequent bearish declines, but they fizzle out very quickly, making them unreliable.
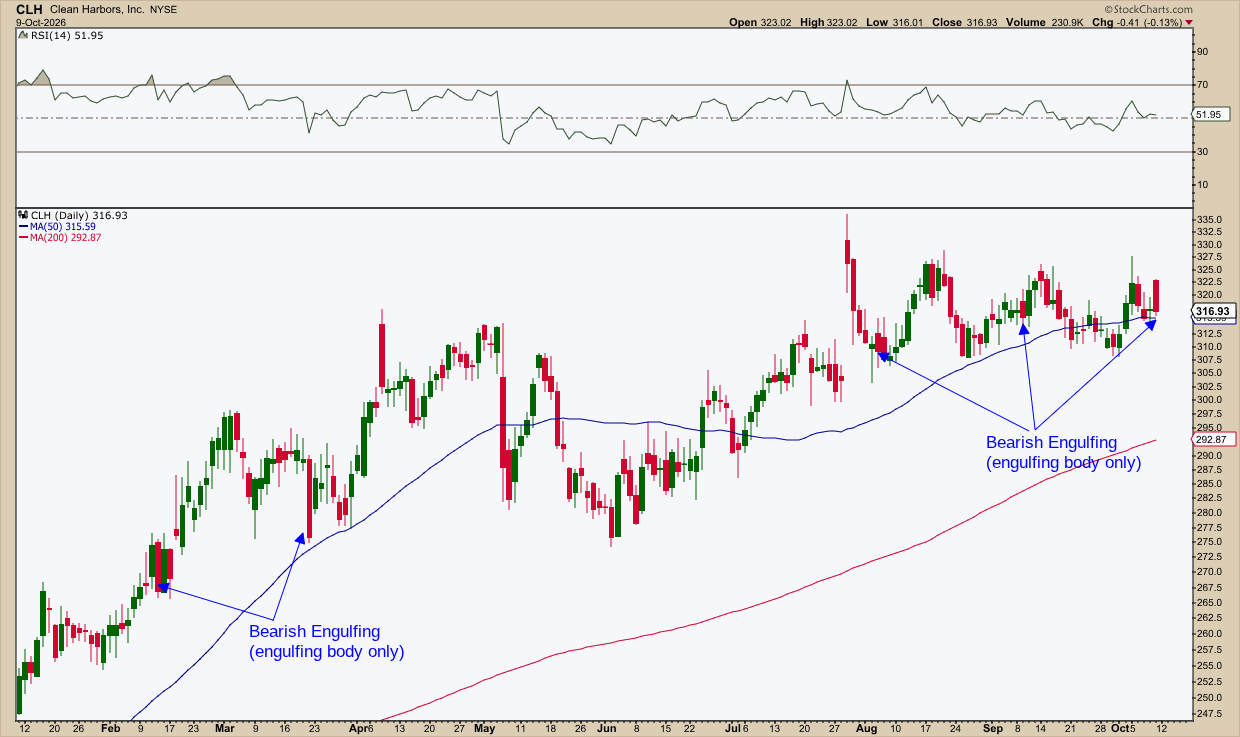
Chart of CLH exhibiting several bearish engulfing patterns.
It seems like a paradox when a pattern makes a correct call that goes nowhere. But it's not. If you look at the chart above, you can see why.
The failure or success of a pattern relies on context. I spotted most of the bearish engulfing patterns here, but almost none of them worked. In this example, if a person sold or went short, they’d be doing so as the stock was experiencing a series of time corrections during an upward trend.
By the way, bullish engulfing patterns aren’t much better, stats-wise. They break upward 63% of the time, which is not super strong, and they appear often. But the follow-through is statistically poor. Again, it depends on the context, not the pattern.
Insider Tip #2 - Some patterns have strong follow-throughs, but in the opposite direction
You have to read the fine print. Evening Star and Three Black Crows have a high breakdown rate (72% and 78%). They also score high for follow-throughs.
But there’s a catch: some of the strongest follow throughs come from cases where the reversal fails and price climbs. So, if you short the breakdown, what happens in the following sessions may not be what you're expecting.
Bearish Harami and Hanging Man are bearish patterns. According to Bulkowski’s research, price tends to keep rising. Their expected reversals happen only 47% and 41% of the time. Add to this weak follow-through. So, you might want to watch these patterns carefully if you decide to trade them.
Three White Soldiers has a strong bullish breakout rate of 82%. But once price breaks above the pattern, the move tends to stall. To be clear, this doesn’t guarantee that the follow-through will always lack momentum. It just helps to know the stats to better manage your own expectations.
Insider Tip #3 - Know the patterns that are virtually coin flips
There’s nothing wrong with trading patterns with a 50% success rate. Sure, it sounds like a coin flip, but if that’s truly the case, some traders who play both sides of the market are able to make it work.
The important thing is to know which ones are close to 50/50. Namely, Gravestone Doji (51%), Dragonfly Doji (50%), Bullish Harami (53%), Marubozu (53%/56%), Shooting Star (59%), and Hammer (60%).
Now, here’s where I turn against the scoring system a bit, and where I spot a huge caveat with any pattern-only study. Sometimes context is included and sometimes not. But context covers a wide set of variables, making it difficult to account for in pattern-only studies. So, if anything, it leaves you with a big task. And that segues into our final tip.
Insider Tip #4 - A change in conditions will change the numbers
Take a look at this Hanging Man pattern found through a scan.
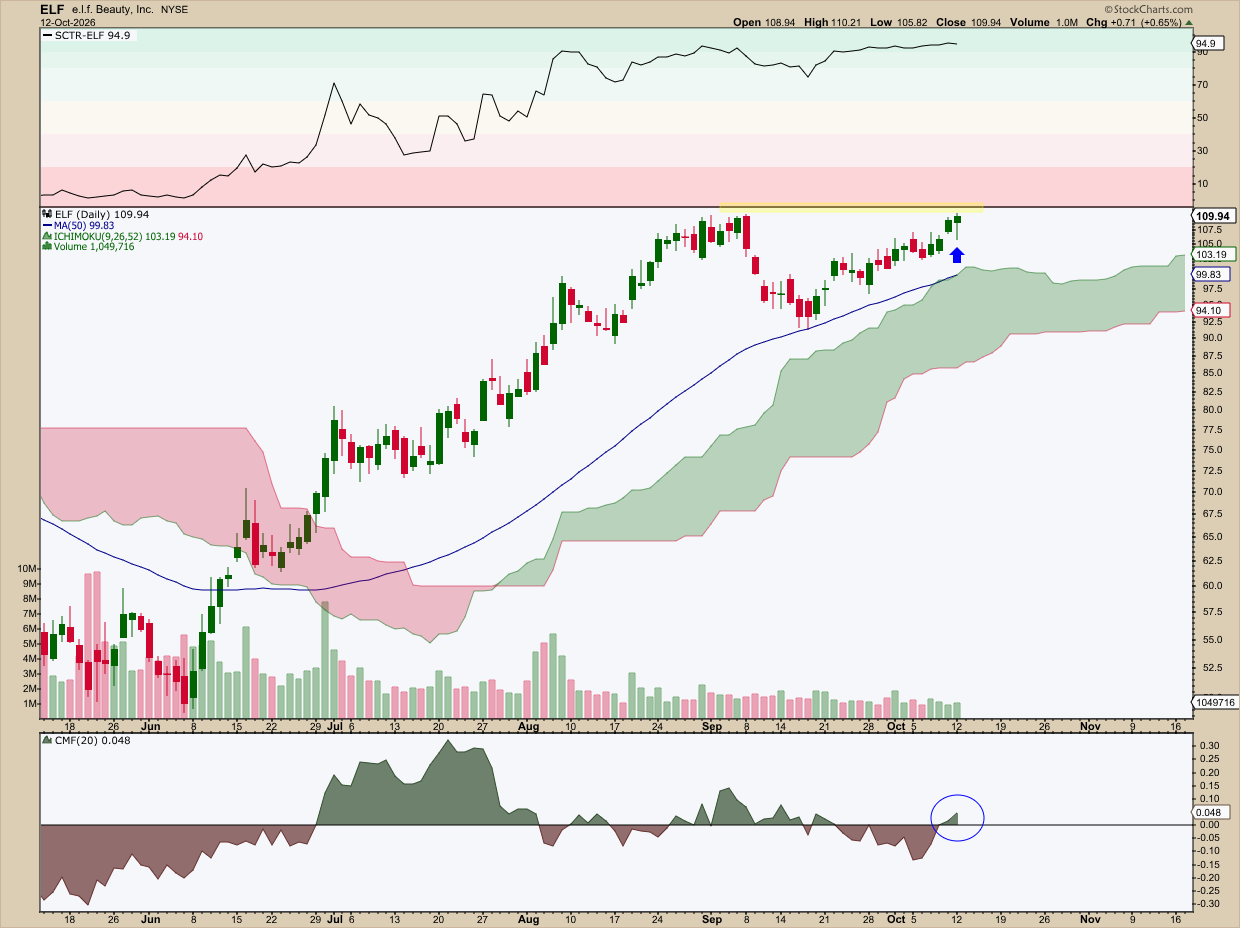
Daily chart of ELF in which the last candle is a hanging man pattern.
According to the source I used, Hanging Man has a poor bearish reversal rate of 41%. That’s regardless of context. But let’s run through it anyway. It’s a bearish reversal pattern. What does it have going for it? ELF is about to run into resistance (see yellow shading) and volume is starting to fade beneath the rally. That’s all (this excludes the fundamentals, BTW).
Besides those, the bullish signs are more compelling. First, the Chaikin Money Flow (CMF) shows buying pressure picking up (see blue circle). The stock has an exceedingly high StockCharts Technical Rank (SCTR) score, telling us that its technical strength is strong on many counts relative to its peers. At 94.5, it may be due for a pullback, but there’s no reason to think that’s going to become a reversal. The stock is also trading above its 50-day simple moving average in an up-sloping trend. Adding to the trend argument, the Ichimoku Cloud is thick, green, and trending up from past to future forecast.
The main point: the pattern is bearish, but it's occurring in a deeply bullish scenario. If you were to create a scan using other conditions (e.g., trading above x, occurring only when y happens, etc.) then the percentages will change. You’d also be entering trading system territory.
And That’s a Wrap
So which scans might yield the best results? As far as paper odds are concerned, the Morning Star and Piercing Line are probably your strongest bullish patterns. For bears, the Dark Cloud Cover may be your best pick. But beyond strict numbers, you might want to use the scorecard as a starting point. Again, it’s one person’s research, and by no means is it a verdict.
Once you change the conditions, however, the odds will shift. Pair a candlestick pattern with a trend filter, an SCTR reading, or a money flow indicator and you’re building something closer to a setup rather than trusting a pattern for its expected payout. Honestly, that’s the way to go about it. The great thing about the scans is that you can find these patterns immediately once they show up. So, give it a try and see what you come up with.
Disclaimer: This article is for educational purposes only, not investment advice.