Beyond Big Tech: Three Strong Charts in Unexpected Sectors
Key Takeaways
- Though technology has been the top performer, five other sectors have also outperformed the S&P 500 in the past month.
- The StockCharts scan engine can help identify stocks with positive relative strength, with three spotlighted here.
- Diversification outside of technology offers bullish opportunities away from the oversubscribed IPO for SpaceX.
With euphoria for the AI trade reaching a fever pitch this week, as represented by the oversubscribed SpaceX IPO, investors could benefit from looking at some of the stronger charts in the other ten S&P 500 sectors.
Here’s a performance table showing one-month returns for the 11 S&P 500 sectors, along a couple key equity benchmarks.
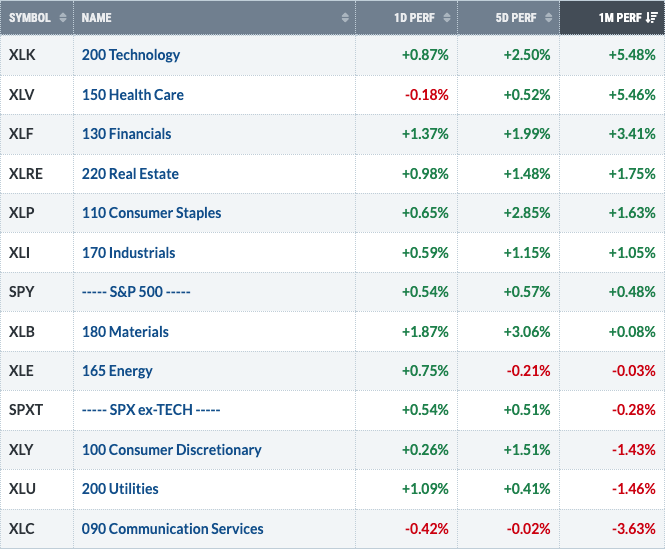
While technology has indeed been the top-performing sector over the last month, it’s worth noting that five other sectors have also managed to outperform the S&P 500 over the last four weeks. Using the scan engine on StockCharts, we were able to identify a series of stocks that are demonstrating positive relative strength and could provide some diversification away from the high-flying tech sector.
Elevance Health (ELV)
Surprisingly enough, health care has experienced almost identical returns to technology since mid-May. The chart of Elevance Health features a recent pullback to the 21-day exponential moving average, which I often use as an initial stop.
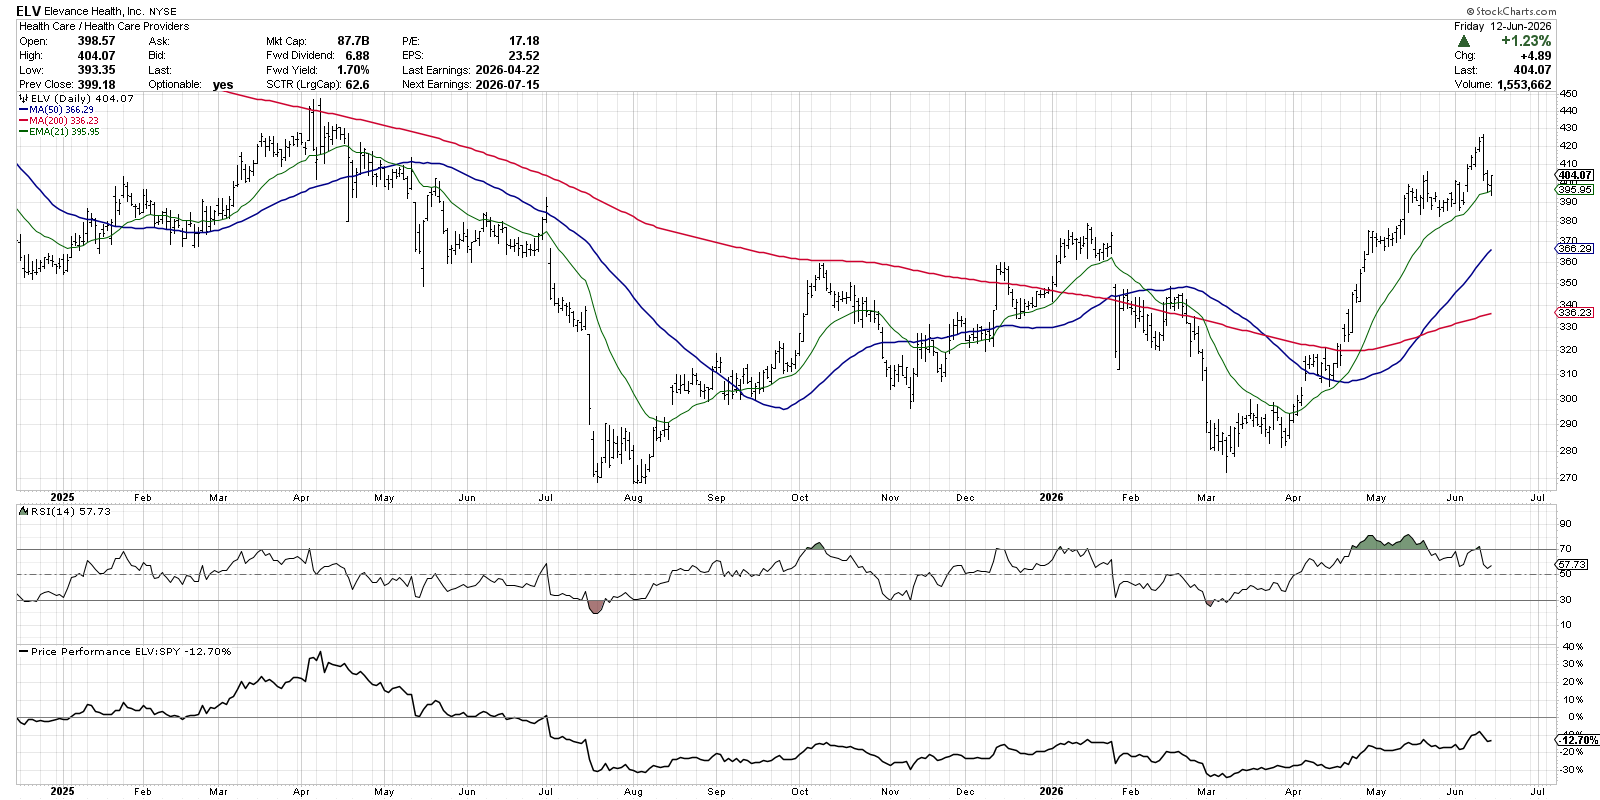
An uptrend is formed by a pattern of higher highs and higher lows, and the chart ELV features plenty of both. In mid-May, the stop consolidated after breaking to a new three-month high, then surged to another new swing high. Following a strong pullback on Wednesday, it’s not surprising that the stock dropped to test the 21-day EMA. As long as that holds into next week, we’d consider this a tactical pullback within a primary uptrend.
Goldman Sachs (GS)
The financial sector has also handily outperformed the S&P 500 over the last four weeks, and Goldman Sachs bounced higher on Friday after a similar test of the 21-day exponential moving average.
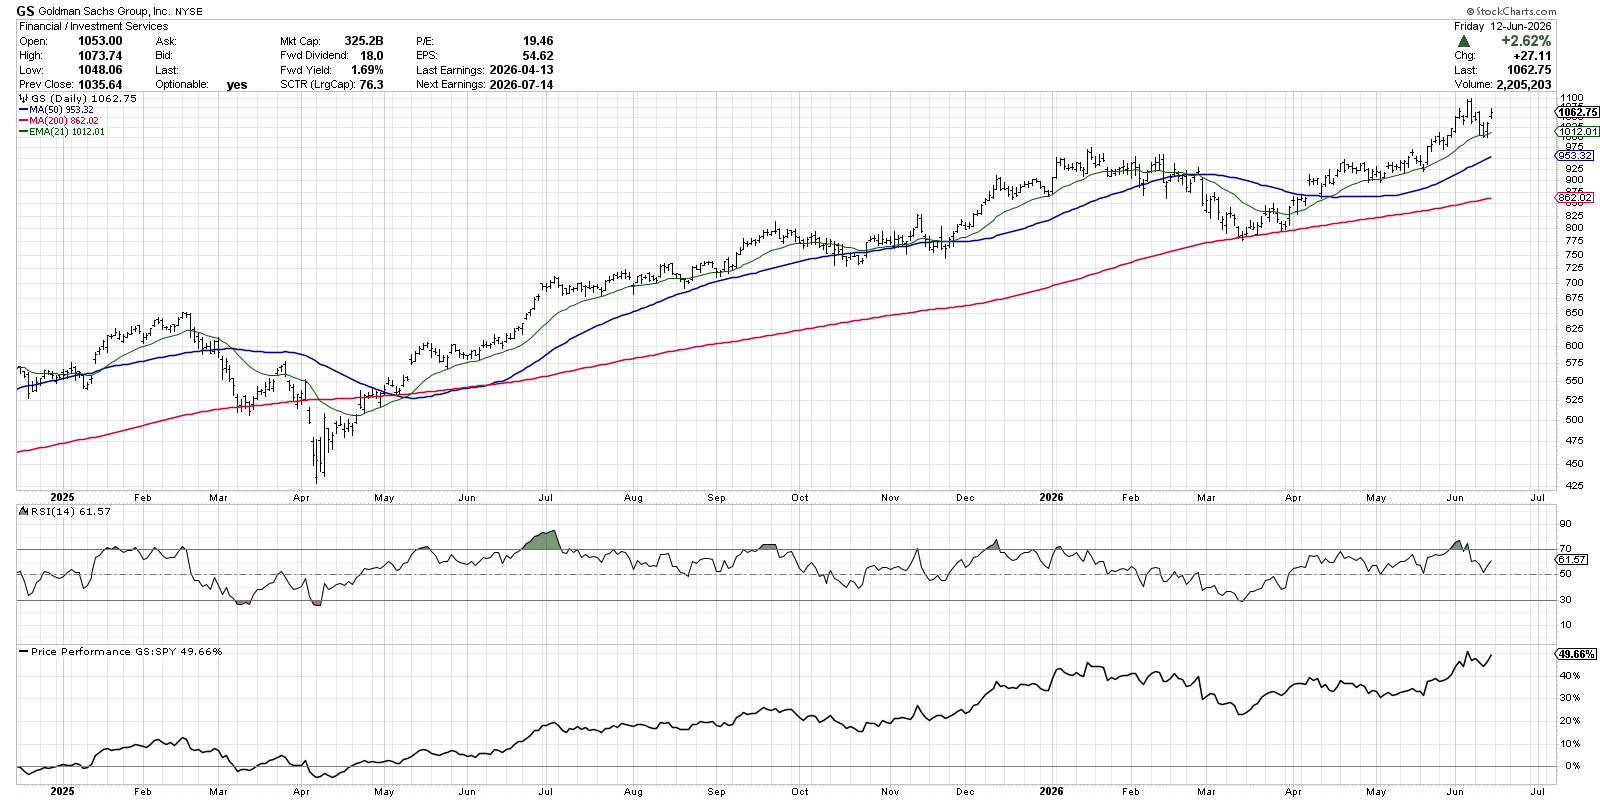
This breakout move over the last month features a number of key price levels that could prove meaningful in the coming weeks. The previous peak from January around $975 lines up well with “big round number” support of $1000. The 50-day moving average is also trending higher, approaching this “confluence of support” in the $950-1000 range.
What strikes me about the GS chart is the consistently strong price momentum. As Goldman has been pushing higher, the RSI has remained above the 50 level since the end of March. As long as the stock keeps demonstrating positive momentum readings, then the strength of the up days could indicate enough optimism to achieve further highs.
Monster Beverage (MNST)
By now, you’ve probably noticed that all three of these charts feature a particular technical pattern: positive relative strength. The chart of Monster Beverage provides a clear illustration of how an uptrend in the relative performance of the stock can help us identify names that could help us outperform the equity benchmarks.
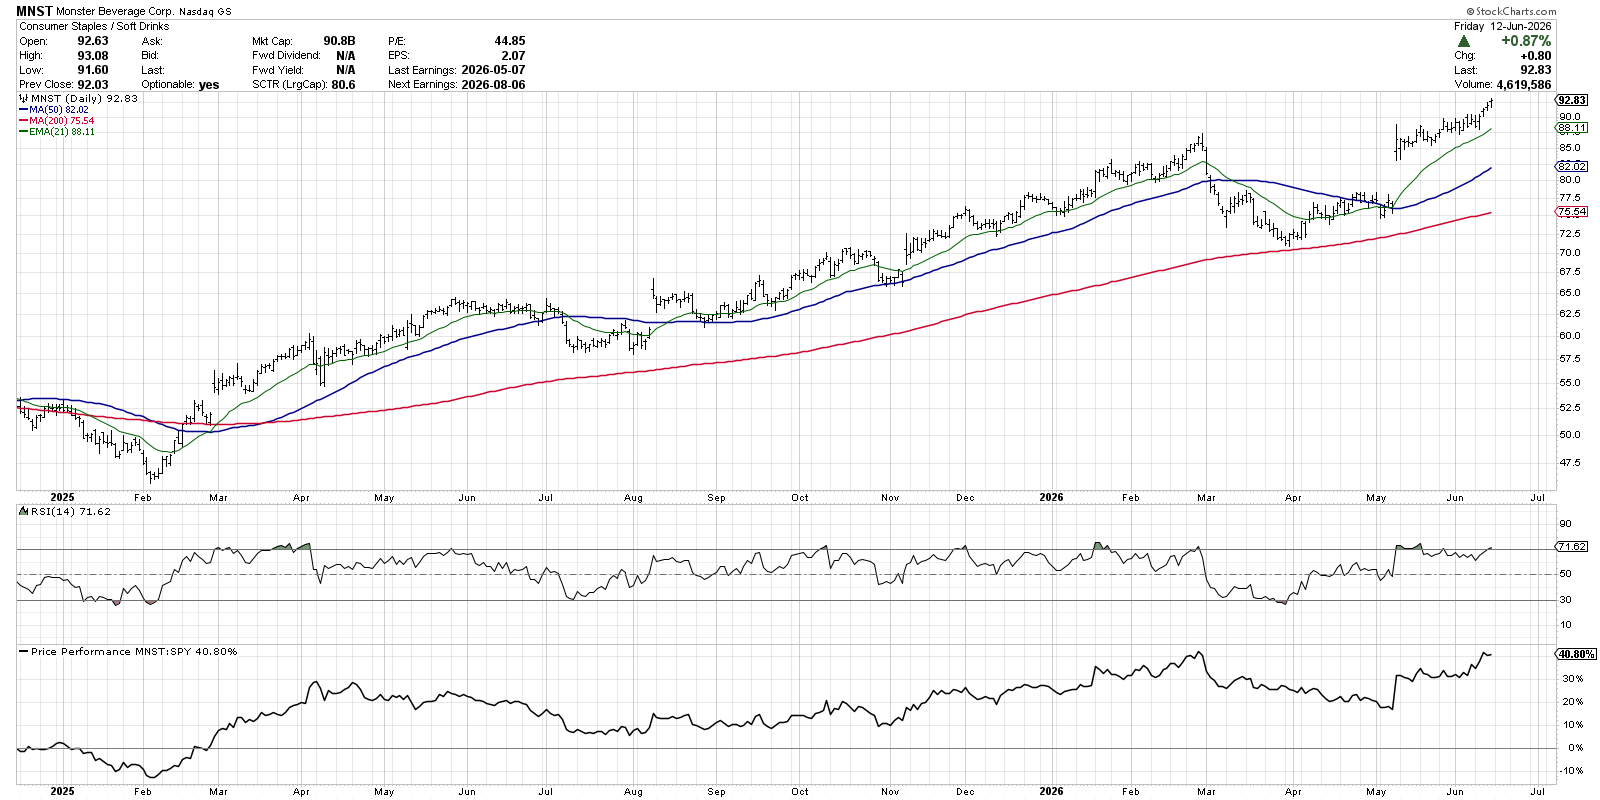
While the consumer staples sector is definitely not at the top of the leaderboard these days, Monster stands out with strong price action and impressive price momentum. Note the earnings gap from early May, as strong results led to a quick jump higher for MNST. What’s most impressive here is the price action after that earnings gap, with further upside demonstrating clear optimism from investors.
A bullish chart can be identified by three main components:
- A strong uptrend of higher highs and higher lows, with moving averages sloping higher.
- Momentum remaining positive, with the RSI staying above 40 on pullbacks.
- Relative performance sloping higher, indicating that the stock is outperforming the S&P 500.
Hopefully, these three charts show how we can use this brief checklist to validate charts showing signs consistent with previous market winners.
By the way, these charts were featured as some of the Top Ten Charts to Watch in June 2026, which you can find on the StockCharts TV YouTube channel!
RR#6,
Dave
P.S. Ready to upgrade your investment process? Check out my free behavioral investing course!
David Keller, CMT
President and Chief Strategist
Sierra Alpha Research LLC
marketmisbehavior.com
https://www.youtube.com/c/MarketMisbehavior
Disclaimer: This blog is for educational purposes only and should not be construed as financial advice. The ideas and strategies should never be used without first assessing your own personal and financial situation, or without consulting a financial professional.
The author does not have a position in mentioned securities at the time of publication. Any opinions expressed herein are solely those of the author and do not in any way represent the views or opinions of any other person or entity.