Crude Oil Cools Off; Food Prices Could Be Heating Up
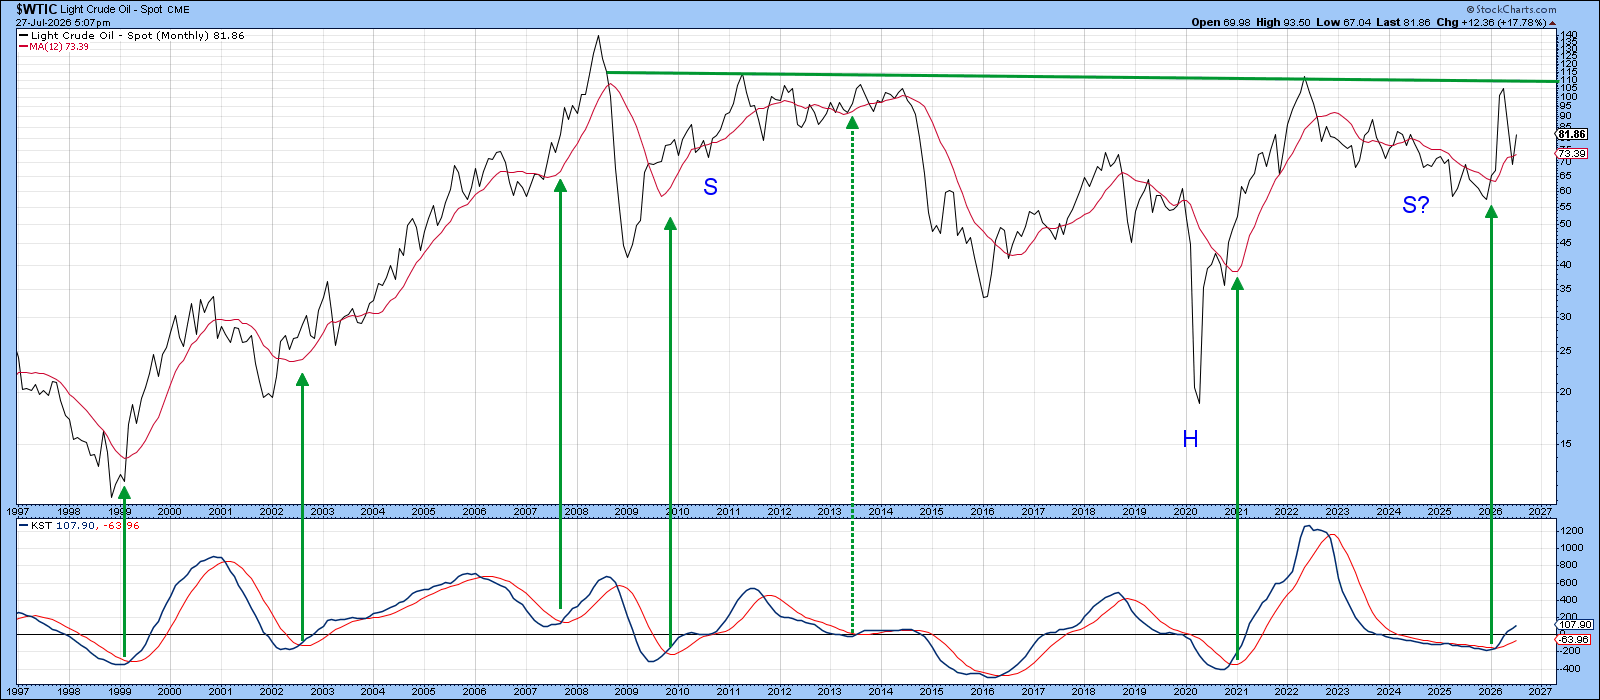
Since the beginning of March, oil has dominated the headlines, with every price swing driven by rumors of either peace or war. As oil continues to draw attention, several important conclusions can be drawn from the last 20 years of oil price action, as displayed in Chart 1.
To begin, despite the dramatic headlines surrounding the on-again, off-again closure of the Strait of Hormuz, the market's reaction has been relatively subdued. West Texas Intermediate Crude Oil ($WTIC) remains within the broad trading range that has prevailed since the turn of the century, indicating that the event has had little lasting impact on prices so far.
Should $WTIC break above and sustains a move beyond the green neckline of the potential inverse head-and-shoulders pattern near $110 per barrel, technical analysis suggests that prices could advance significantly higher. Any initial attempt to overcome that resistance is likely to be supported by the favorable configuration of the long-term KST, which continues to provide an underlying bullish backdrop.
That said, the inability of $WTIC to break out of its long-established consolidation pattern despite the “good” news is, without doubt, a concerning signal for the bulls.
Agricultural Commodity Prices Probably Headed Higher
While concerns about rising energy prices feeding into the Consumer Price Index (CPI) and other broad inflation measures are certainly justified, recent action in the agricultural commodity markets, particularly the grain complex, suggests investors may be focusing on the wrong inflationary threat. I am not suggesting that grain prices are on the verge of an explosive advance; rather, the technical evidence indicates that a solid foundation for a new bull market is being established, one that could support meaningfully-higher prices if the right catalyst emerges.
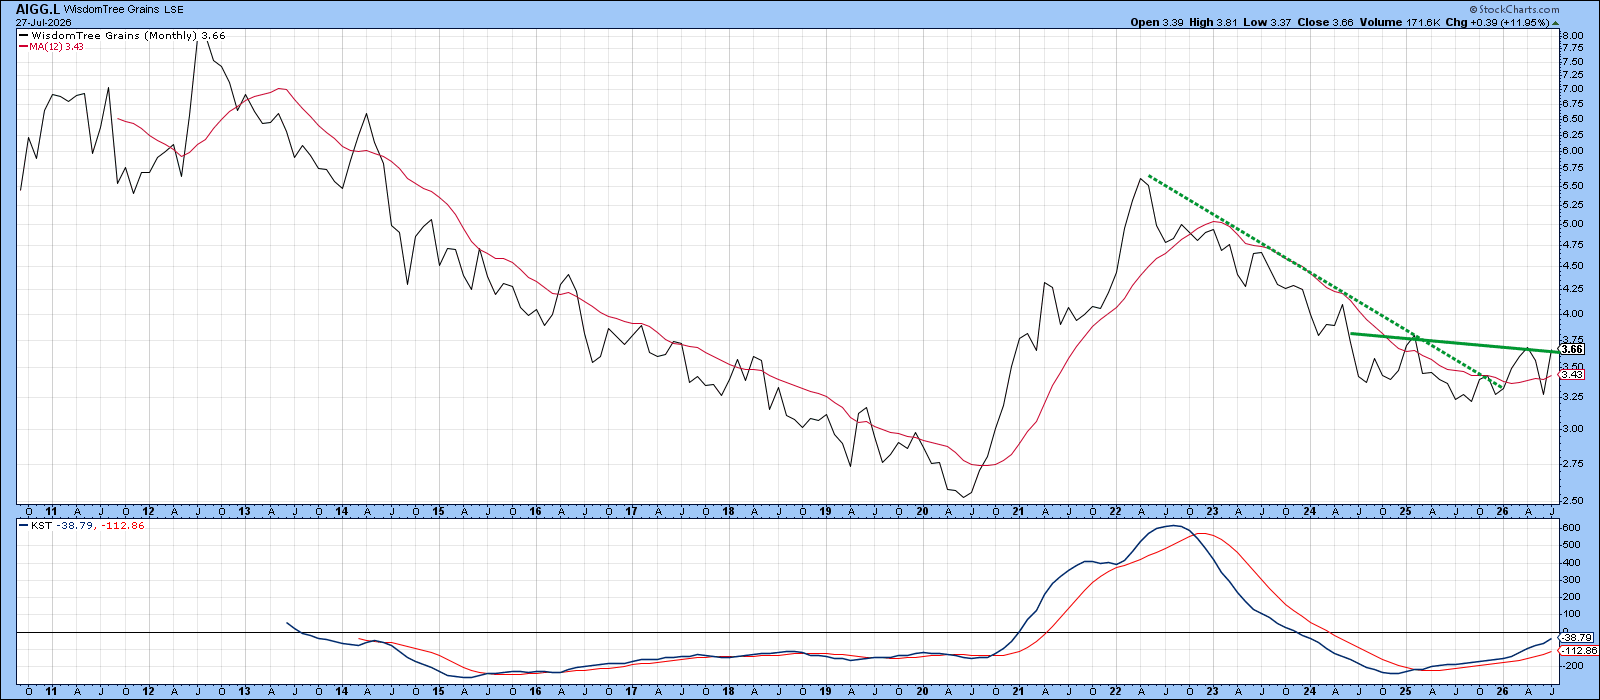
Chart 2, for example, shows the WisdomTree Grains Fund (AGG.L), which has been trading within a broad range since early 2024. The fund is now testing the upper boundary of that range, placing it at a critical juncture. A decisive upside breakout would establish a pattern of rising peaks and rising troughs, a classic hallmark of an emerging uptrend. Such a move would also confirm the message already being conveyed by the long-term KST, which remains in positive territory and continues to signal improving upside momentum.
In short, while energy prices have captured most of the headlines, the grain markets may be quietly laying the groundwork for a significant advance of their own. If the current resistance level is overcome, these agricultural commodities could become an increasingly important source of inflationary pressure in the months ahead.
Wheat May Be Leading the Agricultural Complex Higher
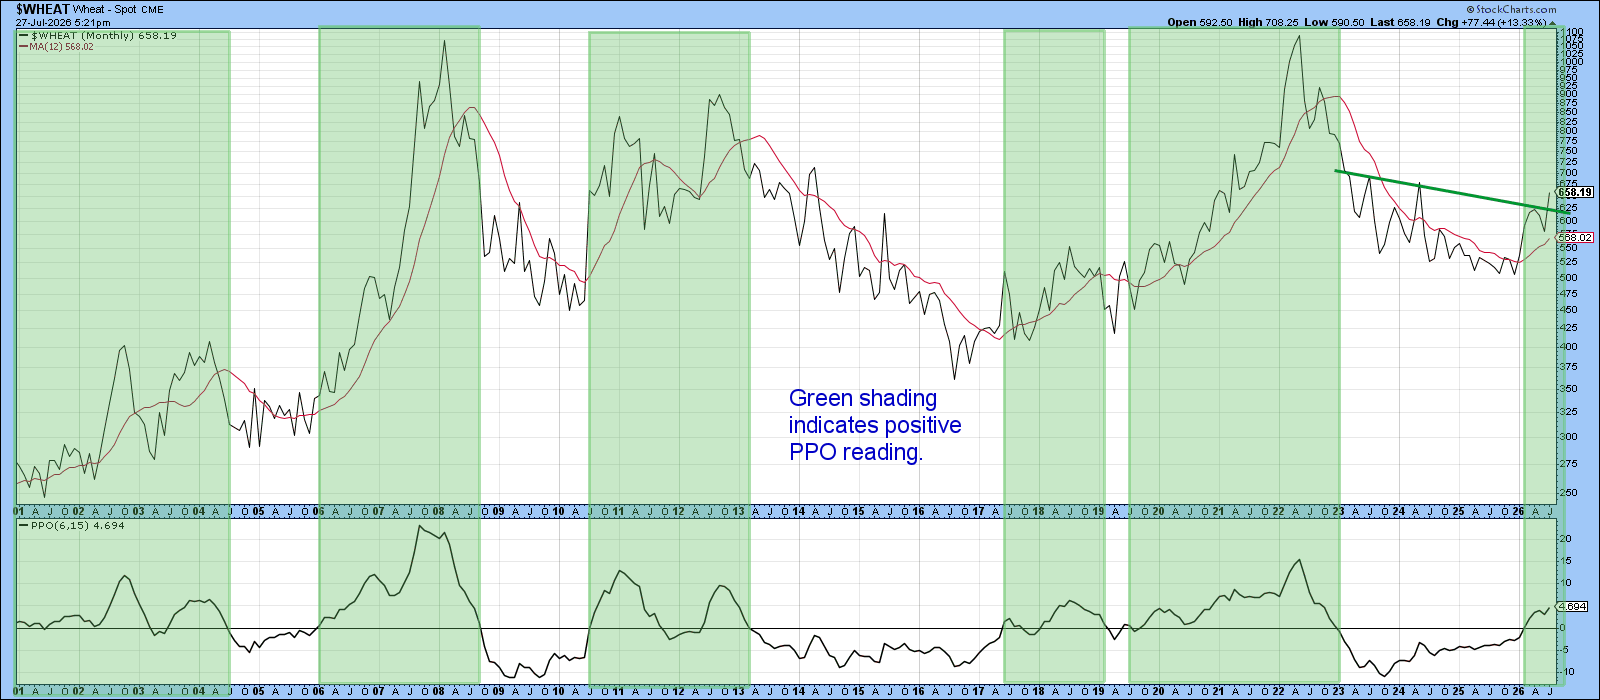
It could be argued that Wheat ($WHEAT) has begun to lead the agricultural commodity complex higher; while final confirmation will require Friday's month-end close, the current evidence is encouraging. Wheat appears to have broken out from a base formation that closely resembles the one still developing in the broader agricultural commodity index (AGG.I), suggesting that the grain sector may be providing an early indication of a broader advance.
Also noteworthy is the behavior of the Percentage Price Oscillator (PPO), which has moved decisively above the zero line. This is an important development because readings above this equilibrium level generally reflect positive underlying momentum. The green-shaded areas on the chart highlight that, despite wheat's inherent volatility, periods when the PPO remains above zero are typically associated with sustained price advances. The signal becomes even more compelling when the oscillator itself is trending higher, as is the case now.
If the breakout is confirmed on Friday with a strong month-end close, it would strengthen the case that grain prices have entered a new bullish phase.
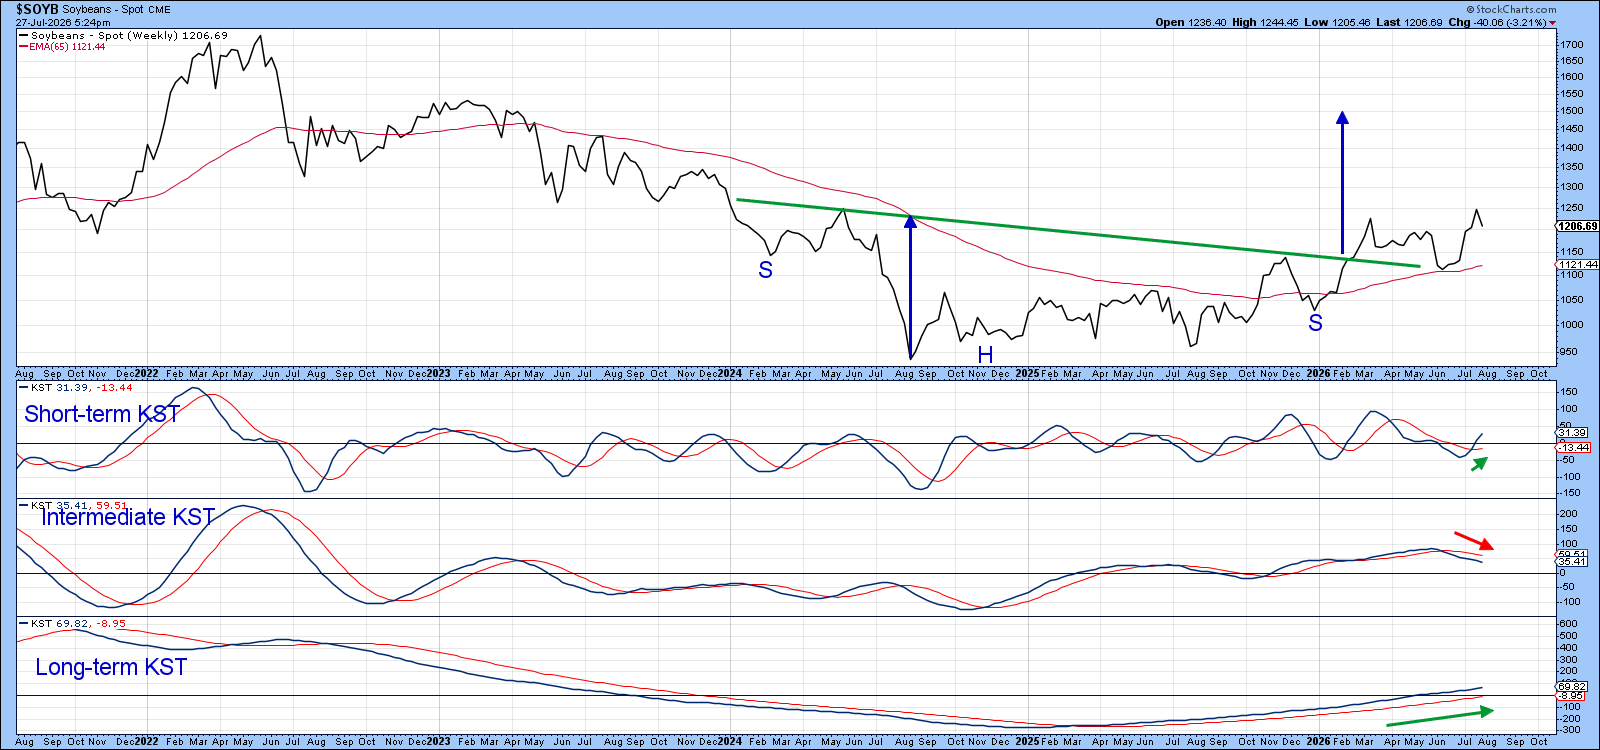
For their part, Soybeans ($SOYB) are already experiencing a series of rising peaks and troughs, the completion of a reverse head-and-shoulders base, and a positive long-term KST.
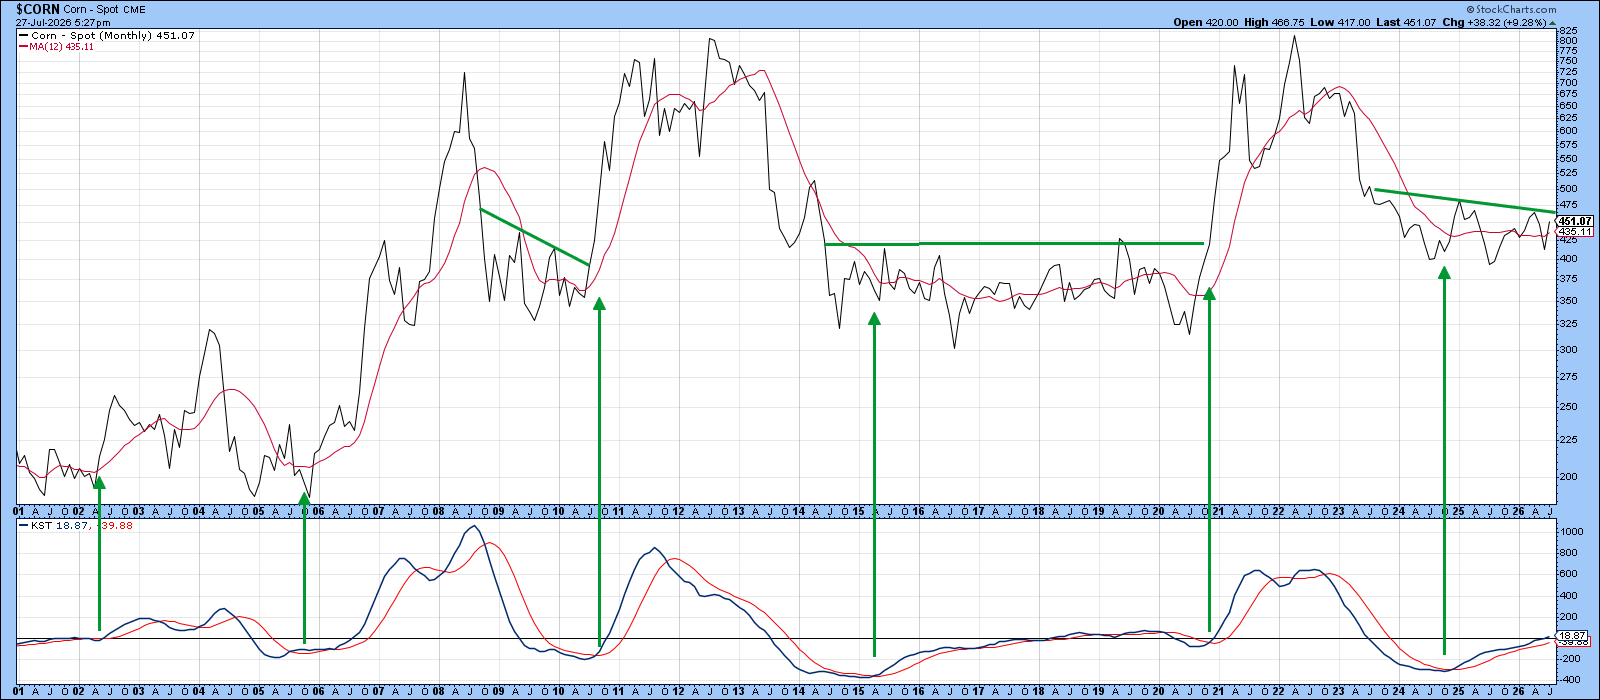
Corn ($CORN), in Chart 5, is dragging its feet since it hasn’t yet broken out from its post-2023 trading range. It would be surprising if it failed to confirm wheat and soybeans because its long-term KST is in a bullish-but-subdued mode, having just crossed above zero. The green arrows flag the five positive subzero crossovers that have taken place since 2001.
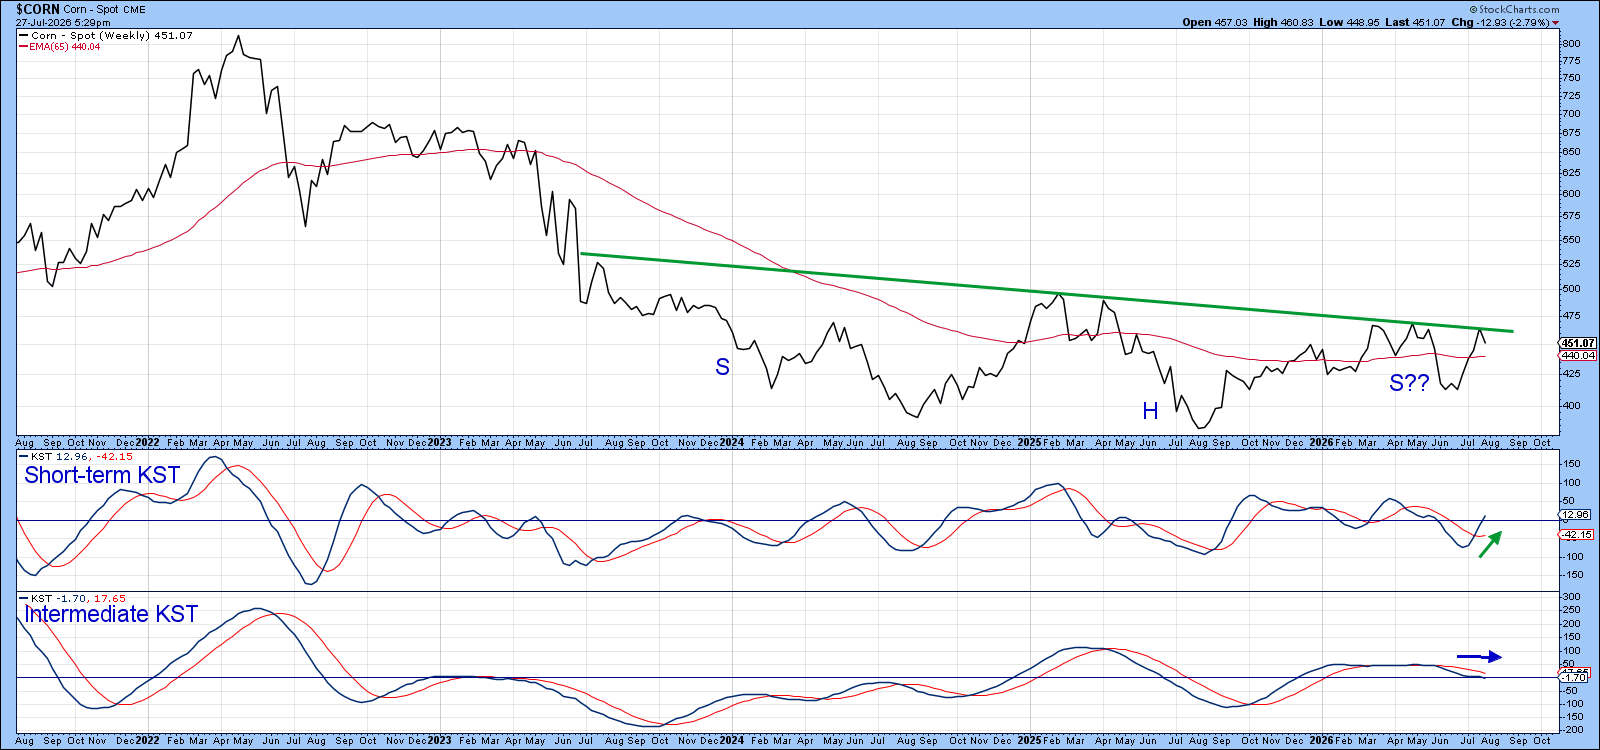
While corn has yet to deliver the decisive breakout seen in wheat or the established uptrend evident in soybeans, its improving momentum suggests that it may simply be trailing rather than diverging from the broader grain complex. If wheat and soybeans continue to strengthen, corn is likely to come under increasing pressure to follow suit, completing the bullish picture for the agricultural commodity sector.
Finally, Chart 6 argues for an imminent breakout, since the short-term KST is also in a positive and subdued mode.
The Bottom Line
Crude oil has captured most of the headlines, but its rally since February has yet to push prices out of the broad trading range that has prevailed for the past 25 years. Meanwhile, the grain markets have been quietly building a more constructive technical backdrop.
Wheat has already broken out, soybeans have completed a bullish base and established an uptrend, and corn appears close to following suit. Collectively, these markets have spent the last three years forming the kind of base patterns that often precede meaningful advances.
As a result, investors concerned about future inflation may want to look beyond energy. Unusual weather patterns, connected to El Niño and potential disruptions to Ukrainian grain exports in 2026, could shift attention toward agricultural commodities before the year is out. If the technical evidence continues to build, the next major inflation story may emerge from the grain pits rather than the oil patch.
Good luck and good charting,
Martin J. Pring
The views expressed in this article are those of the author and do not necessarily reflect the position or opinion of Pring Turner Capital Group of Walnut Creek or its affiliates. The Six Stages of the Business Cycle are followed each month in Martin Pring’s Intermarket Review.