Moving Average Limbo: A Critical Pattern to Watch

This week brought investors concerning breakdowns in some of the largest growth stocks. Is this the beginning of a much broader decline, or simply a brief pullback within a larger bullish structure?
Today, I’ll share a technique I call the “moving average limbo” pattern, show why the resolution of this pattern can provide important clues to anticipate the next move, and share examples of where this pattern has resolved constructively.
Nothing Good Happens Below the 200-day Moving Average
A stock in a primary uptrend sits above three upward-sloping moving averages. I call this the “moving averages in proper order,” and I often use the StockCharts scan engine to identify charts demonstrating this bullish trend configuration.
Alphabet (GOOGL) settled into this pattern off its March low, but a drop in early June suggested a pullback phase had begun.
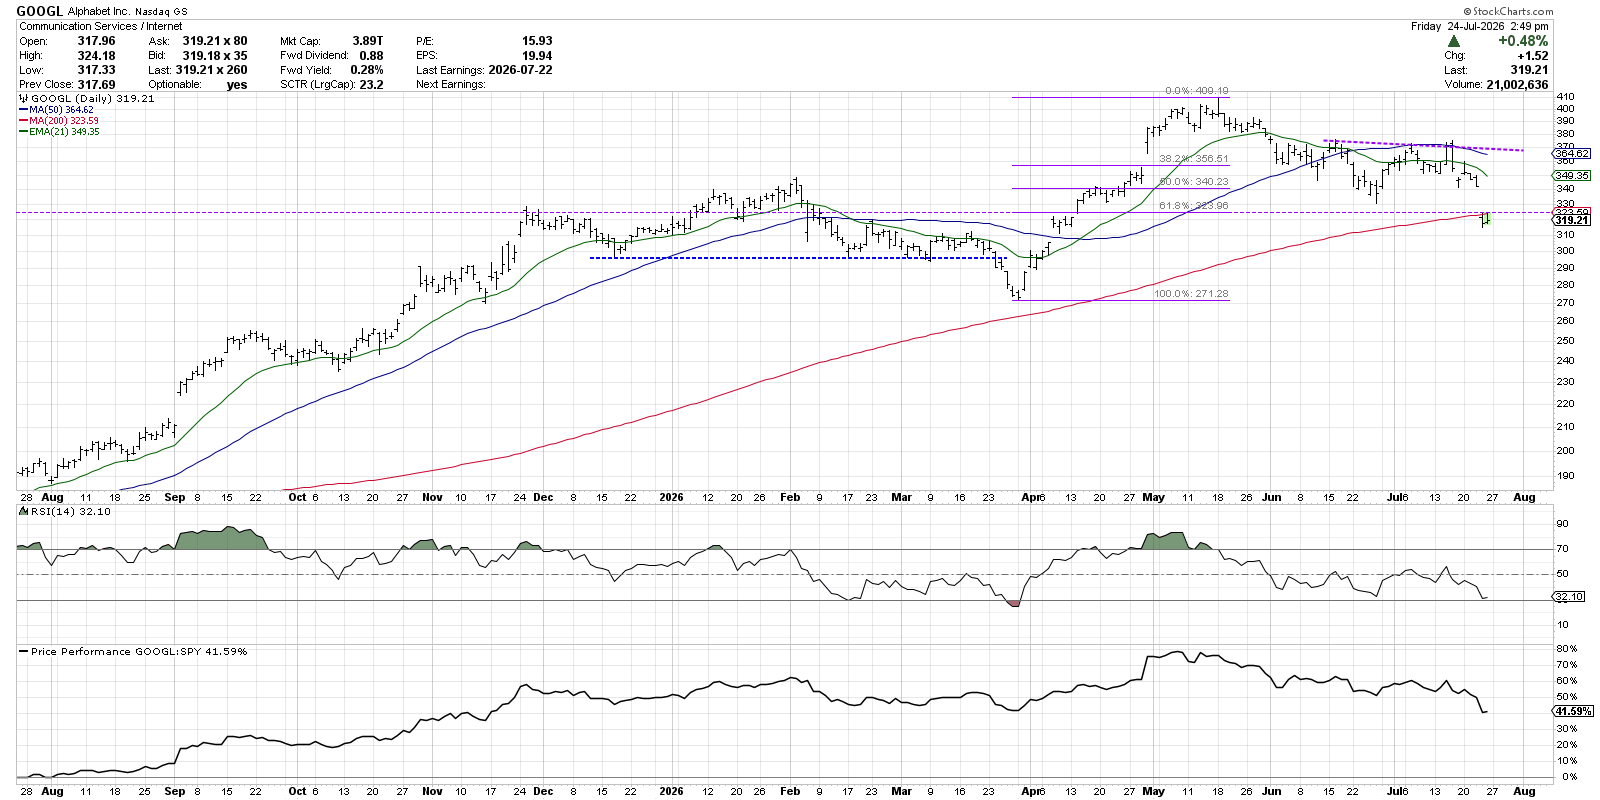
Once GOOGL dropped below the 21-day exponential moving average (EMA) and 50-day simple moving average (SMA), price entered “moving average limbo,” which means below the 50-day but still above the 200-day moving average. We noted that a trendline connecting the swing highs in June and July lined up well with the 50-day moving average. A break above $370 would have resolved this consolidation pattern to the upside.
Unfortunately, Alphabet gapped lower on Thursday after a disappointing earnings release, completing a bearish resolution to the pattern and suggesting further distribution. If GOOGL can regain its 200-day moving average, we would reset the clock and look for a break back above the 50-day to complete a bullish follow-through. For now, this chart is considered “guilty until proven innocent” in my book.
Moving Average Limbo Can Be Resolved To the Upside
The S&P 500 Midcap 400 ETF (MDY) provides a clear example of how this pattern can often resolve in a resumption of the uptrend. When MDY sold off to its March low, it tested the 200-day moving average several times before rotating higher. Finally, a gap above the 50-day moving average indicated a new accumulation phase and a high likelihood of further upside.
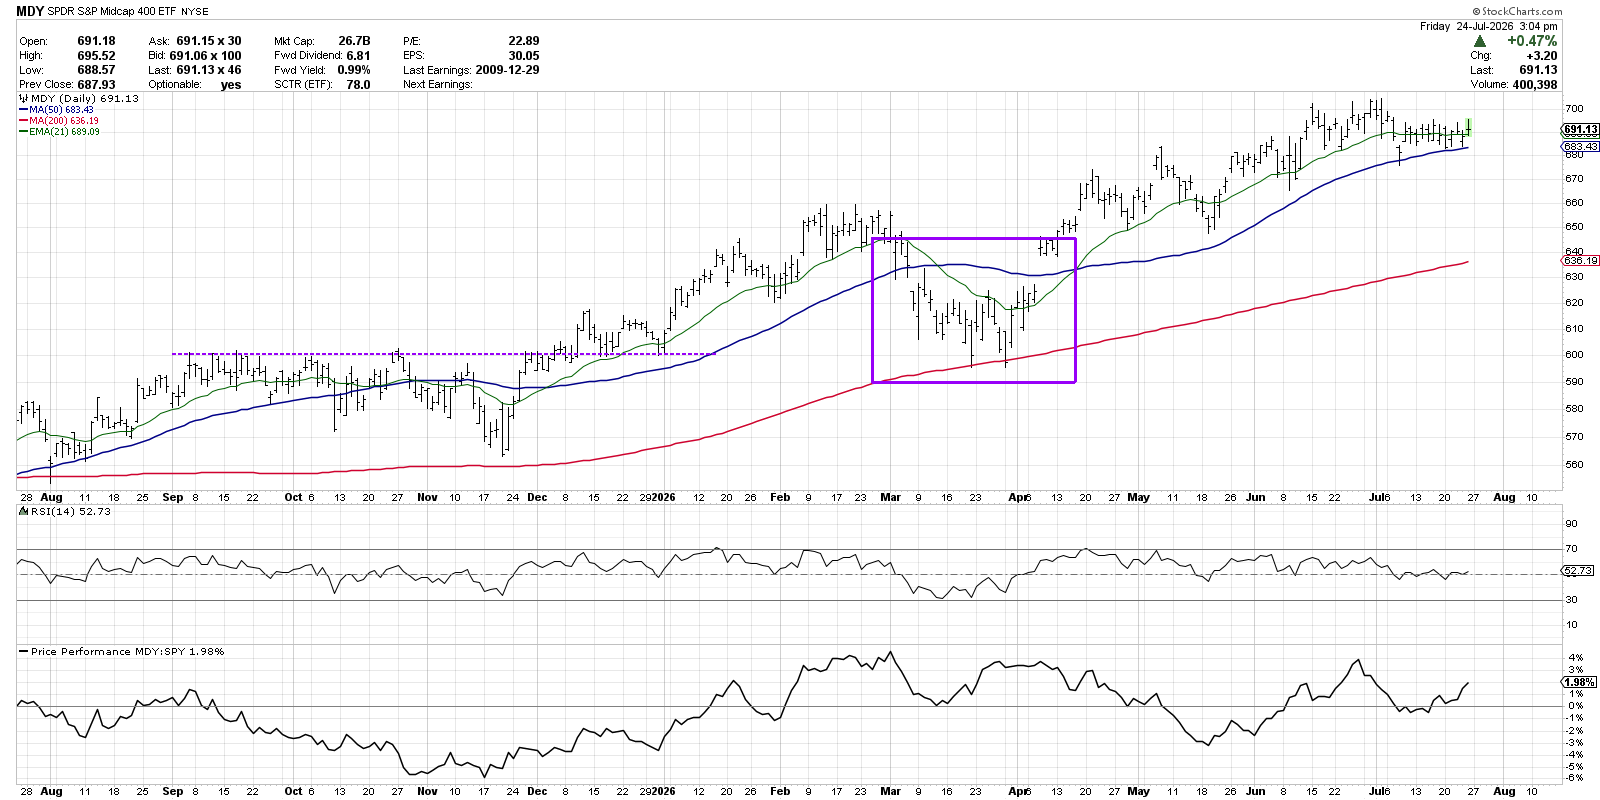
I often consider the 21-day EMA and 50-day SMA to serve as initial support levels during an uptrend phase. As long as the 200-day moving average holds, a return back above the 50-day moving average can signal an “all clear,” as an influx of buyers provides additional demand and a catalyst for further price appreciation.
A Semiconductors Breakdown Could Have Dire Consequences
This week, we’ve seen how weakness in the Technology sector can cause significant issues for our equity benchmarks. To update a classic investing maxim, “When technology sneezes, the equity markets catch a cold!” While Alphabet has already broken down, charts like Broadcom (AVGO) remain in moving average limbo going into next week.
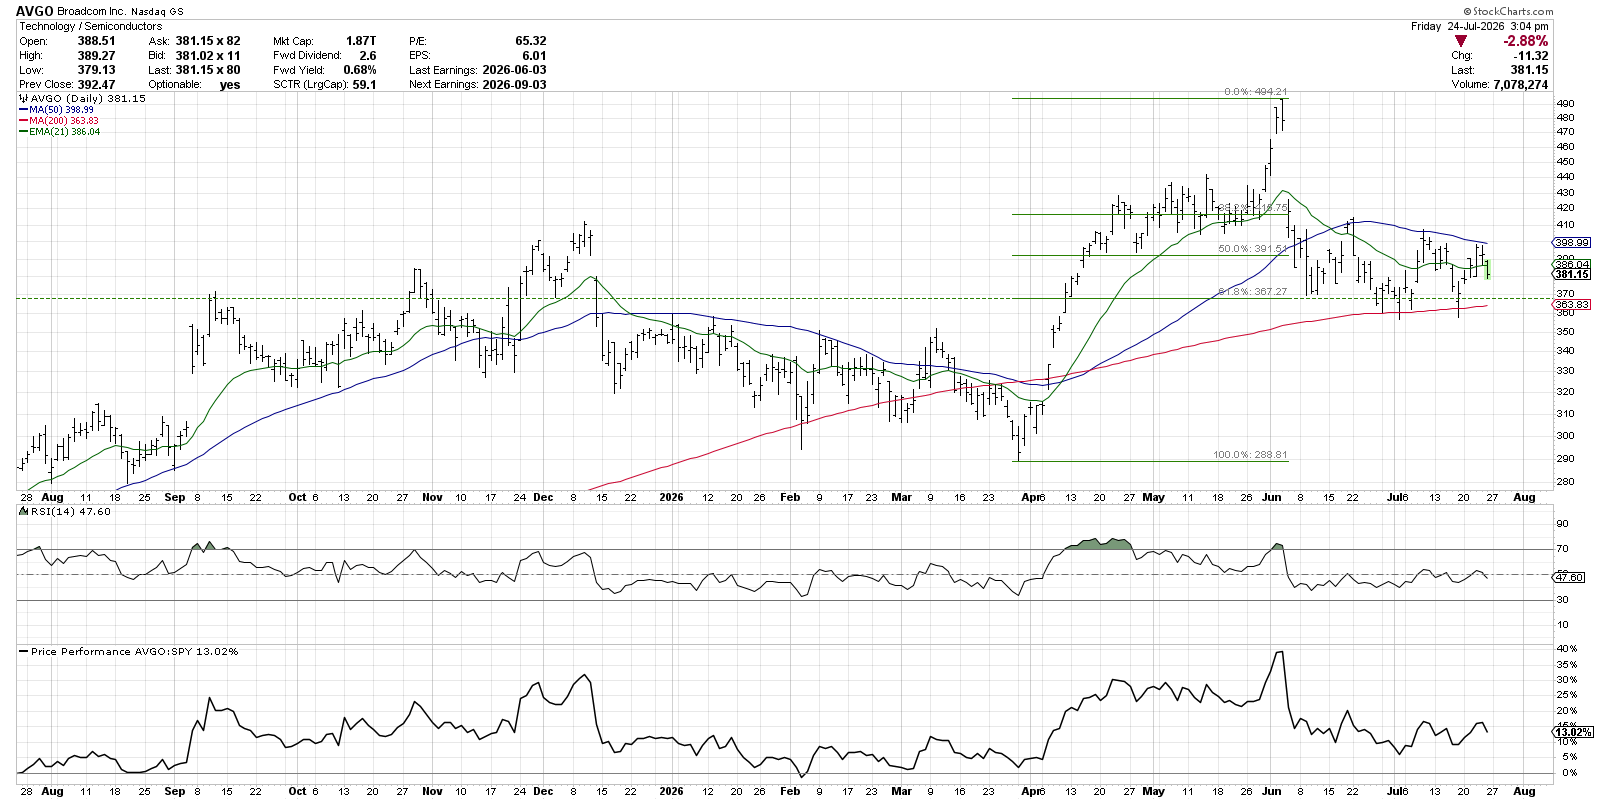
So will AVGO resolve to the upside like MDY, or the downside like GOOGL? This moving average limbo pattern, on its own, doesn't imply which way the price will move next. But what this approach does provide is a clear structure to define risk vs. reward, specific levels for creating an alert in StockCharts to track what comes next, and peace of mind from having a good plan to execute in the days and weeks to come.
RR#6,
Dave
P.S. Ready to upgrade your investment process? Check out my free behavioral investing course!
David Keller, CMT
President and Chief Strategist
Sierra Alpha Research LLC
marketmisbehavior.com
https://www.youtube.com/c/MarketMisbehavior
Disclaimer: This blog is for educational purposes only and should not be construed as financial advice. The ideas and strategies should never be used without first assessing your own personal and financial situation, or without consulting a financial professional.
The author does not have a position in mentioned securities at the time of publication. Any opinions expressed herein are solely those of the author and do not in any way represent the views or opinions of any other person or entity.