SpaceX Stock Is Down 50%. Time to Buy? Here's What the Chart Says

Key Takeaways
- SPCX has halved from its June peak, with next week's earnings likely to determine whether the IPO selloff has finally run its course.
- Historical IPO trends suggest a bottom could be near, but the technical picture remains firmly in the bears' favor.
- With 115% implied volatility, options traders brace for a major post-earnings move.
This week on the calendar is always box office on Wall Street. The Fed meeting before Jackson Hole lines up with big tech earnings, often dictating the storyline for the rest of the third quarter. Markets are on their front foot to kick off July’s final week, and this crucial Q2 reporting week is a test for four of the Mag 7.
Microsoft (MSFT) is 31% off its all-time high; Meta Platforms (META) is in a 24% drawdown; Amazon (AMZN) is 16% removed from its peak; and Apple (AAPL), meanwhile, is humming along at record levels. AI capex and strategy will be in focus, as those topics were for Alphabet (GOOGL) and even Tesla (TSLA) last week.
As for the Fed, Chair Warsh has indeed received his first major test. The bond market dares him and the 11 other FOMC voting members to hike by a quarter point. Yields pressed higher throughout this month, despite the early-week dip. The short end's rise suggests that bond traders give the green light to a hike, while the back end of the Treasury curve may demand a quarter-point increase, lest a multi-decade rate breakout occur. Either way, grab your popcorn for Tuesday AMC through Thursday AMC.
A Fast Fall from Grace
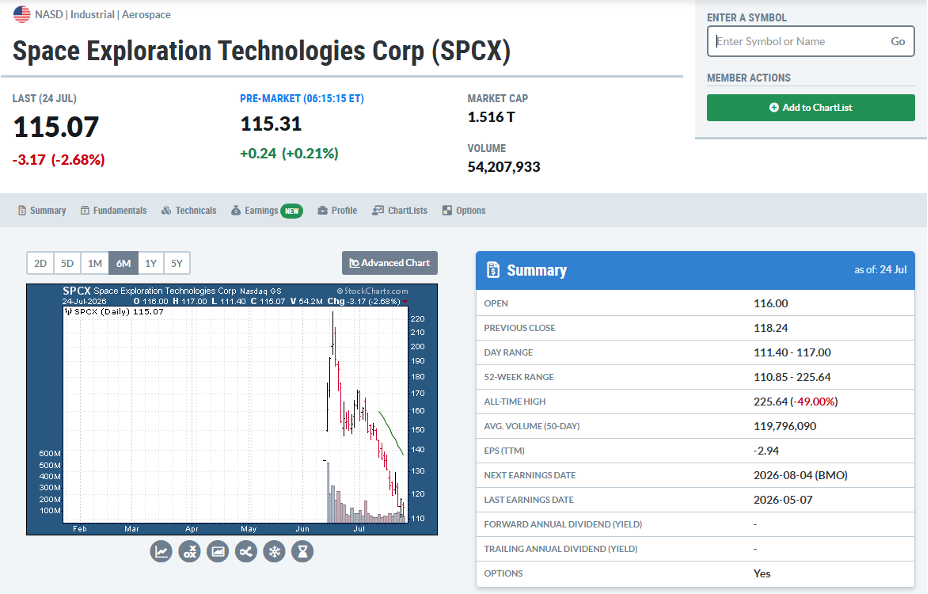
But one mega-cap was left out of Monday’s green-on-the-screen party. SpaceX (SPCX) was flat in the premarket on July 27 after being down huge for three straight weeks, falling 10%, 15%, then 7%. It reports Q2 results on Tuesday, August 4... and the bears are clearly in control. Indeed, the stock price halved after a stunning rise in its first several sessions.
The $1.5 trillion market-cap Aerospace & Defense industry company within the Industrials sector has astronomical implied volatility of 113%, with the options market pricing in a $24 swing up or down by the Friday after it reports results. That’s roughly a 20% change between now and Friday, August 7. You can check out the full options chain within the StockCharts Symbol Summary page.
What IPO History Says
Is SPCX about to reverse course? IPO history asserts that’s quite possible.
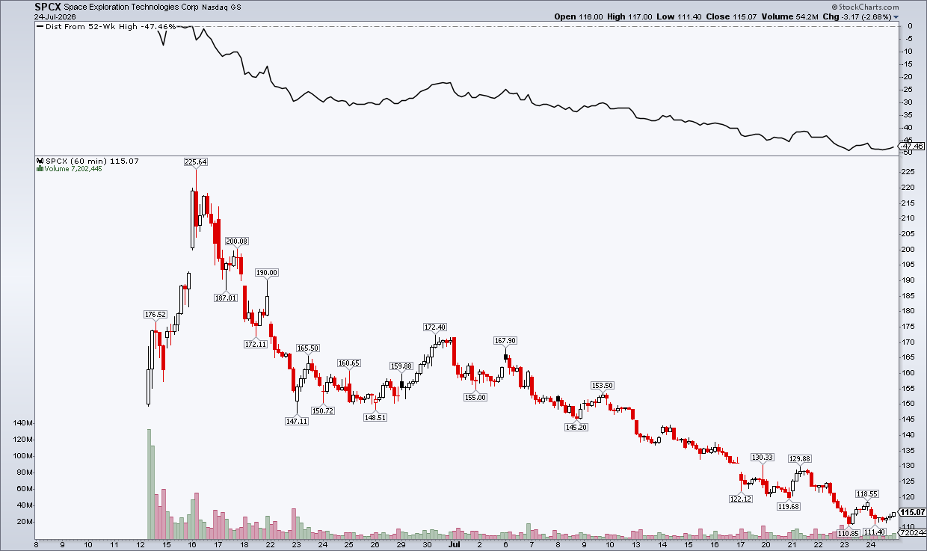
Data gathered by Keith Lerner at Truist concludes that major IPO stocks tend to storm out of the gates but then endure major growing pains. The average post-IPO drawdown is a whopping 55%. For SPCX, that implies a $102 target if we take those data as gospel. The rocket stock has (so far) notched a $110.85 low, a 51% retreat from its June 16 peak.
So, long-term investors may want to free up dry powder in the days leading up to earnings next week.
Of course, that will require setting aside opinions (good or bad) about founder and CEO Elon Musk. As with all things trading and investing, personal feelings should never come between you and the buy/sell button. Check your emotions at the door.
But Musk has been stung by massive recent declines in both SPCX and TSLA. The EV automaker's stock tagged its worst week since March 2020 last week, and those shares are at levels last seen in August 2025. Interestingly, Elon’s net worth plunged by more than $600 billion to "just" $719 billion.
Factoids aside, is now the time to get on board SPCX? Let's ignore the noise and focus on the chart.
Momentum Still Favors the Bears
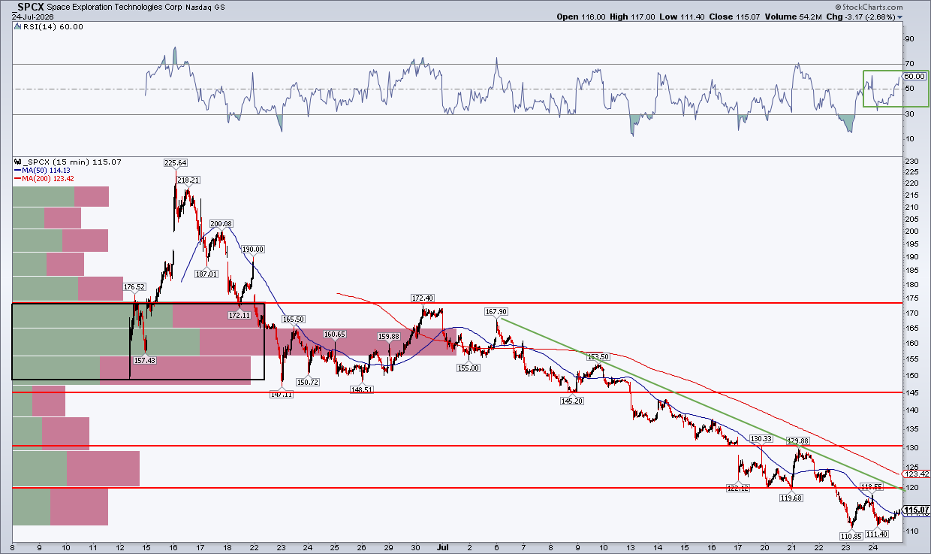
Notice in the SharpChart below that the bears clearly control the primary trend. Using a 15-minute period (instead of the standard daily), we find that the 200-period moving average is on the decline, along with trendline resistance coming into the picture near $120. While shares may attract buyers just above $110, several significant resistance levels are overhead.
First, SPCX needs to hurdle $120. A rally through there would offer a boost to the bulls. ($120 was the July 21 low and where SPCX encountered sellers just last Friday.) I’m encouraged by a slightly better RSI momentum oscillator at the top of the graph, but that will swing wildly on a 15-minute chart (let alone on a stock with 115% implied volatility). $130 is another point of polarity, while long-term resistance is likely at $145.
The 38.2% Fibonacci retracement of the June-to-July decline is way up at $155. From a volume point of view, high congestion is found from $147 to $172, an area from which many initial buyers may sell to break even. Interestingly, the $135 IPO price wasn’t a psychological price floor during the July selloff.
Can Earnings Improve the Story?
In short, investors could buy simply based on historical IPO trends as SPCX nears $102, but for swing traders, additional technical signals must confirm a possible low and renewed uptrend. We aren’t seeing it yet.
Maybe that changes as the August 4 earnings date approaches. It’s also possible that SpaceX’s debut quarterly report will act as a clearing event, laying the groundwork for a washout rally over the balance of the year.
Fundamental analysts have plenty of beef with a long SPCX play: a sky-high valuation, a chunk of the market value based purely on faith in Elon Musk, and the reality that a hefty number of shares will unlock in the months ahead. That’s all true, but the market understands this already; it has access to ratios, multiples, and a calendar.
The Bottom Line
SPCX was left out of the market’s party early this week. Shares are bumping along at all-time lows, down by about half from the $226 high hit on June 16. For long-term investors, IPO history asserts that a bottom may be near, but traders should wait for technical reversal indicators before swinging long.
Disclaimer: This blog is for educational purposes only and should not be construed as financial advice. The ideas and strategies should never be used without first assessing your own personal and financial situation, or without consulting a financial professional.