Three Software Stocks Showing Renewed Strength

The technology sector remains in a consolidation phase, perhaps best illustrated by the rangebound situation for the Nasdaq 100. While tech is less impressive than other outperforming sectors, there are individual names and groups showing renewed signs of technical strength.
Today, we’ll highlight three technology names with constructive setups, along with key warning signs to watch for in each chart. As we often discuss on our daily market recap show, technical analysis is less about predicting the future and more about recognizing clear signs of changing trends!
Microsoft (MSFT)
The chart of Microsoft remains one of the strongest out of the Mag7, currently sitting above upward-sloping 21-day and 50-day moving averages. Perhaps the most impressive feature of this chart is the continued upside move after the gap higher on Q2 earnings.
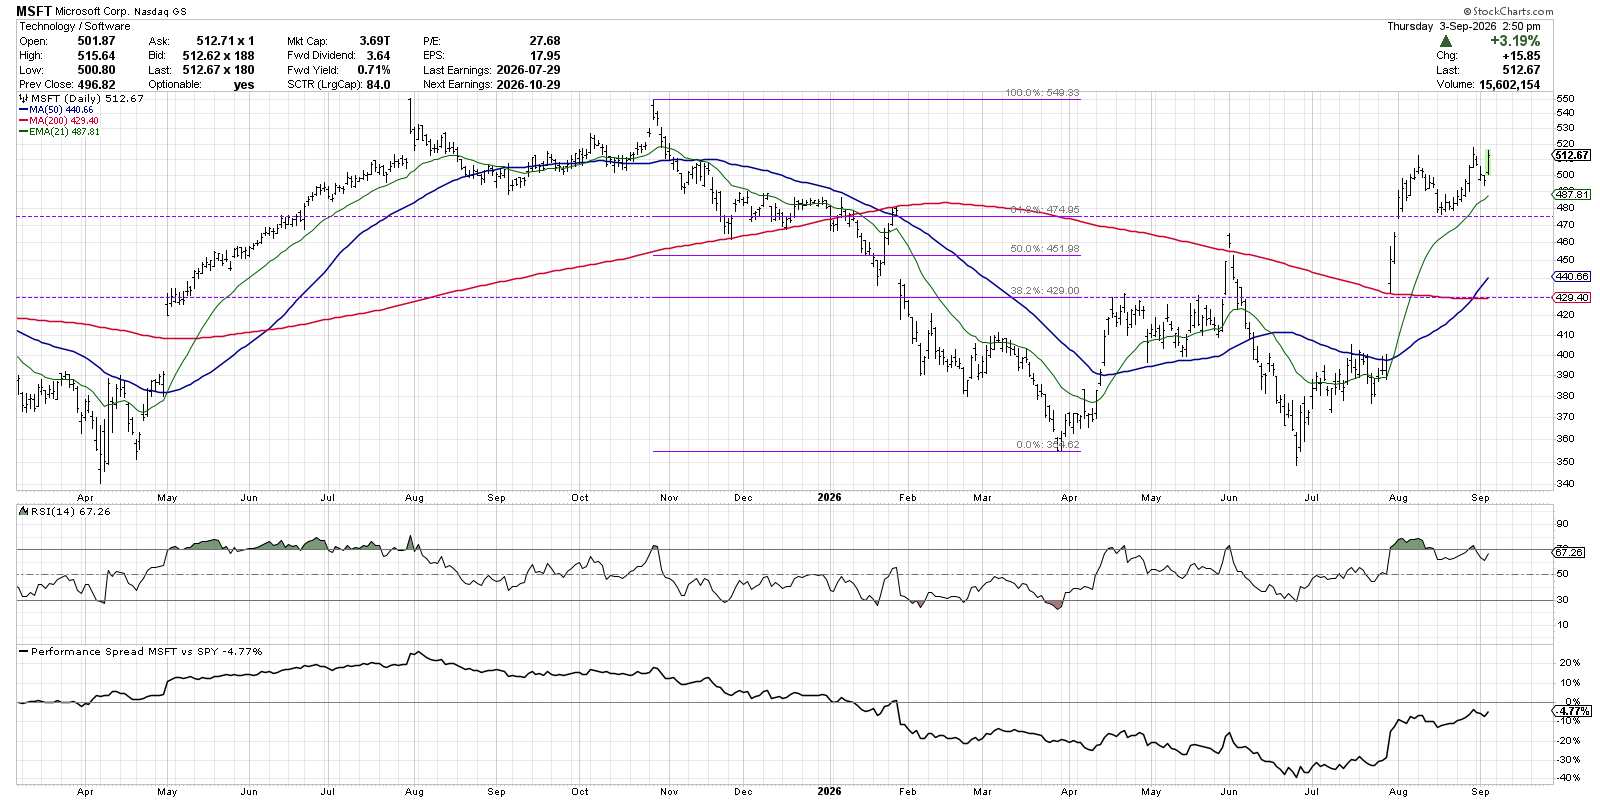
The gap above the 200-day moving average in July was followed by additional upside, which moved MSFT above a 61.8% Fibonacci retracement level. In mid-August, the stock pulled back to retest that support level around $475, before resuming the uptrend phase into this week.
The only concern for this mega0cap growth name is waning momentum. New highs in late August were met with weaker Relative Strength Index (RSI) readings than the high earlier that month. While the RSI did still reach the overbought condition, which speaks to the strong underlying momentum, higher RSI levels on a new high in September could provide a crucial confirmation of the uptrend phase.
CrowdStrike Holdings (CRWD)
Remaining in the software group, we’ll next look at CrowdStrike’s consistent uptrend of higher highs and higher lows. Recent pullbacks to an ascending 50-day moving average have been met with the “buy the dips” crowd, which appears to be alive and well here.
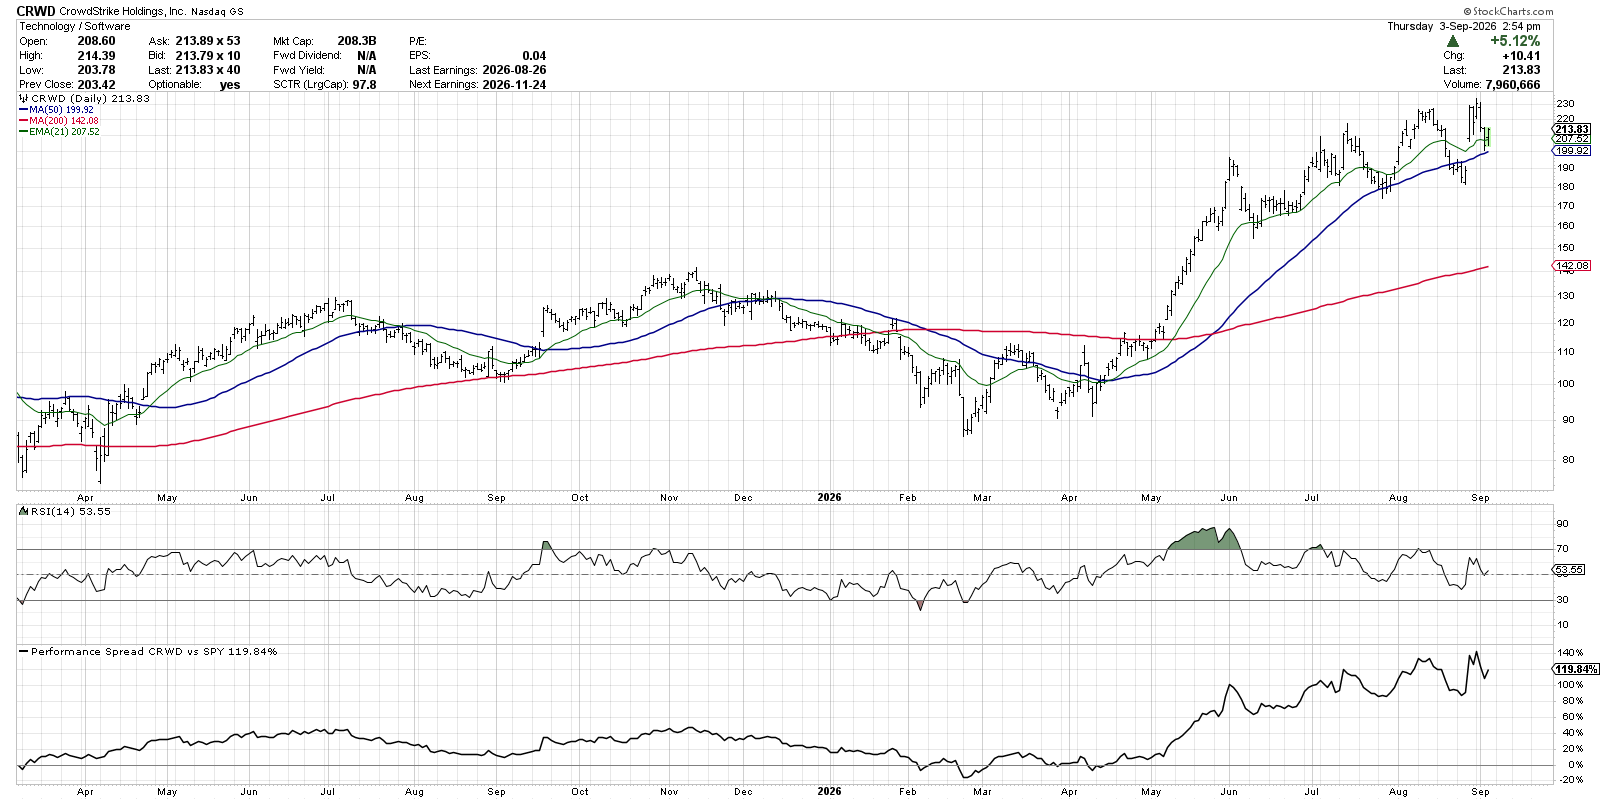
Similar to the chart of MSFT, the lack of momentum on the most recent new highs speaks to a weaker buying power. While the primary trend remains bullish based on the price trend and moving average configuration, this bearish momentum divergence implies that the bullish trend could be in its later stages.
If CRWD were to reverse lower, we’d look for support at the 50-day moving average as well as the $180 level, where previous lows have been established. Despite the weaker momentum readings, we’re still considering this chart “innocent until proven guilty.”
Tyler Technologies (TYL)
Shares of Tyler Technologies have finally broken back above the 200-day moving average for the first time since summer 2025. This recent move above the 200-day also meant a new three-month high for this software name, and the RSI finally reached the overbought region for the first since August 2025.
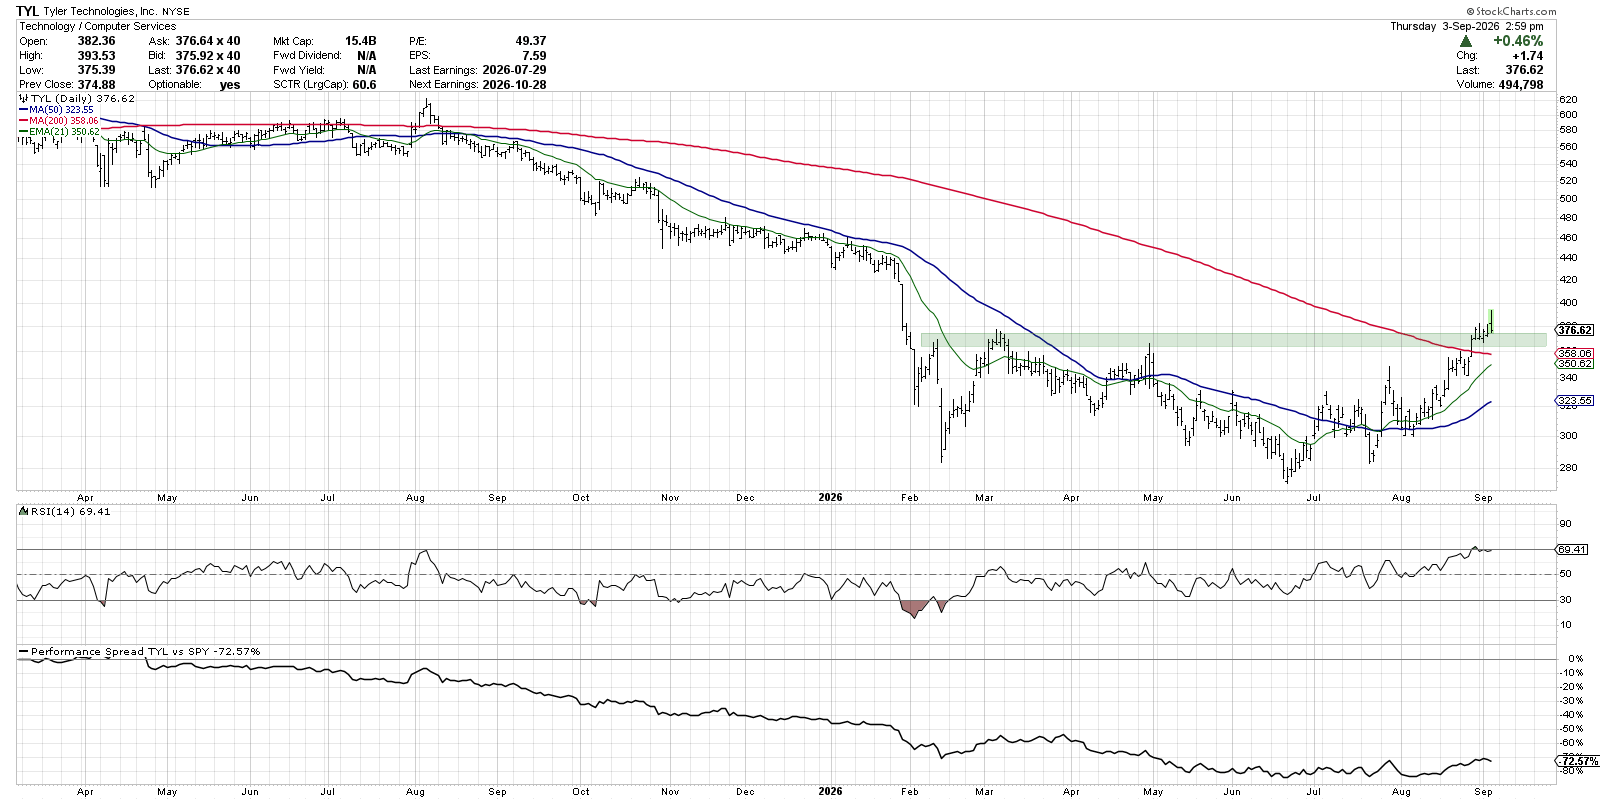
That higher RSI reading is an important feature of this chart, and it speaks to a rotation from a consolidation phase to an accumulation phase. During the downtrend phase in 2025, the RSI rarely pushed above 60. For most of 2026, the RSI has been rangebound between 40 and 60, indicating neutral momentum and a lack of conviction.
This recent price breakout involved the RSI popping out of the neutral range, and the recent overbought condition speaks to the influx of buying power for this $15 billion market cap technology play. As long as the RSI remains in the bullish range, and the price remains safely above the 200-day moving average, we’re considering this an emerging leader within a struggling sector.
By the way, these three charts were featured in our Top Ten Charts to Watch for September. Check out the video below for the full list, and review all ten charts in our September Top Ten ChartList!
RR#6,
Dave
P.S. Ready to upgrade your investment process? Check out my free behavioral investing course!
David Keller, CMT
President and Chief Strategist
Sierra Alpha Research LLC
marketmisbehavior.com
https://www.youtube.com/c/MarketMisbehavior
Disclaimer: This blog is for educational purposes only and should not be construed as financial advice. The ideas and strategies should never be used without first assessing your own personal and financial situation, or without consulting a financial professional.
The author does not have a position in mentioned securities at the time of publication. Any opinions expressed herein are solely those of the author and do not in any way represent the views or opinions of any other person or entity.